 Are you a Long-Term Trader? Then take a look at our NEW RoboInvestor Service?
CLICK HERE TO LEARN MORE
Are you a Long-Term Trader? Then take a look at our NEW RoboInvestor Service?
CLICK HERE TO LEARN MORE
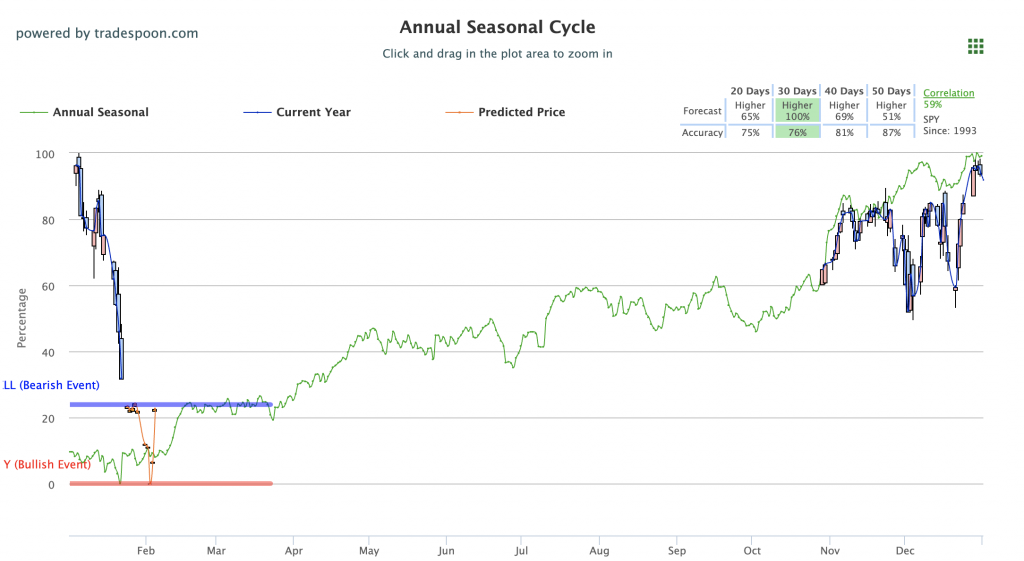
At the close of trading on Monday, all three major U.S. indices were able to, surprisingly, close in the green after some early and mid-day volatility. During the day, the Dow fell more than 1,100 points amid a stock market sell-off ahead of this week’s Federal Open Market Committee meeting. To close last week’s, stocks hit a major low across the board with all three major U.S. indices recording significant drops. With several factors dictating the market, the $VIX traded higher, near 40 level and the $QQQ short term is oversold; resulting in what will most likely be a retest of the March-May 2020 low. The Fed decision on Wednesday, escalation in Ukraine, and earnings this week can impact the next move in the market. We are watching the vital support levels in the SPY, which are presently at $420 and then $400 and we expect the market to stage a strong rebound in the next 1-2 weeks. Globally, Asian markets finished with mixed results while European markets closed significantly lower. We encourage all market commentary readers to maintain clearly defined stop levels for all positions. For reference, the SPY Seasonal Chart is shown below:
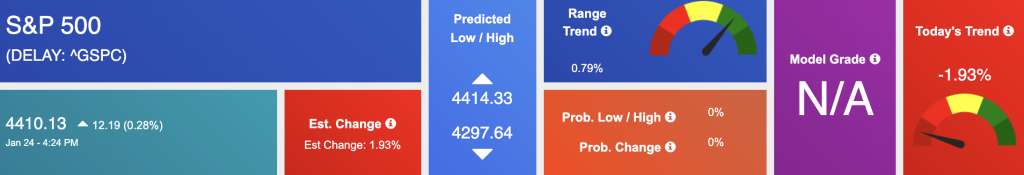
Using the “^GSPC” symbol to analyze the S&P 500 our 10-day prediction window shows a near-term mixed outlook. Prediction data is uploaded after the market closes at 6 p.m. CST. Today’s data is based on market signals from the previous trading session.
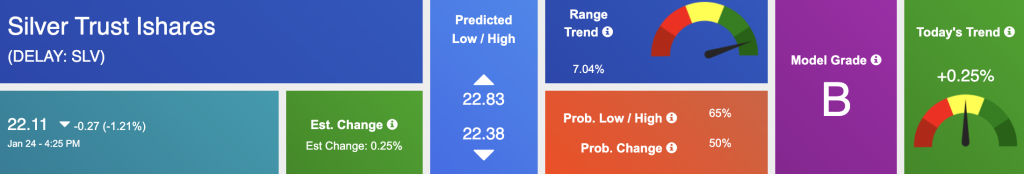
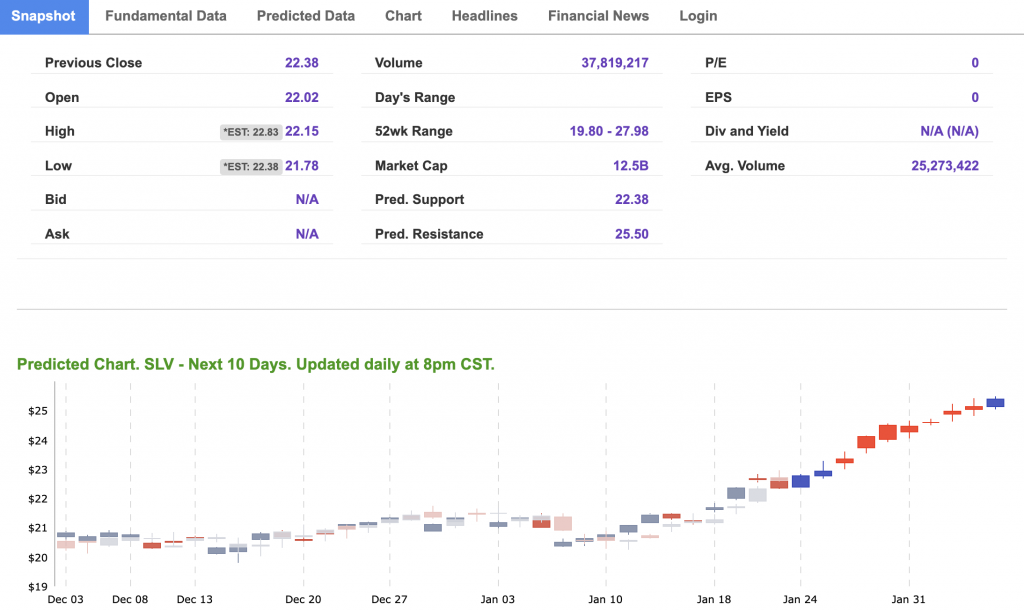
The symbol is trading at $22.11 with a vector of +0.25% at the time of publication.
10-Day Prediction data is uploaded after the market close at 6 p.m., CST. Today’s data is based on market signals from the previous trading session.
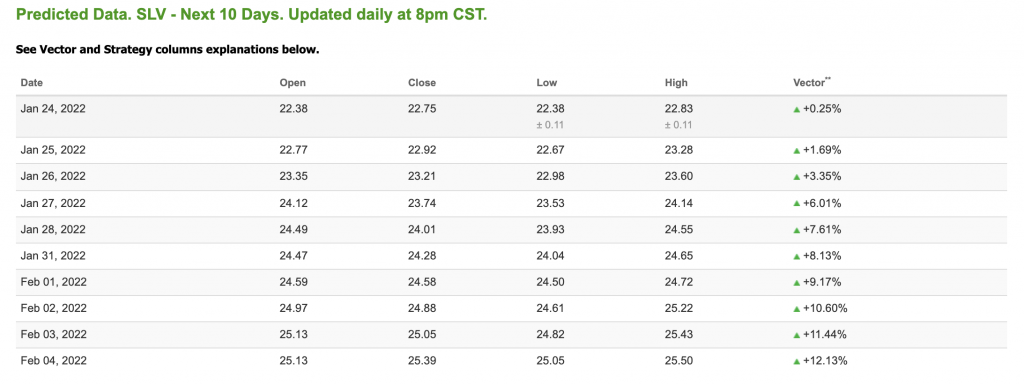
Note: The Vector column calculates the change of the Forecasted Average Price for the next trading session relative to the average of actual prices for the last trading session. The column shows the expected average price movement “Up or Down”, in percent. Trend traders should trade along the predicted direction of the Vector. The higher the value of the Vector the higher its momentum.
*Please note: At the time of publication Vlad Karpel does not have a position in the featured symbol, slv. Our featured symbol is part of your free subscription service. It is not included in any paid Tradespoon subscription service. Vlad Karpel only trades his money in paid subscription services. If you are a paid subscriber, please review your Premium Member Picks, ActiveTrader, or MonthlyTrader recommendations. If you are interested in receiving Vlad’s picks, please click here.
West Texas Intermediate for Crude Oil delivery (CL.1) is priced at $84.08 per barrel, down 1.25% at the time of publication.
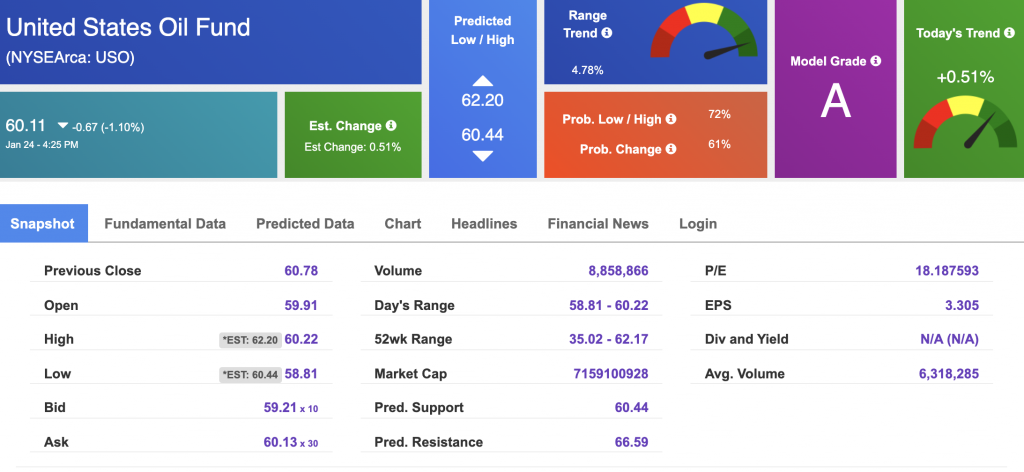
Looking at USO, a crude oil tracker, our 10-day prediction model shows mixed signals. The fund is trading at $60.11 at the time of publication. Prediction data is uploaded after the market close at 6 p.m., CST. Today’s data is based on market signals from the previous trading session.
The price for the Gold Continuous Contract (GC00) is up 0.63% at $1843.70 at the time of publication.
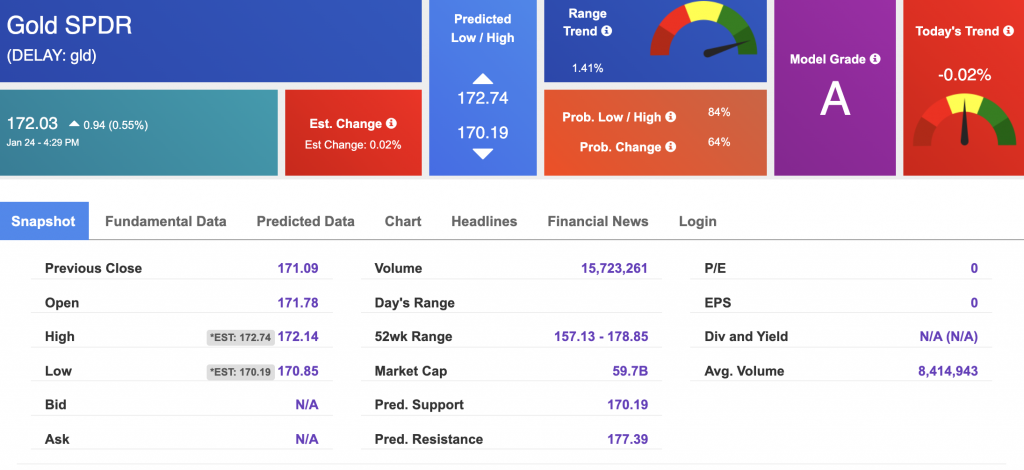
Using SPDR GOLD TRUST (GLD) as a tracker in our Stock Forecast Tool, the 10-day prediction window shows mixed signals. The gold proxy is trading at $172.03 at the time of publication. Vector signals show -0.02% for today. Prediction data is uploaded after the market close at 6 p.m., CST. Today’s data is based on market signals from the previous trading session.
The yield on the 10-year Treasury note is up, at 1.771% at the time of publication.
The yield on the 30-year Treasury note is up, at 2.114% at the time of publication.
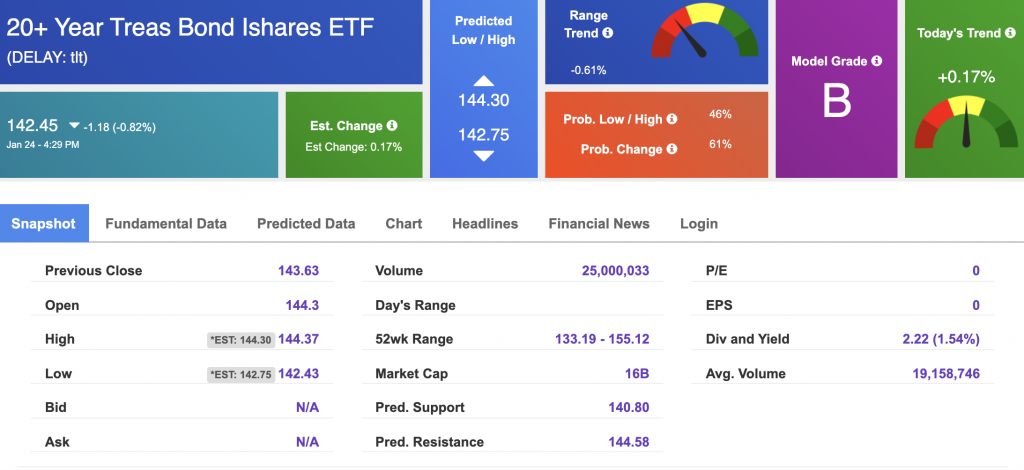
Using the iShares 20+ Year Treasury Bond ETF (TLT) as a proxy for bond prices in our Stock Forecast Tool, we see mixed signals in our 10-day prediction window. Prediction data is uploaded after the market close at 6 p.m., CST. Today’s data is based on market signals from the previous trading session.
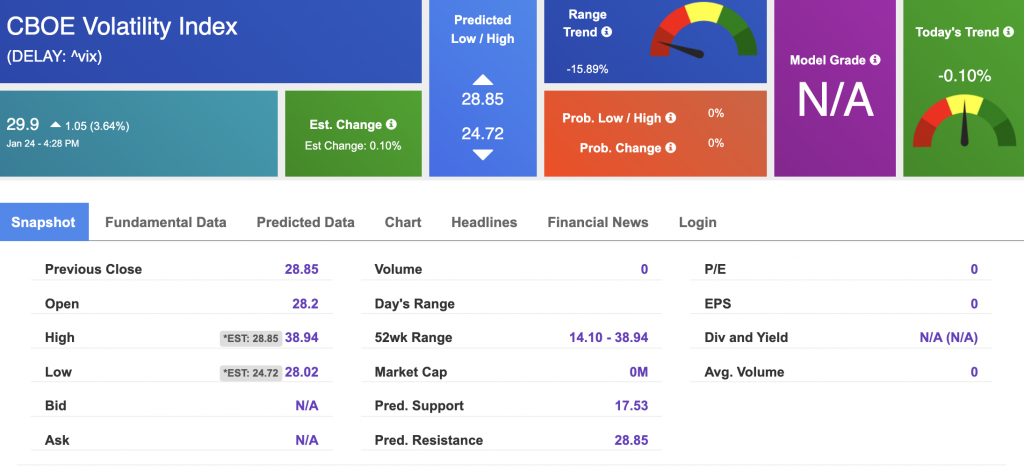
The CBOE Volatility Index (^VIX) is $29.9 at the time of publication, and our 10-day prediction window shows mixed signals. Prediction data is uploaded after the market close at 6 p.m., CST. Today’s data is based on market signals from the previous trading session.
Please share this Tradespoon Market Commentary with your friends.
![]()

![]()
Comments Off on


Tradespoon Tools make finding winning trades in minute as easy as 1-2-3.
Our simple 3 step approach has resulted in an average return of almost 20% per trade!

