 Save Big on Commissions ($0.65 per Contract)
CLICK HERE TO LEARN MORE
Save Big on Commissions ($0.65 per Contract)
CLICK HERE TO LEARN MORE
After opening the week to two losing sessions, U.S. stocks finished higher on Wednesday with all three major U.S. indices closing in the green. Headline news from D.C. signaled President Biden’s student loan forgiveness initiative, which will erase $10,000-$20,000 in debt per student. Concerns about a hawkish stance from the Federal Reserve have been weighing on equities this week ahead of the annual Jackson Hole Economic Symposium. Fed Chair Powell is scheduled to speak on Friday and will provide further guidance on the Fed outlook and potential action going into the upcoming Federal Open Market Committee meetings. The dollar continues to benefit from the latest market sentiment as it hit a 20-year high, with the $DXY above $108.
Major market movers today included Peloton and Nordstrom which saw shares move in a drastic fashion. After Peloton Interactive Inc. announced a deal to sell its products on Amazon, shares of the company jumped 20.4%. Nordstrom Inc.’s shares tanked 19.9% after the company announced that its sales and profit for the year would be lower than expected. Oil and gold both rose today while Bitcoin finished flat. Key economic reports still due this week include Q2 GDP data on Thursday, and PCE info on Friday, prior to the Jackson Hole summit.
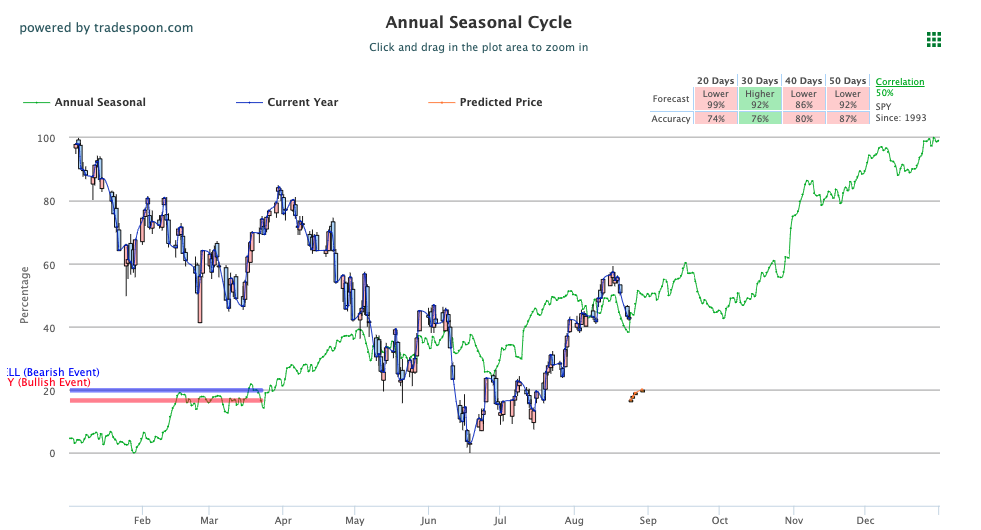
The $VIX rose over the past few days and is trading near the $24 level. The $NTAP, $INTU, and $CRM earnings, as well as GDP, PCE, and Powell’s interview on Friday, can influence the next move in the market. We are watching the overhead resistance levels in the SPY, which are presently at $417 and then $422. The $SPY support is at $406 and then $398. We expect the market to continue the current pullback for the next 4-8 weeks. Globally, Asian markets unanimously closed in the red while European markets saw mixed results. We encourage all market commentary readers to maintain clearly defined stop levels for all positions. For reference, the SPY Seasonal Chart is shown below:
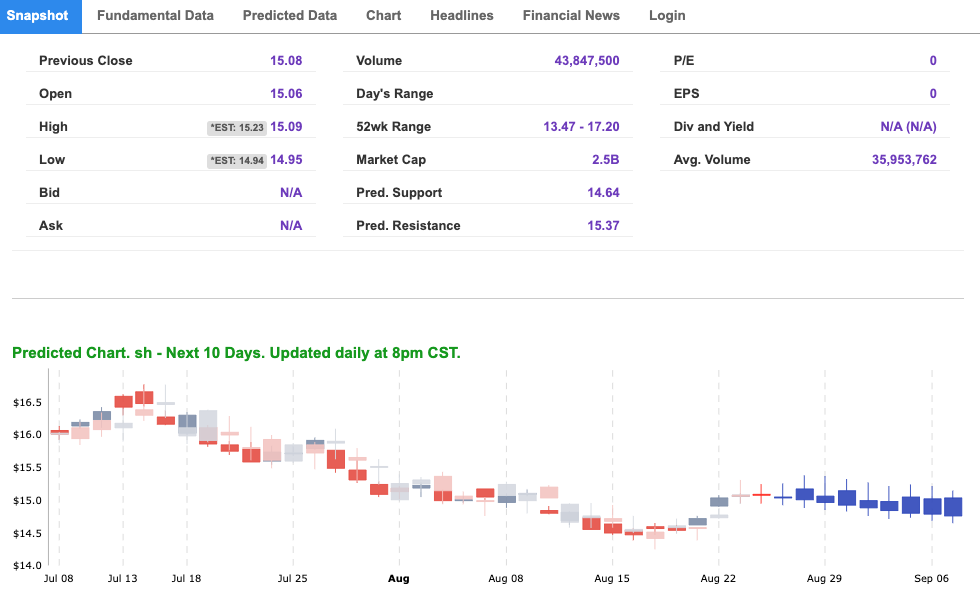
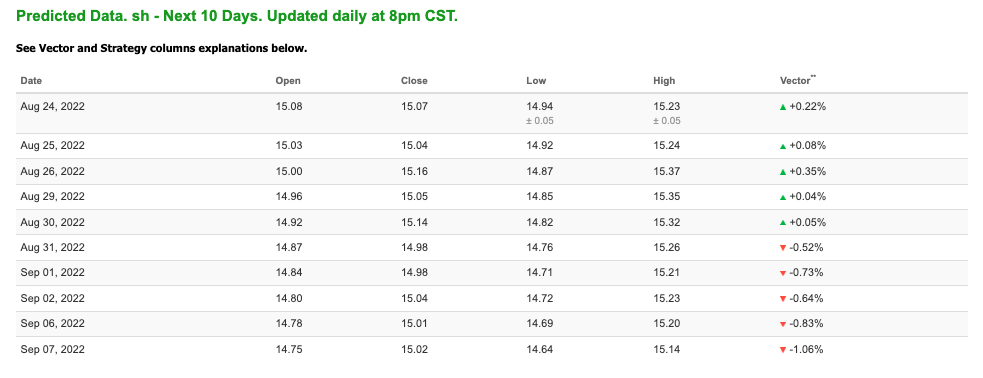
Note: The Vector column calculates the change of the Forecasted Average Price for the next trading session relative to the average of actual prices for the last trading session. The column shows the expected average price movement “Up or Down”, in percent. Trend traders should trade along the predicted direction of the Vector. The higher the value of the Vector the higher its momentum.
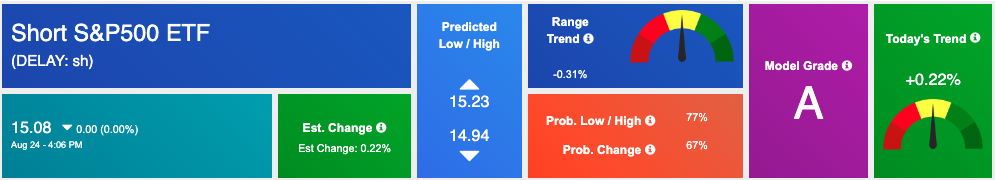
*Please note: At the time of publication Vlad Karpel does have a position in the featured symbol, SH. Our featured symbol is part of your free subscription service. It is not included in any paid Tradespoon subscription service. Vlad Karpel only trades his money in paid subscription services. If you are a paid subscriber, please review your Premium Member Picks, ActiveTrader, or MonthlyTrader recommendations. If you are interested in receiving Vlad’s picks, please click here.
West Texas Intermediate for Crude Oil delivery (CL.1) is priced at $95.37 per barrel, up 1.74%, at the time of publication.
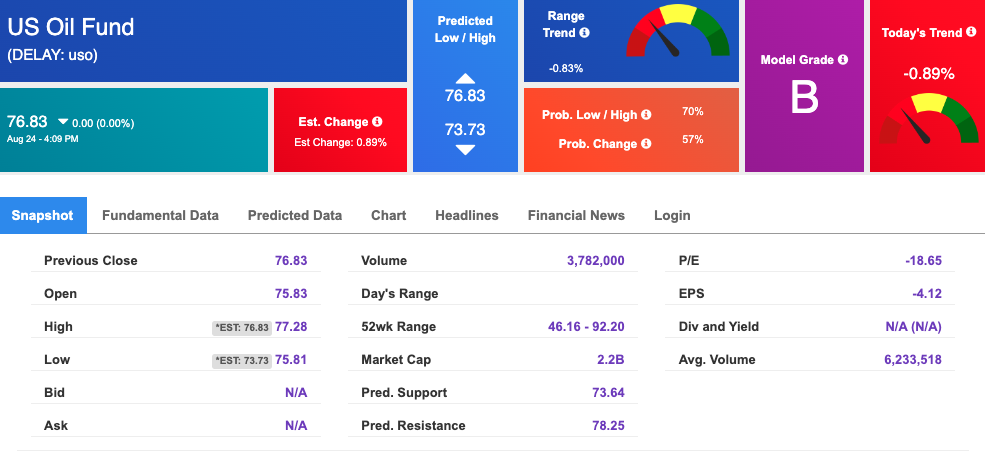
Looking at USO, a crude oil tracker, our 10-day prediction model shows mixed signals. The fund is trading at $76.83 at the time of publication. Prediction data is uploaded after the market close at 6 p.m., CST. Today’s data is based on market signals from the previous trading session.
The price for the Gold Continuous Contract (GC00) is up 0.17% at $1764.20 at the time of publication.
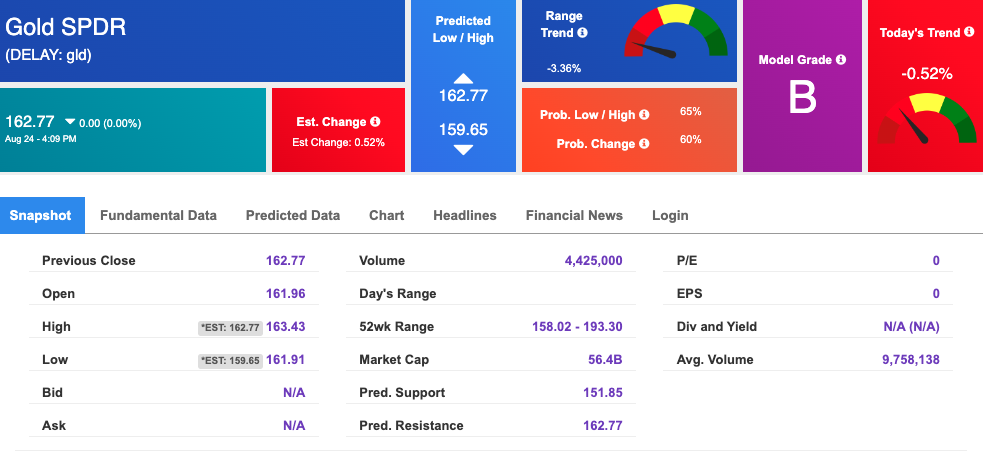
Using SPDR GOLD TRUST (GLD) as a tracker in our Stock Forecast Tool, the 10-day prediction window shows mixed signals. The gold proxy is trading at $162.77 at the time of publication. Vector signals show -0.52% for today. Prediction data is uploaded after the market close at 6 p.m., CST. Today’s data is based on market signals from the previous trading session.
The yield on the 10-year Treasury note is up, at 3.109% at the time of publication.
The yield on the 30-year Treasury note is up, at 3.315% at the time of publication.
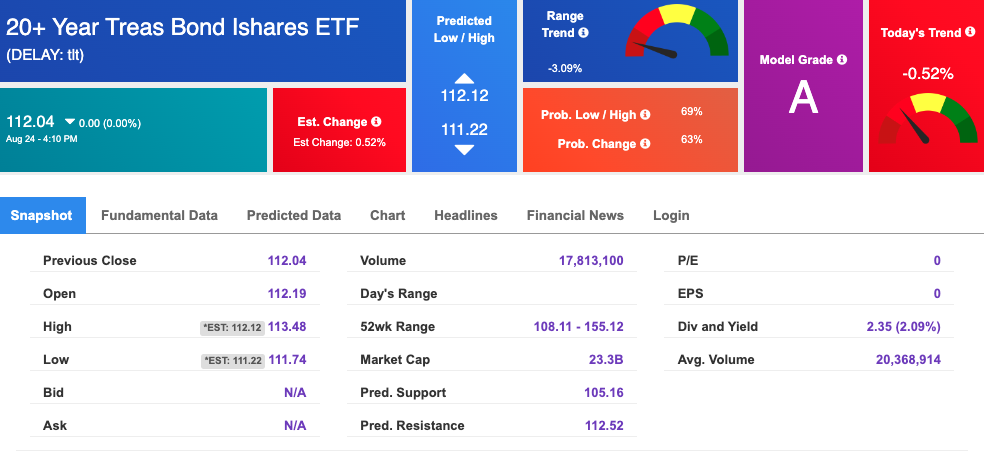
Using the iShares 20+ Year Treasury Bond ETF (TLT) as a proxy for bond prices in our Stock Forecast Tool, we see mixed signals in our 10-day prediction window. Prediction data is uploaded after the market close at 6 p.m., CST. Today’s data is based on market signals from the previous trading session.
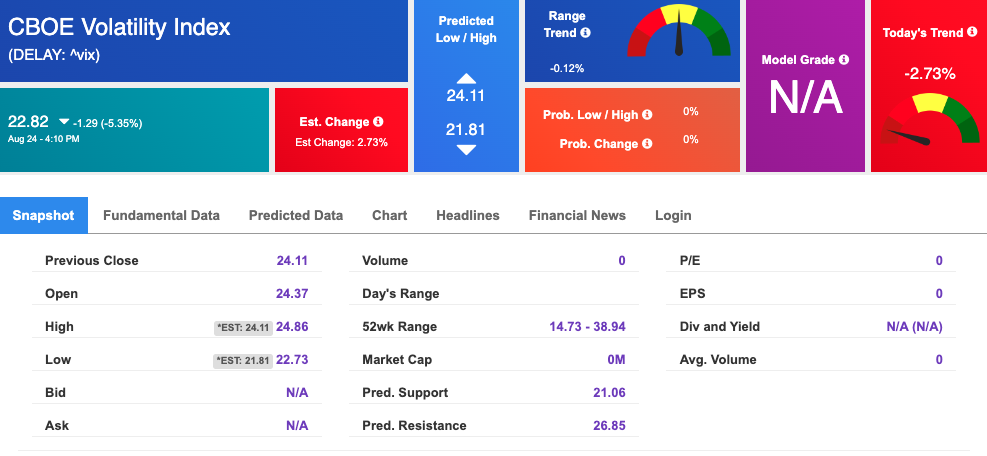
The CBOE Volatility Index (^VIX) is $22.82 at the time of publication, and our 10-day prediction window shows mixed signals. Prediction data is uploaded after the market close at 6 p.m., CST. Today’s data is based on market signals from the previous trading session.
Please share this Tradespoon Market Commentary with your friends.
![]()

![]()
Comments Off on


Tradespoon Tools make finding winning trades in minute as easy as 1-2-3.
Our simple 3 step approach has resulted in an average return of almost 20% per trade!