 Are you a Long-Term Trader? Then take a look at our NEW RoboInvestor Service?
CLICK HERE TO LEARN MORE
Are you a Long-Term Trader? Then take a look at our NEW RoboInvestor Service?
CLICK HERE TO LEARN MORE
After the 10-year Treasury bond yield reached its highest level in 12 years, major U.S. indices snapped a two-day winning session. The streak to open the week was powered by positive earnings reports, which continued today, however, markets were not able to withstand the peak in yields and closed in the red. All three major U.S. indices traded lower today although we did see several strong economic reports released. Netflix shares were up 13% today Q3 data returned better than expected. Tesla and IBM are due today after the close. On Thursday, look out for earnings from American Airlines, AT&T, and Snap, while Friday will feature American Express and Verizon.
In other U.S. economic data, The Commerce Department reported Wednesday that construction on new U.S. homes fell 8.1% in September, down from the 13.7% increase seen in August, totaling a seasonally adjusted annual pace of 1.44 million buildings. Also released today, the latest Beige Book showed what many expected: inflation continues to be a major concern throughout all 12 financial districts. Still, there were positive signs in the reports such as “modest” growth for the U.S. economy.
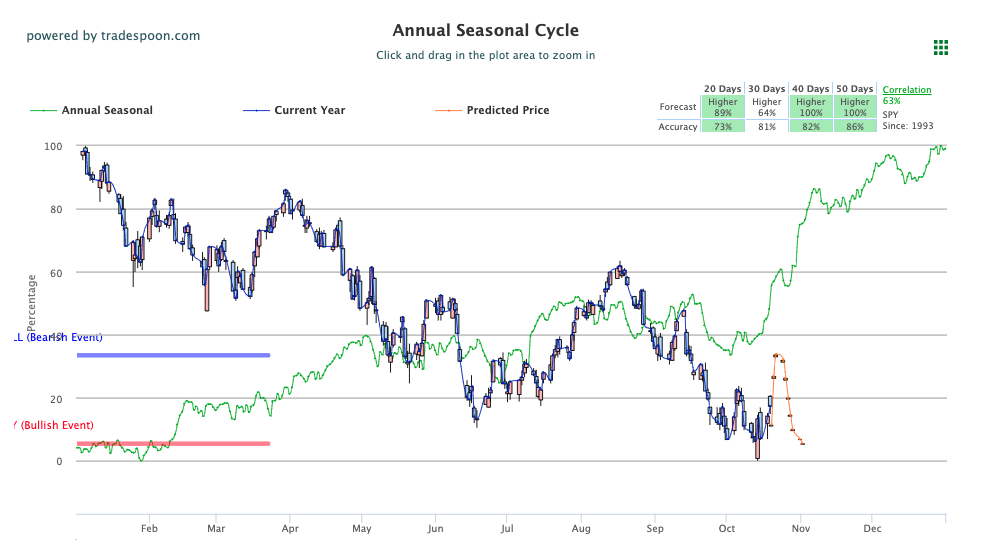
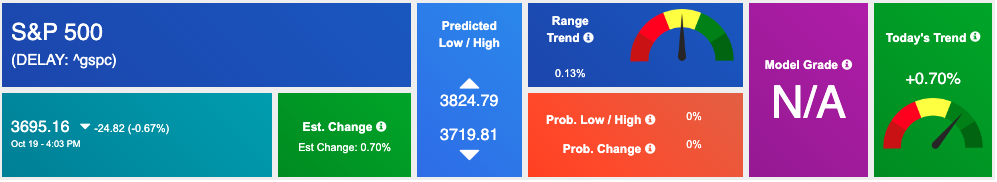
The $VIX is trading near the $31 level and we are watching earnings season ahead of the upcoming midterm election, which could be the next market mover. We are monitoring the overhead resistance levels in the SPY, which are presently at $380 and then $390. The $SPY support is at $367 and then $357. We expect the market to continue the bottoming process for the next 2-4 weeks. The market is currently oversold and can stage a rally in the short term. He would recommend buying into any further sell-offs and not chasing the market to the downside. Globally, Asian markets finished with mixed results while European markets closed in the red. We encourage all market commentary readers to maintain clearly defined stop levels for all positions. For reference, the SPY Seasonal Chart is shown below:
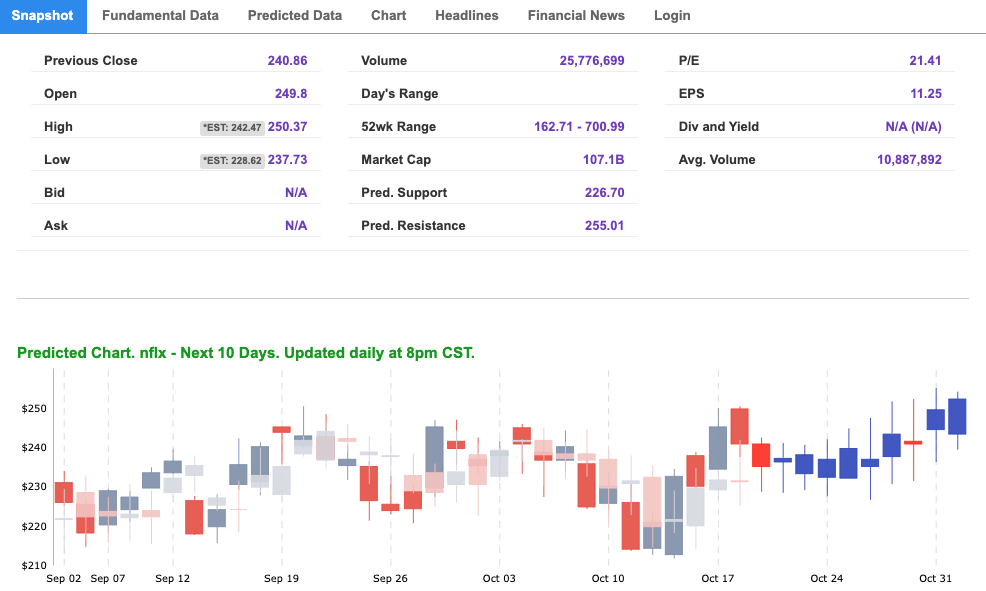
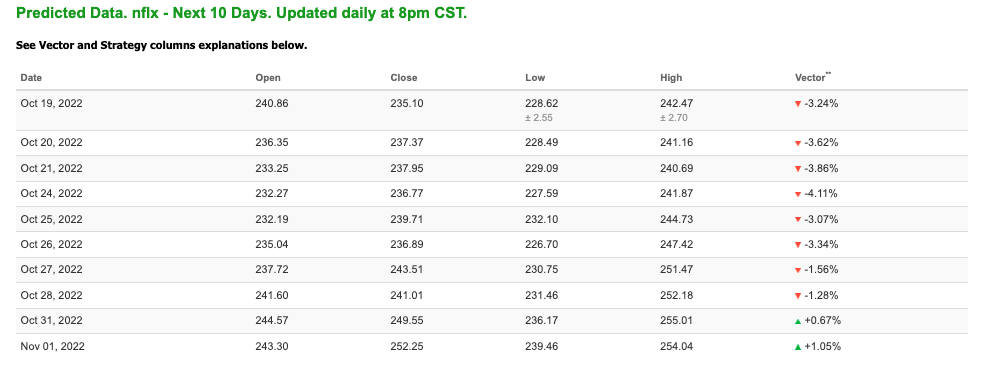
Note: The Vector column calculates the change of the Forecasted Average Price for the next trading session relative to the average of actual prices for the last trading session. The column shows the expected average price movement “Up or Down”, in percent. Trend traders should trade along the predicted direction of the Vector. The higher the value of the Vector the higher its momentum.
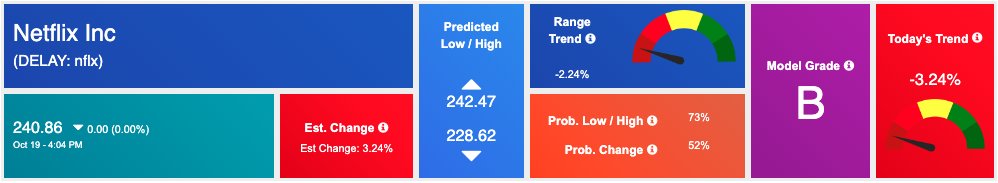
*Please note: At the time of publication Vlad Karpel does have a position in the featured symbol, nflx. Our featured symbol is part of your free subscription service. It is not included in any paid Tradespoon subscription service. Vlad Karpel only trades his money in paid subscription services. If you are a paid subscriber, please review your Premium Member Picks, ActiveTrader, or MonthlyTrader recommendations. If you are interested in receiving Vlad’s picks, please click here.
West Texas Intermediate for Crude Oil delivery (CL.1) is priced at $85.87 per barrel, up 3.68%, at the time of publication.
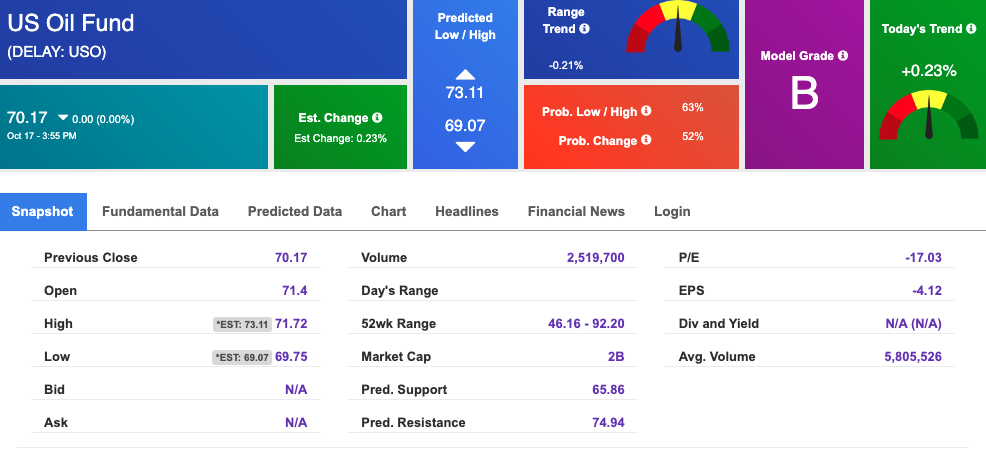
Looking at USO, a crude oil tracker, our 10-day prediction model shows mixed signals. The fund is trading at $70.17 at the time of publication. Prediction data is uploaded after the market close at 6 p.m., CST. Today’s data is based on market signals from the previous trading session.
The price for the Gold Continuous Contract (GC00) is down 1.30% at $1634.30 at the time of publication.
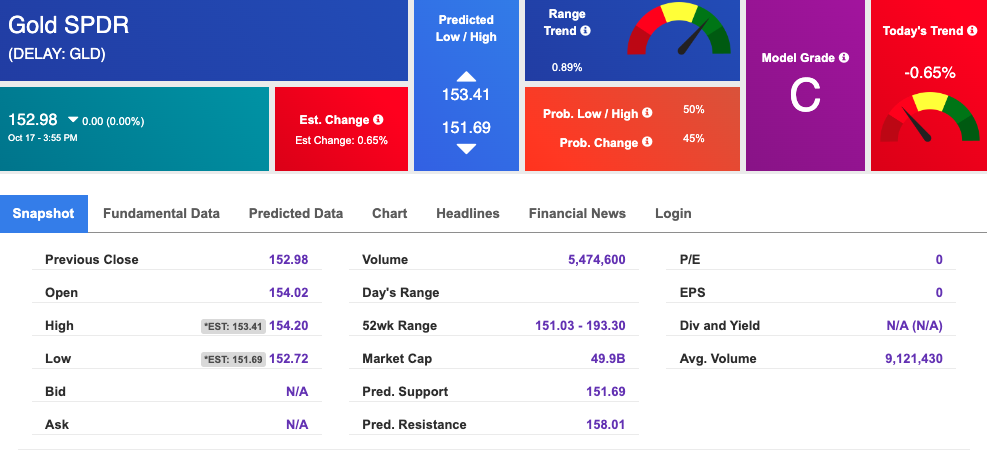
Using SPDR GOLD TRUST (GLD) as a tracker in our Stock Forecast Tool, the 10-day prediction window shows mixed signals. The gold proxy is trading at $152.98 at the time of publication. Vector signals show -0.65% for today. Prediction data is uploaded after the market close at 6 p.m., CST. Today’s data is based on market signals from the previous trading session.
The yield on the 10-year Treasury note is up at 4.139% at the time of publication.
The yield on the 30-year Treasury note is up at 4.127% at the time of publication.
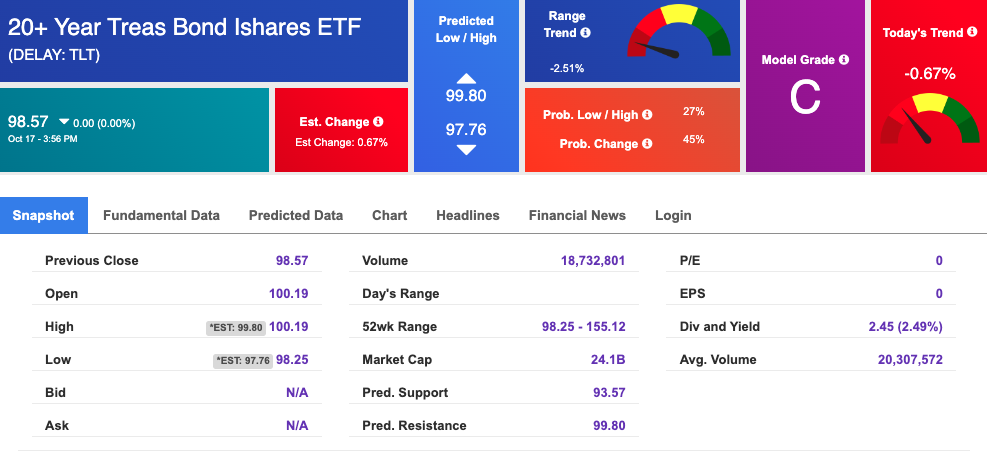
Using the iShares 20+ Year Treasury Bond ETF (TLT) as a proxy for bond prices in our Stock Forecast Tool, we see mixed signals in our 10-day prediction window. Prediction data is uploaded after the market close at 6 p.m., CST. Today’s data is based on market signals from the previous trading session.
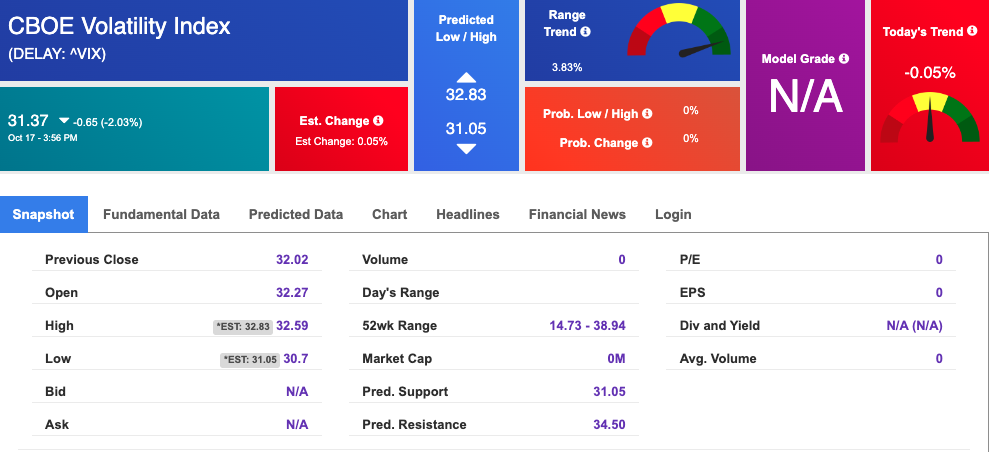
The CBOE Volatility Index (^VIX) is $31.37 at the time of publication, and our 10-day prediction window shows mixed signals. Prediction data is uploaded after the market close at 6 p.m., CST. Today’s data is based on market signals from the previous trading session.
Please share this Tradespoon Market Commentary with your friends.
![]()

![]()
Comments Off on


Tradespoon Tools make finding winning trades in minute as easy as 1-2-3.
Our simple 3 step approach has resulted in an average return of almost 20% per trade!