 Are you a Long-Term Trader? Then take a look at our NEW RoboInvestor Service?
CLICK HERE TO LEARN MORE
Are you a Long-Term Trader? Then take a look at our NEW RoboInvestor Service?
CLICK HERE TO LEARN MORE
Stocks rebounded from a low open on Monday, extending the Dow’s longest unbeaten run since late May. The latest reports from U.S. and China showed soft data which missed forecasts but largely did not impact market direction. All three major U.S. indices closed in the green after posting impressive gains last week. As of Monday, the tech-heavy Nasdaq Composite has surged 23.3% off its mid-June low. This week’s $WMT, $HD, and $ADI earnings can influence the next move in the market. Additional reports that can influence the market this week include monthly retail sales, business inventories, and the industrial production index.
After reversing course from a lower open, when bad economic news out of China set a pessimistic tone, stocks ended the day higher. This came after China’s retail sales, investment, and industrial output all came in lower than expected while the country’s central bank cut lending rates. In the U.S., the business conditions index, a measure of manufacturing activity in the state, fell 42.4 points to a negative 31.3 in August. Stocks rose last week as the US consumer-price index and producer-price index showed inflation slowing, but remained extremely high. The National Association of Home Builders’ monthly confidence index fell 6 points to 49 in August, according to the trade group.
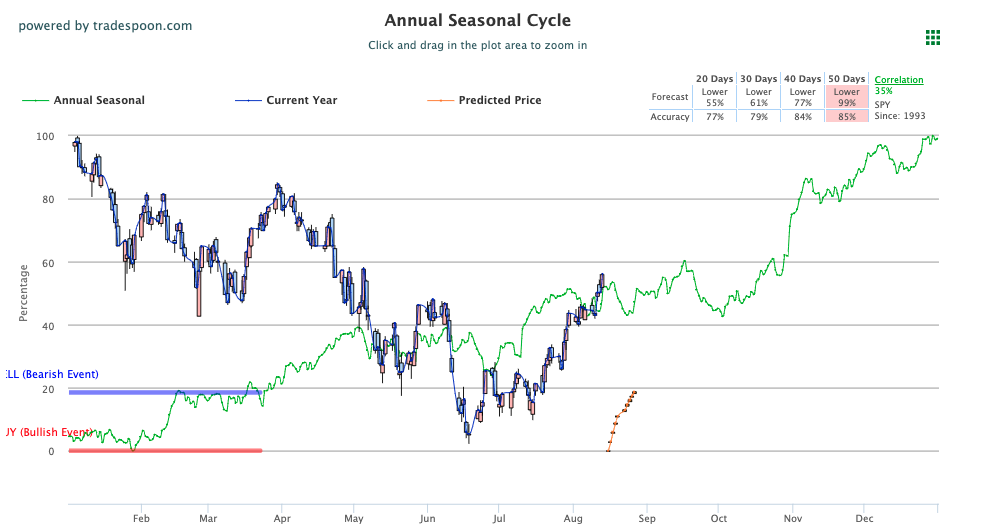
We are watching the overhead resistance levels in the SPY, which are presently at $430 and then $440. The $SPY support is at $420 and then $406. We expect the market to continue the short-term rally for the next few weeks. We’d be a seller in any further rallies, and we advise subscribers not to chase the market at these prices. Globally, European markets traded higher while Asian markets traded closed with mixed results. We encourage all market commentary readers to maintain clearly defined stop levels for all positions. For reference, the SPY Seasonal Chart is shown below:
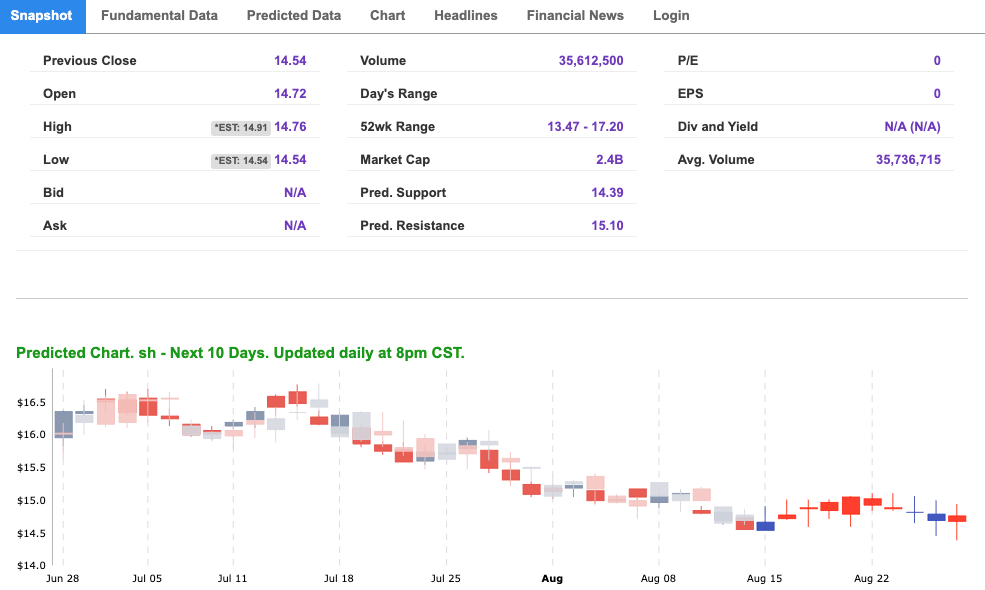
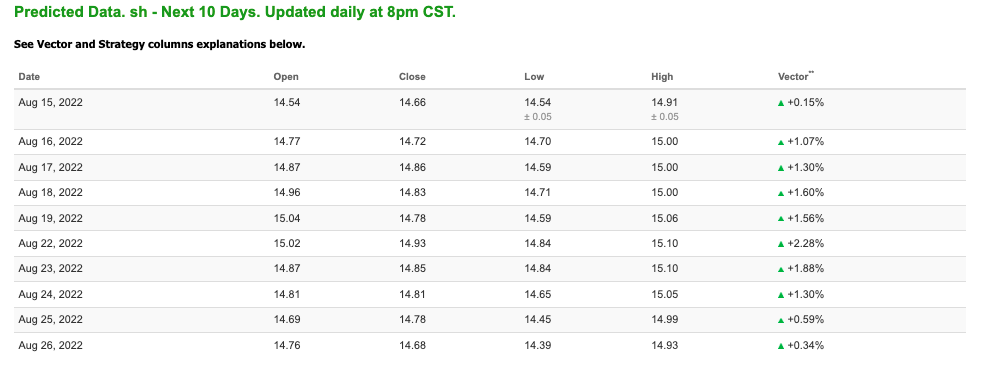
Note: The Vector column calculates the change of the Forecasted Average Price for the next trading session relative to the average of actual prices for the last trading session. The column shows the expected average price movement “Up or Down”, in percent. Trend traders should trade along the predicted direction of the Vector. The higher the value of the Vector the higher its momentum.
*Please note: At the time of publication Vlad Karpel does have a position in the featured symbol, SH. Our featured symbol is part of your free subscription service. It is not included in any paid Tradespoon subscription service. Vlad Karpel only trades his money in paid subscription services. If you are a paid subscriber, please review your Premium Member Picks, ActiveTrader, or MonthlyTrader recommendations. If you are interested in receiving Vlad’s picks, please click here.
West Texas Intermediate for Crude Oil delivery (CL.1) is priced at $87.86 per barrel, down 4.58%, at the time of publication.
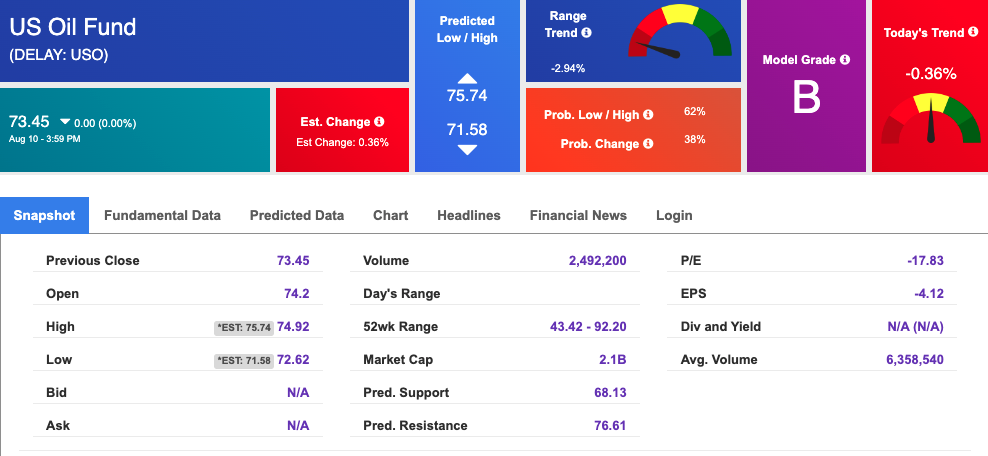
Looking at USO, a crude oil tracker, our 10-day prediction model shows mixed signals. The fund is trading at $73.45 at the time of publication. Prediction data is uploaded after the market close at 6 p.m., CST. Today’s data is based on market signals from the previous trading session.
The price for the Gold Continuous Contract (GC00) is down 1.12% at $1795.20 at the time of publication.
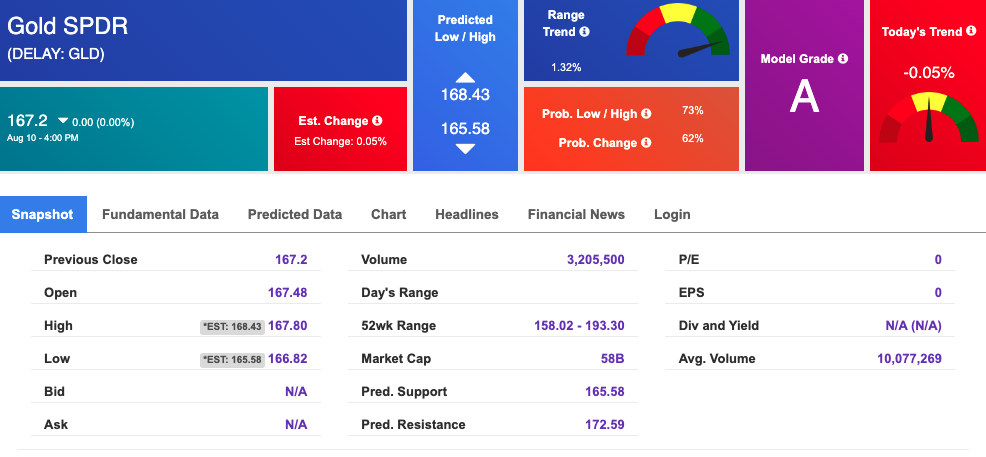
Using SPDR GOLD TRUST (GLD) as a tracker in our Stock Forecast Tool, the 10-day prediction window shows mixed signals. The gold proxy is trading at $167.2 at the time of publication. Vector signals show -0.05% for today. Prediction data is uploaded after the market close at 6 p.m., CST. Today’s data is based on market signals from the previous trading session.
The yield on the 10-year Treasury note is down, at 2.787% at the time of publication.
The yield on the 30-year Treasury note is down, at 3.103% at the time of publication.
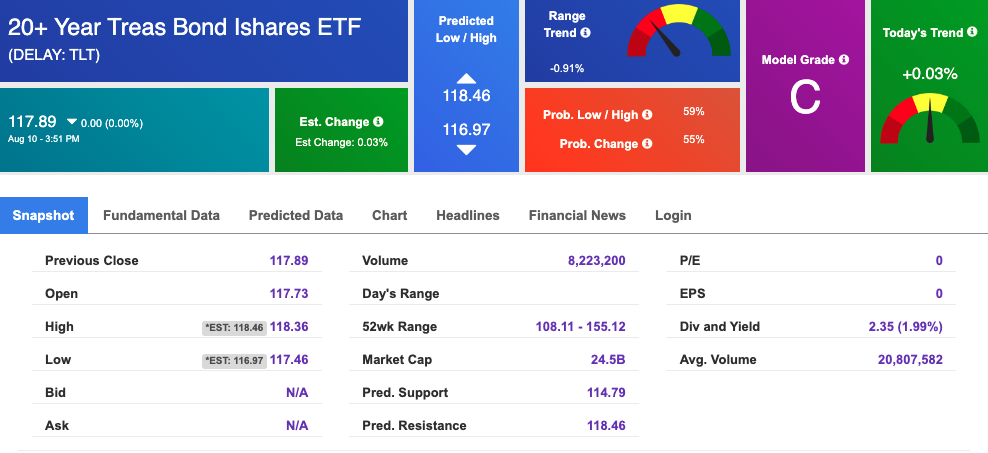
Using the iShares 20+ Year Treasury Bond ETF (TLT) as a proxy for bond prices in our Stock Forecast Tool, we see mixed signals in our 10-day prediction window. Prediction data is uploaded after the market close at 6 p.m., CST. Today’s data is based on market signals from the previous trading session.
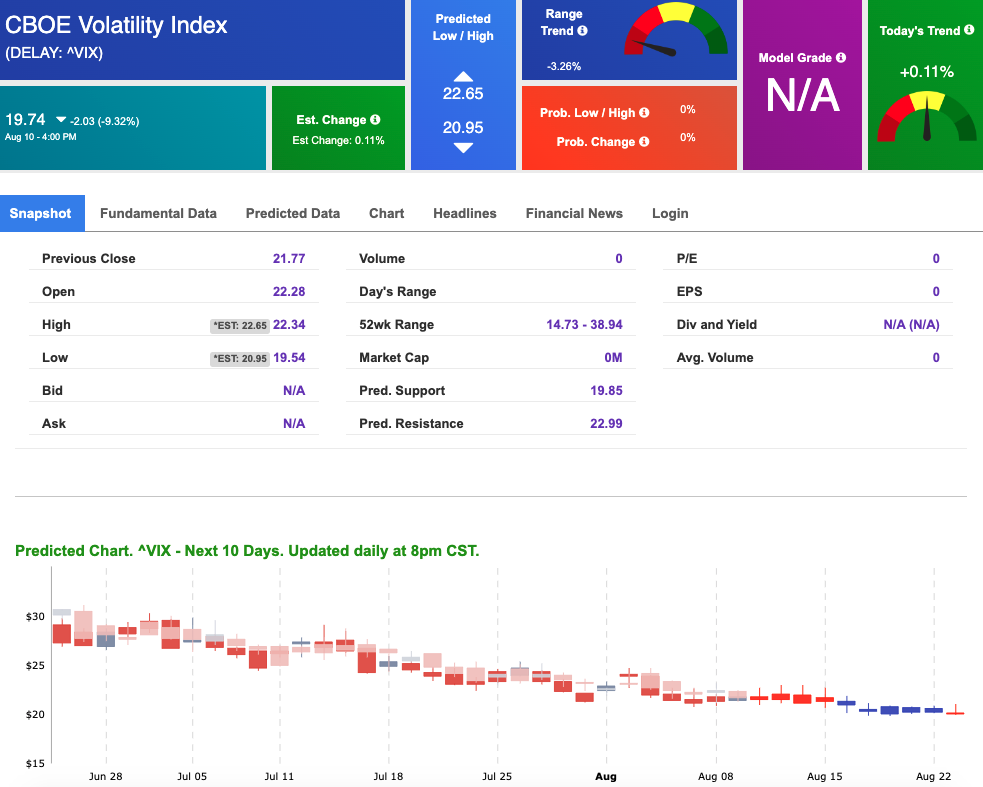
The CBOE Volatility Index (^VIX) is $19.74 at the time of publication, and our 10-day prediction window shows mixed signals. Prediction data is uploaded after the market close at 6 p.m., CST. Today’s data is based on market signals from the previous trading session.
Please share this Tradespoon Market Commentary with your friends.
![]()

![]()
Comments Off on


Tradespoon Tools make finding winning trades in minute as easy as 1-2-3.
Our simple 3 step approach has resulted in an average return of almost 20% per trade!