 Are you a Long-Term Trader? Then take a look at our NEW RoboInvestor Service?
CLICK HERE TO LEARN MORE
Are you a Long-Term Trader? Then take a look at our NEW RoboInvestor Service?
CLICK HERE TO LEARN MORE
In a positive start to the week, all three major U.S. indices closed in the green, fueled by investor anticipation of June’s consumer price index (CPI) reading scheduled for release on Wednesday and the upcoming earnings season. Market participants are closely watching these events as they seek insights into the broader economy and the Federal Reserve’s stance on fighting inflation.
The eagerly awaited consumer price index report, due on Wednesday, is expected to provide crucial indications of economic health. With the Fed maintaining its guidance that two more rate hikes will be necessary to combat inflation, investors are eager to gauge the current economic conditions. Cleveland Fed President Loretta Mester and the San Francisco Fed’s Mary Daly have also expressed their support for additional rate hikes this year, further shaping market sentiment.
Adding to the financial landscape, the Federal Reserve’s top banking regulator, Michael Barr, unveiled proposed efforts on Monday to enhance regulations and increase capital requirements for banks with assets totaling $100 billion or more. This move is part of a broader initiative aimed at bolstering stability in the financial system. Barr’s proposal includes adjustments to risk-based requirements, stress testing, risk-based capital buffers, and leverage requirements. If implemented, these changes would effectively mandate the largest banks to hold an additional 2 percentage points of capital, surpassing current requirements.
Investor focus also turns to the upcoming earnings season, which kicks off this week. Major banks such as JPMorgan Chase, Citigroup, and Wells Fargo are set to report their second-quarter results on Friday. These reports will be closely scrutinized as they play a pivotal role in shaping market direction, particularly as they are compared to the previous quarter’s performance.
Meanwhile, tech stocks experienced movement following Nasdaq’s announcement of a “special rebalance” of the weightings on the Nasdaq 100 later this month. The rebalancing aims to address concerns arising from the surge in shares of the largest tech companies within the index.
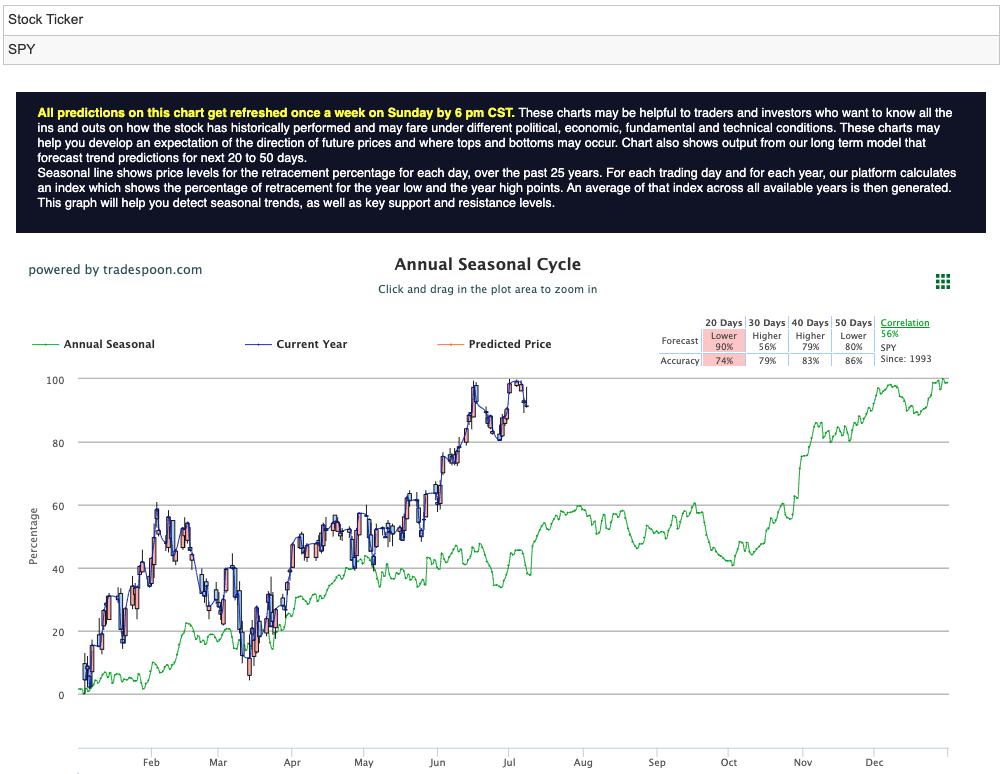
Looking ahead, the SPY is currently trading within the range of 445 and 447, with the August high serving as a critical threshold to maintain the bullish trend. However, a dip below 432 could trigger a swift retest of previous support levels. Market analysts hold a bearish outlook for the second half of the year, with the upcoming Q2 earnings season playing a decisive role in shaping market direction as results are compared to the previous quarter’s figures. Market commentary readers should maintain clearly defined stop levels for all positions. For reference, the SPY Seasonal Chart is shown below:
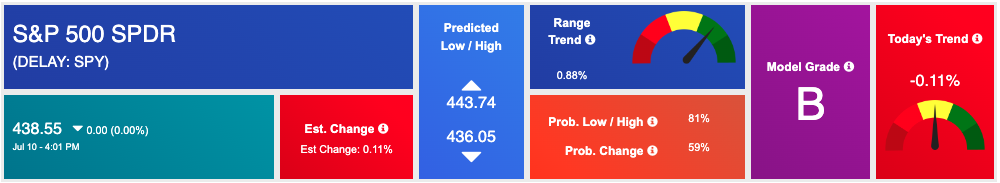
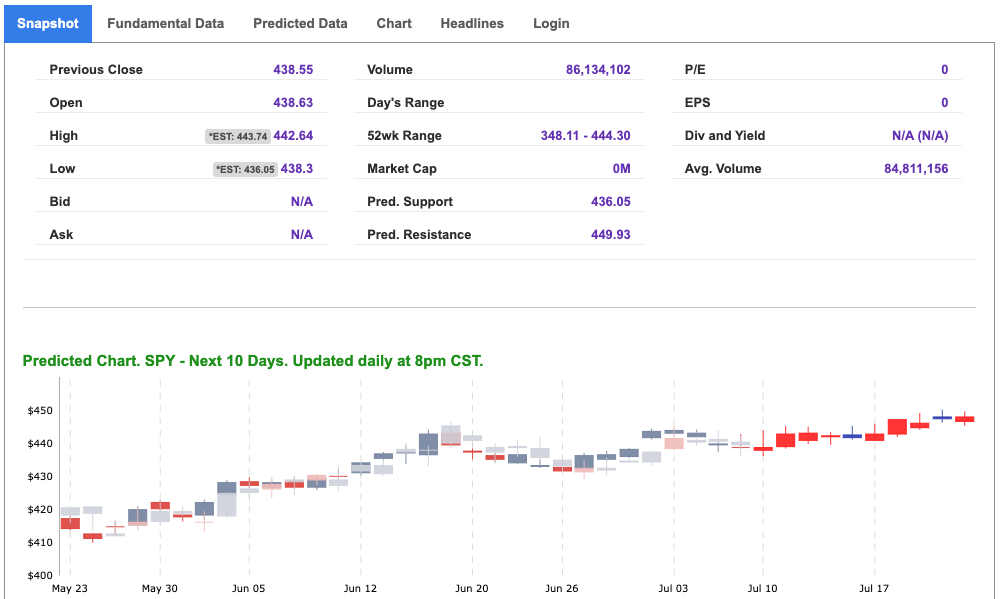
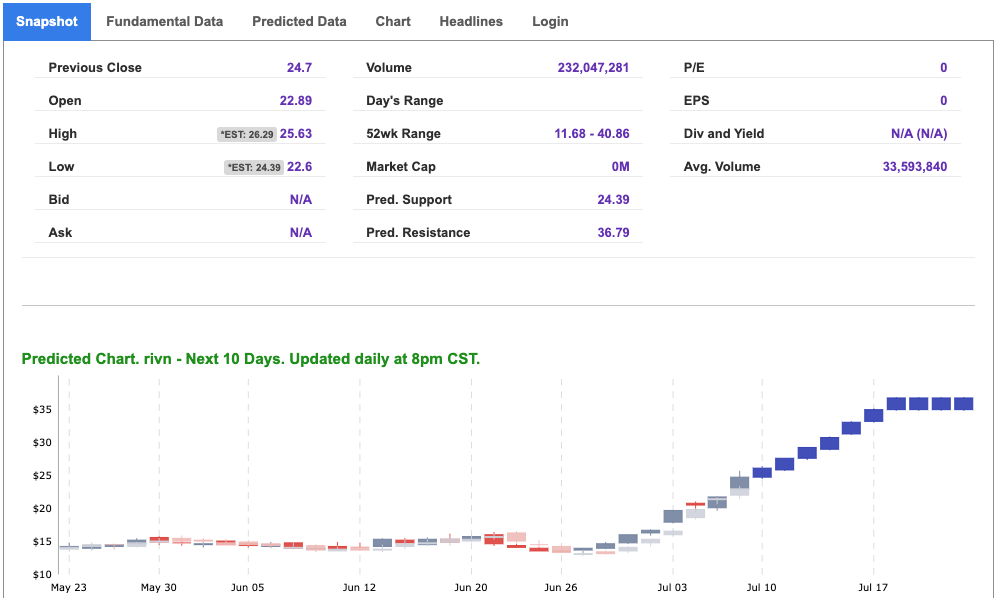
Using the “SPY” symbol to analyze the S&P 500 our 10-day prediction window shows a near-term mixed outlook. Prediction data is uploaded after the market closes at 6 p.m. CST. Today’s data is based on market signals from the previous trading session.
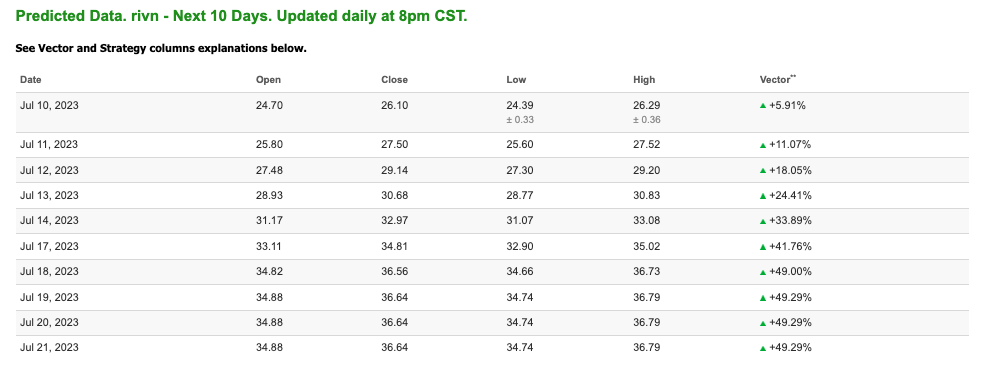
Note: The Vector column calculates the change of the Forecasted Average Price for the next trading session relative to the average of actual prices for the last trading session. The column shows the expected average price movement “Up or Down”, in percent. Trend traders should trade along the predicted direction of the Vector. The higher the value of the Vector the higher its momentum.
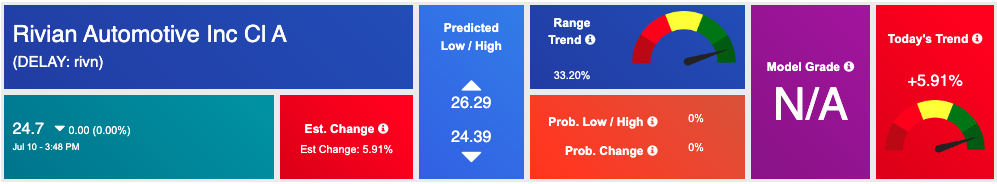
*Please note: At the time of publication Vlad Karpel does NOT have a position in the featured symbol, RIVN. Our featured symbol is part of your free subscription service. It is not included in any paid Tradespoon subscription service. Vlad Karpel only trades his money in paid subscription services. If you are a paid subscriber, please review your Premium Member Picks, ActiveTrader, or MonthlyTrader recommendations. If you are interested in receiving Vlad’s picks, please click here.
West Texas Intermediate for Crude Oil delivery (CL.1) is priced at $73.21 per barrel, down 0.88%, at the time of publication.
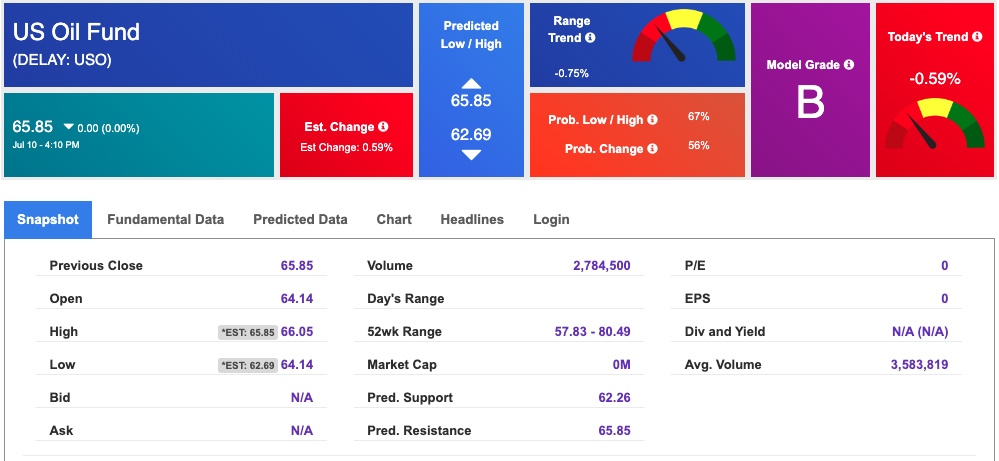
Looking at USO, a crude oil tracker, our 10-day prediction model shows mixed signals. The fund is trading at $65.85 at the time of publication. Prediction data is uploaded after the market close at 6 p.m., CST. Today’s data is based on market signals from the previous trading session.
The price for the Gold Continuous Contract (GC00) is down 0.09% at $1930.80 at the time of publication.
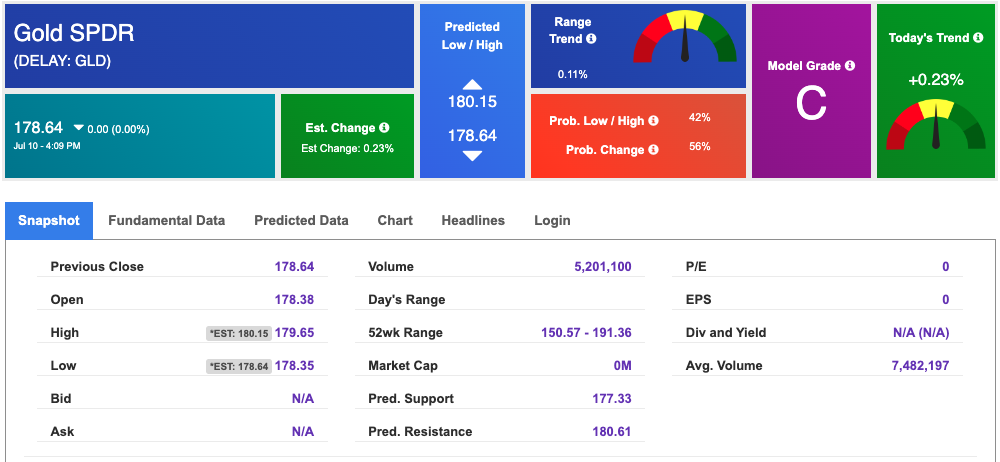
Using SPDR GOLD TRUST (GLD) as a tracker in our Stock Forecast Tool, the 10-day prediction window shows mixed signals. The gold proxy is trading at $178.64 at the time of publication. Vector signals show +0.23% for today. Prediction data is uploaded after the market close at 6 p.m., CST. Today’s data is based on market signals from the previous trading session.
The yield on the 10-year Treasury note is DOWN at 4.000% at the time of publication.
The yield on the 30-year Treasury note is DOWN at 4.032% at the time of publication.
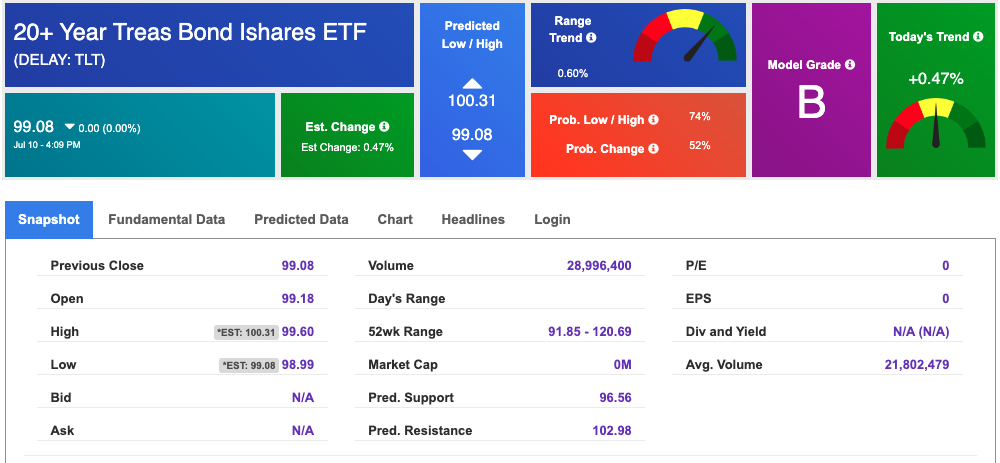
Using the iShares 20+ Year Treasury Bond ETF (TLT) as a proxy for bond prices in our Stock Forecast Tool, we see mixed signals in our 10-day prediction window. Prediction data is uploaded after the market close at 6 p.m., CST. Today’s data is based on market signals from the previous trading session.
The CBOE Volatility Index (^VIX) is priced at $15.07, UP 1.62% at the time of publication, and our 10-day prediction window shows mixed signals. Prediction data is uploaded after the market close at 6 p.m., CST. Today’s data is based on market signals from the previous trading session.
Please share this Tradespoon Market Commentary with your friends.
![]()

![]()
Comments Off on


Tradespoon Tools make finding winning trades in minute as easy as 1-2-3.
Our simple 3 step approach has resulted in an average return of almost 20% per trade!