 Save Big on Commissions ($0.65 per Contract)
CLICK HERE TO LEARN MORE
Save Big on Commissions ($0.65 per Contract)
CLICK HERE TO LEARN MORE
Looking at the current market conditions and how to prepare for the next market move, we are keeping an eye on the $VIX which is trading near the 24 level. Two factors that continue to inform market movement and potentially impact the next market move are the Geopolitical risks in Ukraine and CPI/PPI data. All three major U.S. indices closed in the red with pressure from the tech and energy sectors. Treasury yields continue to rise and intensify inflation concerns. This week, several key inflation reports will release including March Core CPI, both monthly and year-over-year, as well as March Federal Budget Deficit and Retail Sales. Headline news from last week of Musk buying a major stake in Twitter appeared to continue to impact shares today as the Tesla CEO denied his seat on the board, seeing Twitter shares rise over 1.6%. Gold and the dollar rose today while oil futures and bitcoin retreaded; the 10-year yield rose to a 3 year high at 2.77% while the Nasdaq saw the biggest drop of the major indices with 2.18% loss. The S&P finished 1.69% down and the Dow finished 1.19% down for the day.
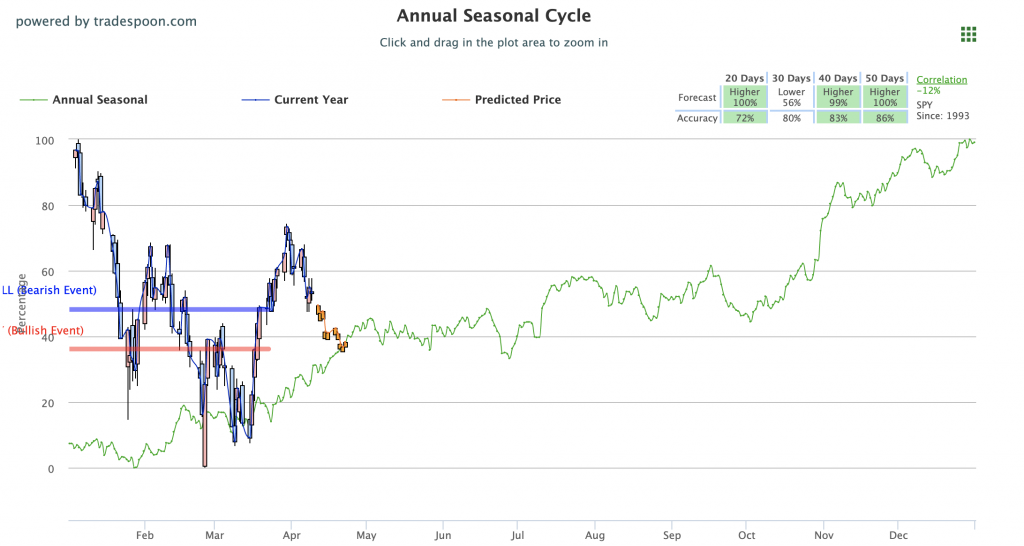
Based on our technical studies, we are keeping an eye on the SPY’s overhead resistance levels of $451 and then $465. The $SPY support is at $438 and then $420. We expect the market to continue to trade higher in the next two to six weeks. In the short term, the market is oversold and will start the bottoming process in the next few sessions. Globally, Asian markets traded lower while European markets were mixed. We encourage all market commentary readers to maintain clearly defined stop levels for all positions. For reference, the SPY Seasonal Chart is shown below:
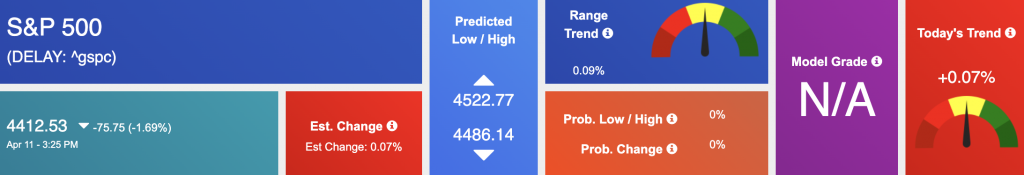
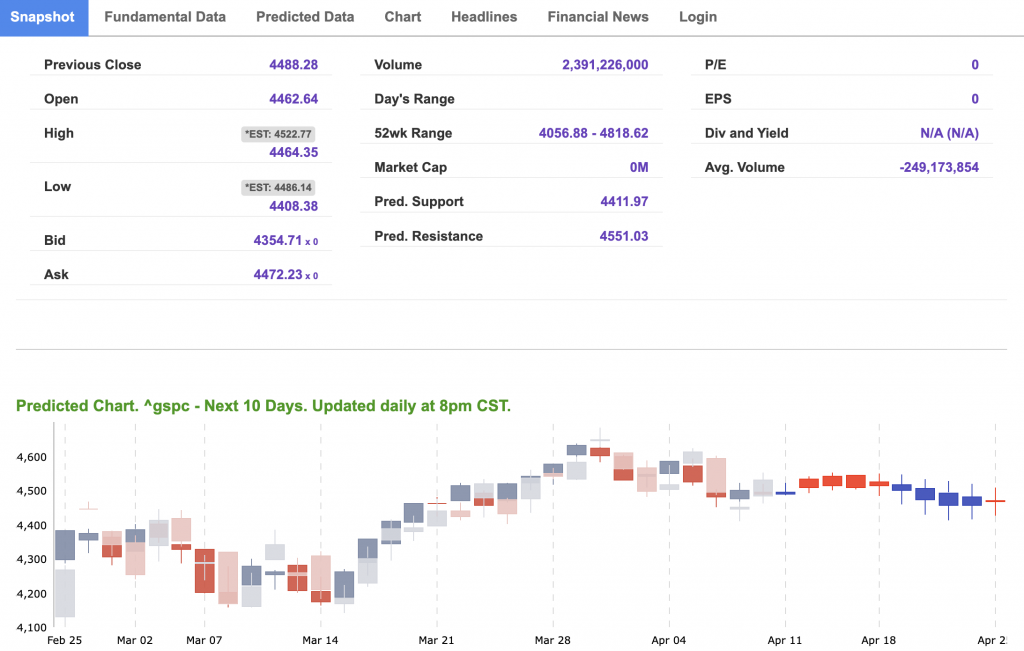
Using the “^GSPC” symbol to analyze the S&P 500 our 10-day prediction window shows a near-term mixed outlook. Prediction data is uploaded after the market closes at 6 p.m. CST. Today’s data is based on market signals from the previous trading session.
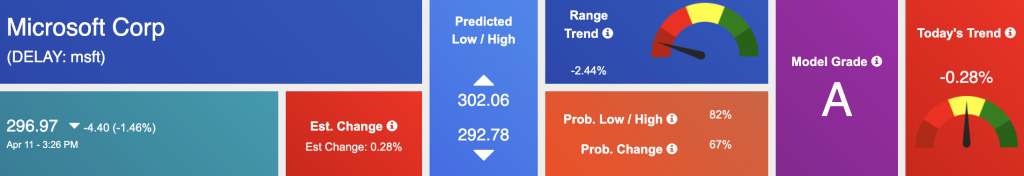
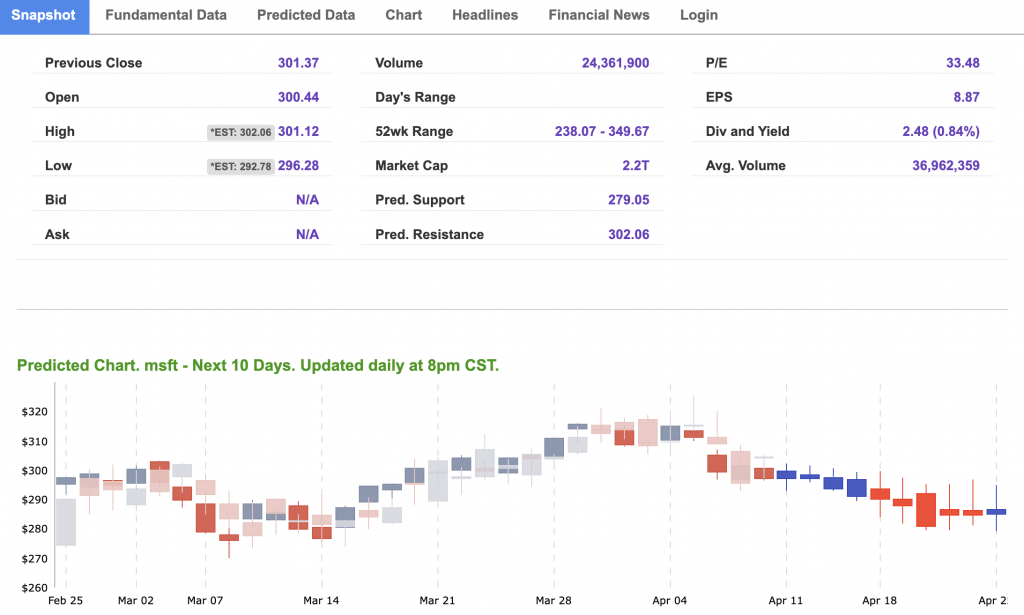
The symbol is trading at $296.97 with a vector of -1.46% at the time of publication.
10-Day Prediction data is uploaded after the market close at 6 p.m., CST. Today’s data is based on market signals from the previous trading session.
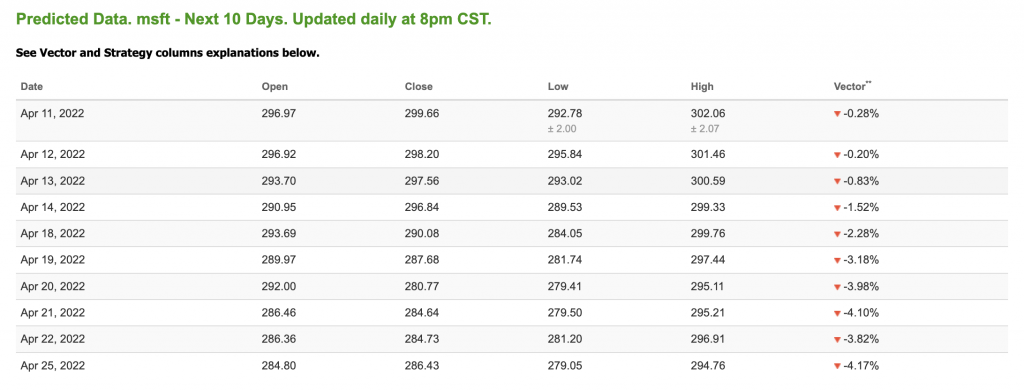
Note: The Vector column calculates the change of the Forecasted Average Price for the next trading session relative to the average of actual prices for the last trading session. The column shows the expected average price movement “Up or Down”, in percent. Trend traders should trade along the predicted direction of the Vector. The higher the value of the Vector the higher its momentum.
*Please note: At the time of publication Vlad Karpel does have a position in the featured symbol, msft. Our featured symbol is part of your free subscription service. It is not included in any paid Tradespoon subscription service. Vlad Karpel only trades his money in paid subscription services. If you are a paid subscriber, please review your Premium Member Picks, ActiveTrader, or MonthlyTrader recommendations. If you are interested in receiving Vlad’s picks, please click here.
West Texas Intermediate for Crude Oil delivery (CL.1) is priced at $94.91 per barrel, down 3.40% at the time of publication.
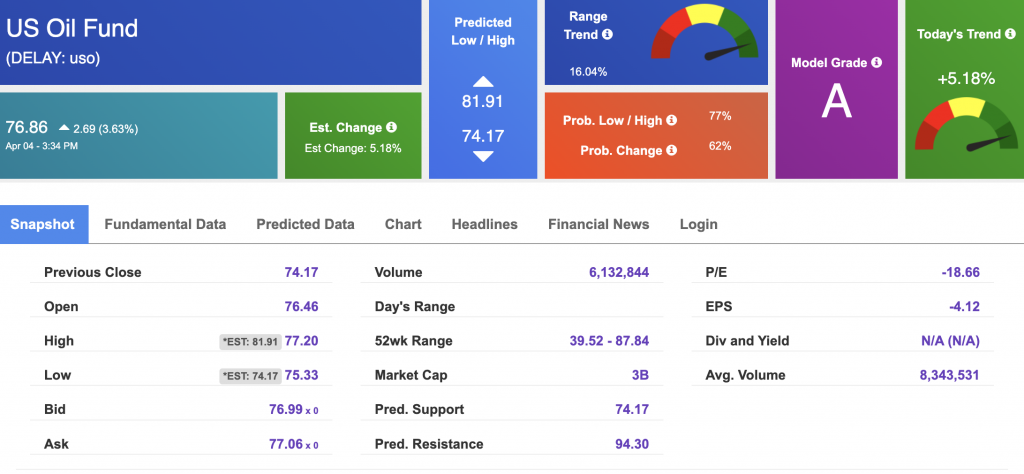
Looking at USO, a crude oil tracker, our 10-day prediction model shows mixed signals. The fund is trading at $76.86 at the time of publication. Prediction data is uploaded after the market close at 6 p.m., CST. Today’s data is based on market signals from the previous trading session.
The price for the Gold Continuous Contract (GC00) is up 0.63% at $1957.90 at the time of publication.
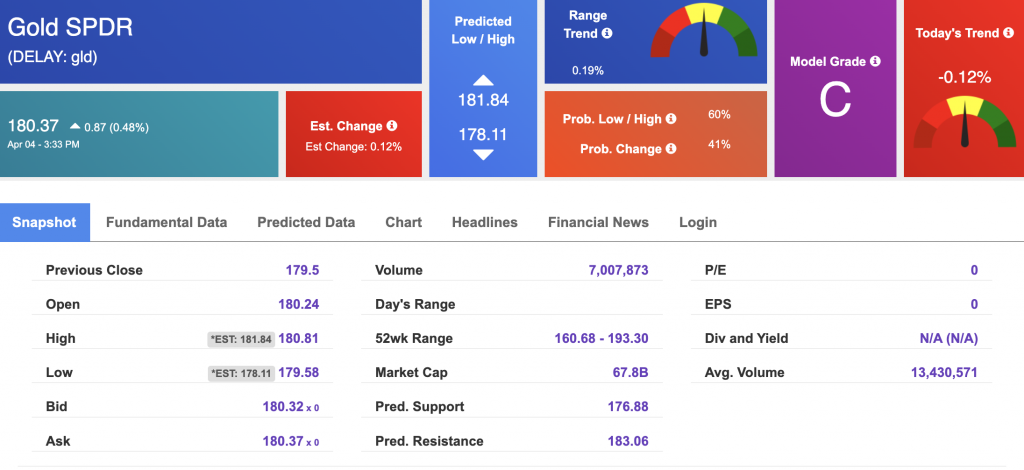
Using SPDR GOLD TRUST (GLD) as a tracker in our Stock Forecast Tool, the 10-day prediction window shows mixed signals. The gold proxy is trading at $180.37 at the time of publication. Vector signals show -0.12% for today. Prediction data is uploaded after the market close at 6 p.m., CST. Today’s data is based on market signals from the previous trading session.
The yield on the 10-year Treasury note is up, at 2.776% at the time of publication.
The yield on the 30-year Treasury note is up, at 2.813% at the time of publication.
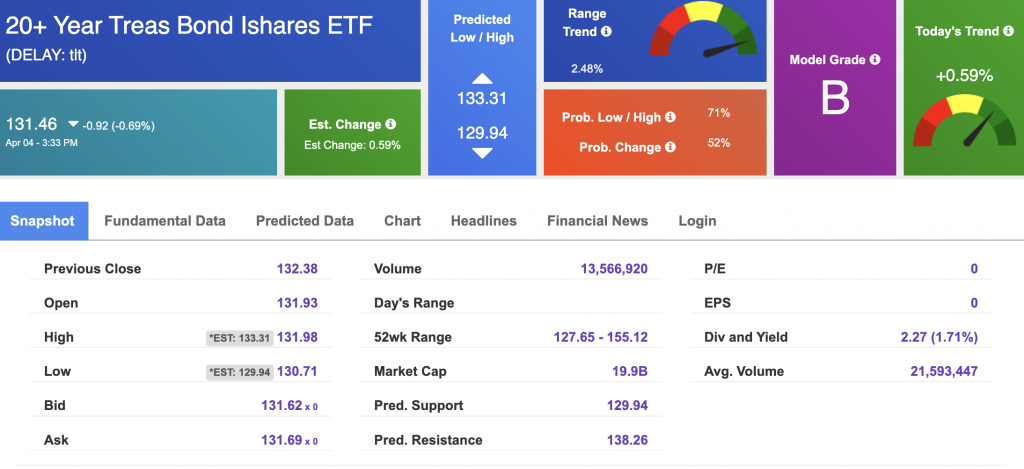
Using the iShares 20+ Year Treasury Bond ETF (TLT) as a proxy for bond prices in our Stock Forecast Tool, we see mixed signals in our 10-day prediction window. Prediction data is uploaded after the market close at 6 p.m., CST. Today’s data is based on market signals from the previous trading session.
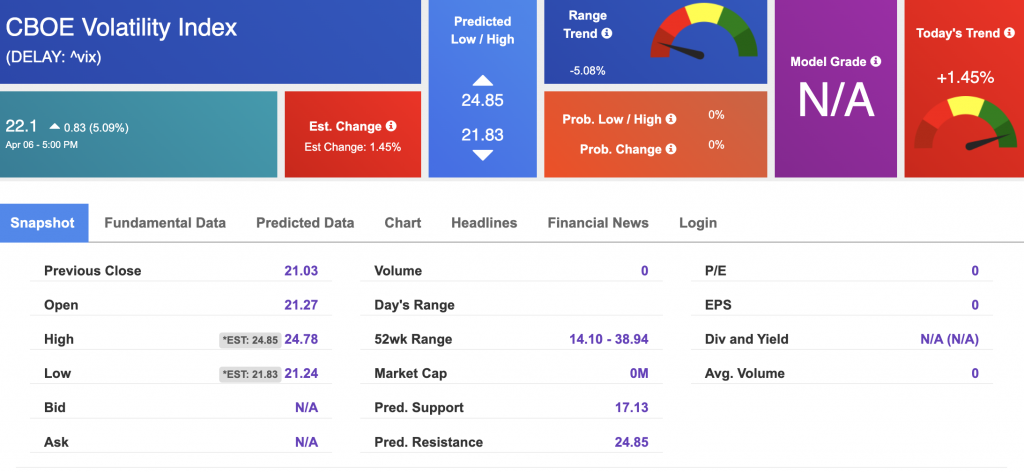
The CBOE Volatility Index (^VIX) is $22.1 at the time of publication, and our 10-day prediction window shows mixed signals. Prediction data is uploaded after the market close at 6 p.m., CST. Today’s data is based on market signals from the previous trading session.
Please share this Tradespoon Market Commentary with your friends.
![]()

![]()
Comments Off on


Tradespoon Tools make finding winning trades in minute as easy as 1-2-3.
Our simple 3 step approach has resulted in an average return of almost 20% per trade!

