 Sign Up for One-on-One Coaching and get our Premium Membership FREE for 1 Year!
CLICK HERE TO APPLY
Sign Up for One-on-One Coaching and get our Premium Membership FREE for 1 Year!
CLICK HERE TO APPLY
On Monday, the stock market witnessed a surge in tech stocks, marking a notable rebound for the Dow Jones Industrial Average after it was initially impacted by Boeing’s performance. The rally, led by the technology sector, propelled the Nasdaq Composite and the S&P 500 saw a significant increase. However, the Dow Jones Industrial Average remained relatively flat to slightly negative in the early afternoon.
Investor attention is now directed toward the upcoming release of the December Consumer Price Index (CPI) report on Thursday, as they anticipate the annualized change in the CPI to be near its lowest level since March 2021. This has sparked speculation that the Federal Reserve might initiate interest rate cuts as early as March. In the bond markets, the yield on the benchmark 10-year Treasury note stands at 3.98%, showing a slight decrease from the previous week.
Boeing faced a setback, experiencing a 6.3% decline after they were ordered to temporarily ground 171 Boeing 737 MAX 9 planes. This decision followed an incident involving a MAX 9 operated by Alaska Air, which lost a section of its fuselage in midair. Alaska and United Airlines promptly announced the grounding of their MAX 9 jets.
Nvidia, on the other hand, observed an impressive rise, nearing its all-time closing high. The chip maker announced expanded artificial intelligence partnerships with Amgen and Recursion Pharmaceuticals. Apple’s stock rose after the company revealed that its Apple Vision Pro mixed-reality headset would be available at all U.S. stores and online starting Feb. 2, with pre-orders beginning on Jan. 19. Despite this positive development, concerns lingered as reports suggested the Justice Department was investigating Apple for potential antitrust violations related to its iPhone business.
Last week, investors closely monitored Friday’s labor report and key insights from the latest Federal Open Market Committee (FOMC) meeting minutes. Major U.S. indices experienced a decline throughout the week, but the December jobs report surpassed expectations, recording a significant addition of 216,000 jobs. This positive momentum showcased the resilience of the employment landscape, surpassing November’s job growth.
The unexpected surge in December payrolls was driven by heightened hiring in government, health care, social assistance, and construction sectors. However, the transportation and warehousing sectors witnessed a dip in job numbers. Initial market concerns about the Federal Reserve potentially postponing interest rate cuts led to a downturn, but as the day progressed, shares rebounded, highlighting the dynamic nature of market sentiment.
The impressive job figure not only exceeded forecasts but also underscored the U.S. labor market’s resilience, surpassing November’s growth. Notably, there was an unexpected surge in hiring within government, health care, social assistance, and construction.
Despite the positive report, the Bureau of Labor Statistics made downward revisions to the October and November payroll gains, revealing that employment gains in those months were 71,000 lower than initially reported.
Following the jobs report, the 10-year Treasury yield dipped below 4%, reaching 3.976% on Friday morning. Lower yields were viewed favorably by new home buyers, contributing to a dip in mortgage rates. Investors reevaluated their expectations for the Federal Reserve’s next move in light of the robust December jobs report. Confidence in a first-quarter rate cut dwindled, and the market is now grappling with the delicate balance the Fed seeks – a healthy job market without excessive inflation.
Contrary to expectations, the U.S. services sector experienced a slower pace of growth in December, indicating a cooling demand and declining employment conditions. Despite the decline, the Institute for Supply Management’s services-activity index remained above the expansion threshold, reflecting a 12-month growth trend.
The December Federal Open Market Committee (FOMC) meeting minutes revealed a consensus that the rate-increase cycle initiated in 2022 was likely concluded. Factors such as easing inflation, normalized supply chains, and a more flexible labor market influenced this decision. While discussions about rate cuts were not detailed, projections hinted at three rate cuts for 2024, raising anticipation for future deliberations on the central bank’s bond holdings.
As SMH, XLI, and QQQ face challenges and approach medium-term support levels, investors grapple with the uncertainty brought about by the unexpected strength in the job market, contrasting signals from the Federal Reserve, and disappointing earnings from prominent companies like Walgreens. The intricacies of these developments underscore the need for a cautious and strategic approach in navigating the evolving market landscape.
Current market sentiment suggests that the Federal Reserve may have completed its rate hikes for the current and next year, with a likelihood of interest rate cuts in the first half of 2024. Despite some challenges to this narrative, a bullish outlook prevails, although uncertainties around key stocks may impact market dynamics. Downgrades on AAPL and patterns approaching the 200 DMA raise concerns, suggesting potential caps on the SPY rally and short-term support levels in the range of 400-430. For reference, the SPY Seasonal Chart is shown below:
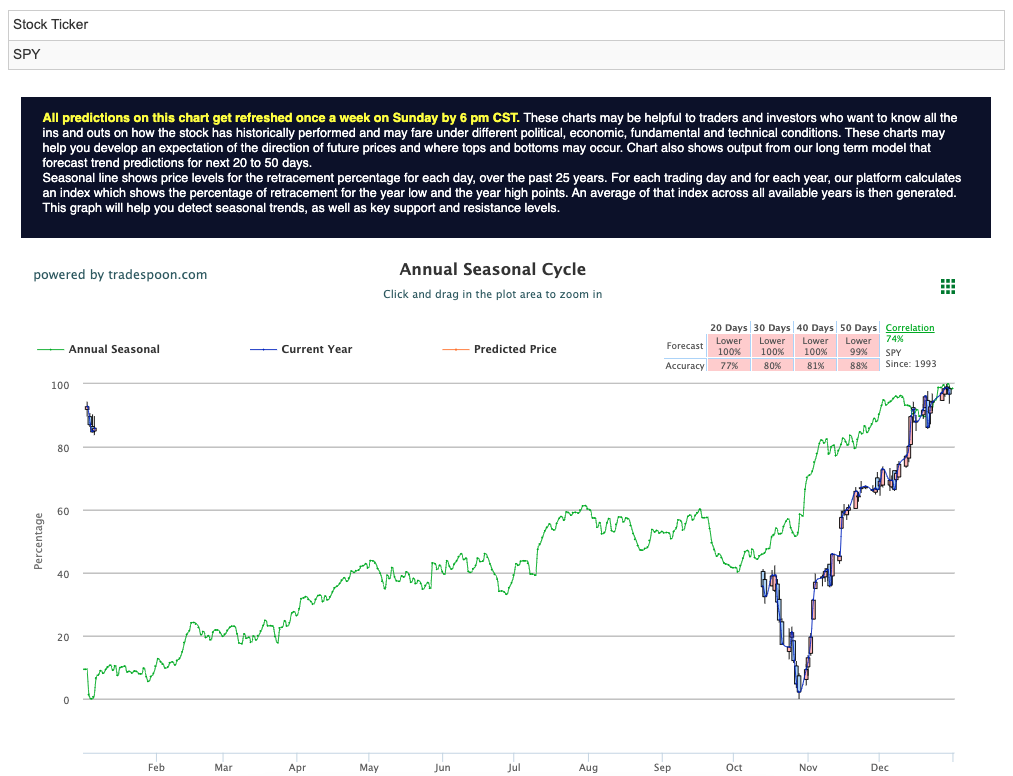
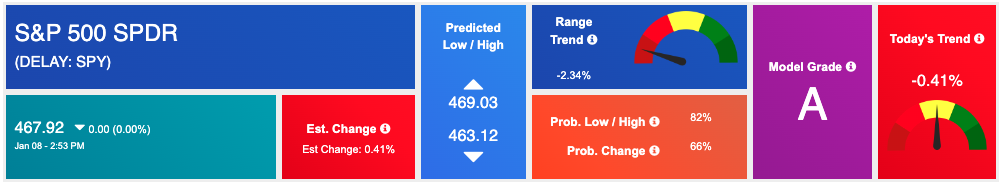
Using the “SPY” symbol to analyze the S&P 500 our 10-day prediction window shows a near-term positive outlook. Prediction data is uploaded after the market closes at 6 p.m. CST. Today’s data is based on market signals from the previous trading session.
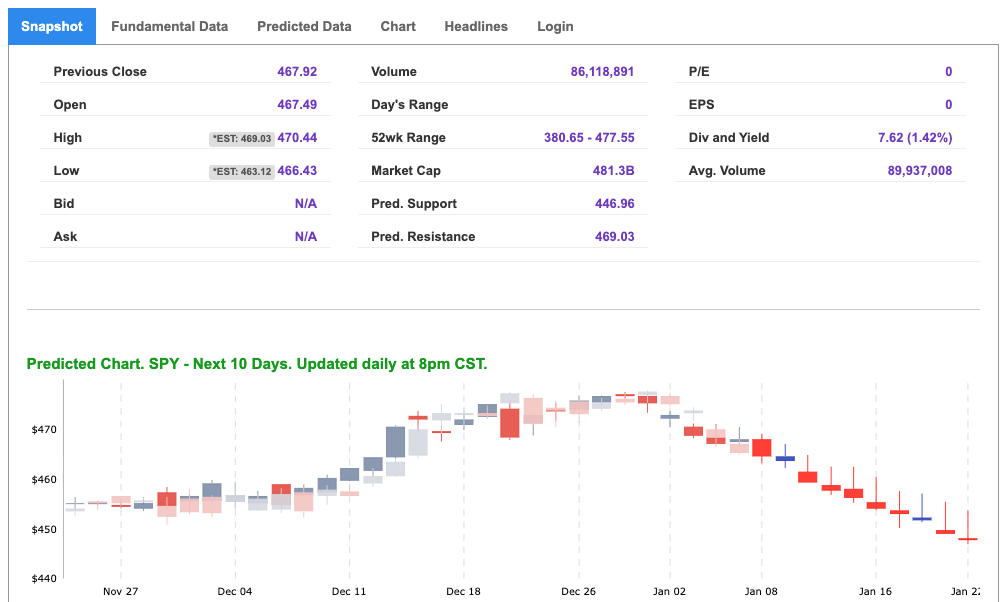
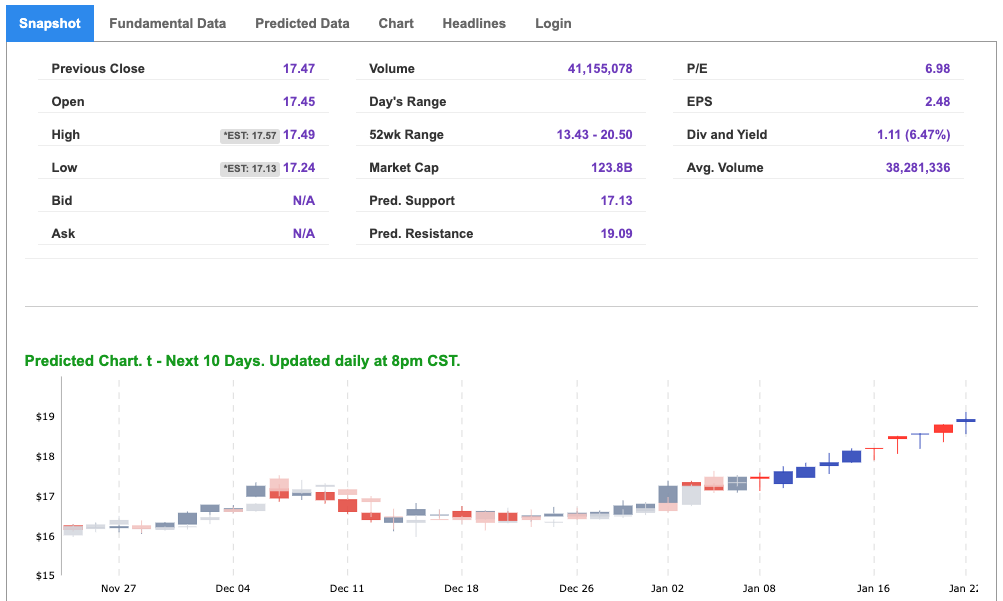
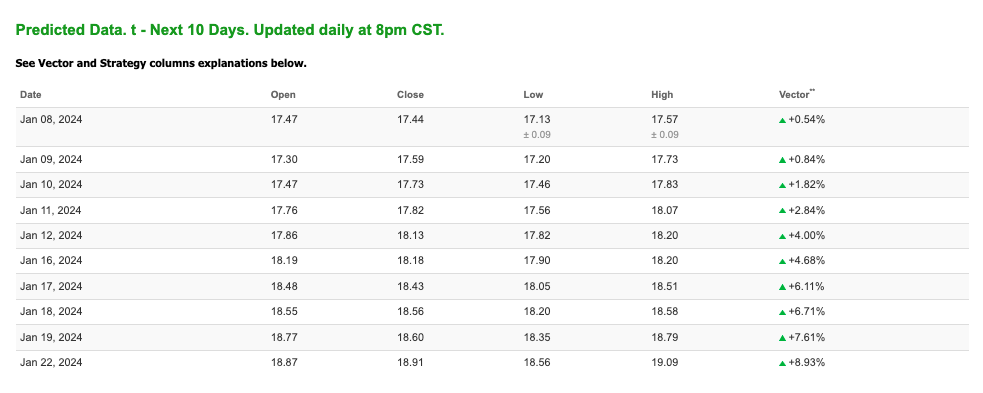
Note: The Vector column calculates the change of the Forecasted Average Price for the next trading session relative to the average of actual prices for the last trading session. The column shows the expected average price movement “Up or Down”, in percent. Trend traders should trade along the predicted direction of the Vector. The higher the value of the Vector the higher its momentum.
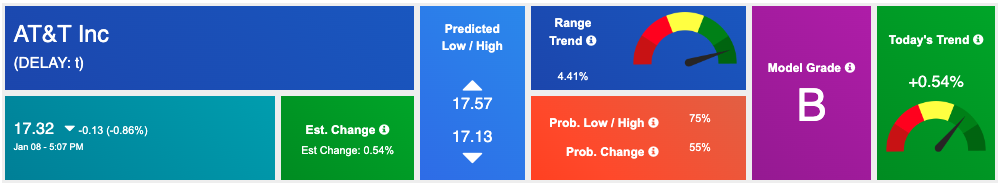
*Please note: At the time of publication Vlad Karpel does NOT have a position in the featured symbol, t. Our featured symbol is part of your free subscription service. It is not included in any paid Tradespoon subscription service. Vlad Karpel only trades his money in paid subscription services. If you are a paid subscriber, please review your Premium Member Picks, ActiveTrader, or MonthlyTrader recommendations. If you are interested in receiving Vlad’s picks, please click here.
West Texas Intermediate for Crude Oil delivery (CL.1) is priced at $70.86 per barrel, up 0.13%, at the time of publication.
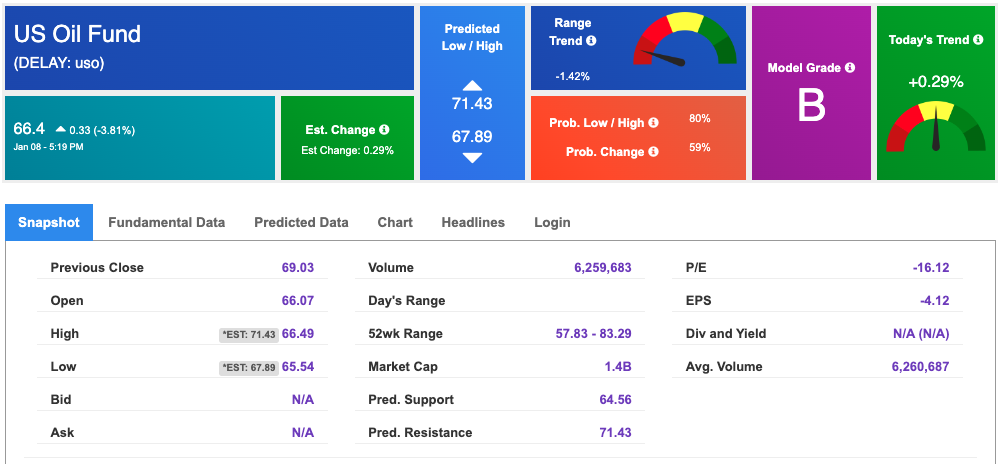
Looking at USO, a crude oil tracker, our 10-day prediction model shows mixed signals. The fund is trading at $66.4 at the time of publication. Prediction data is uploaded after the market close at 6 p.m., CST. Today’s data is based on market signals from the previous trading session.
The price for the Gold Continuous Contract (GC00) is up 0.05% at $2034.50 at the time of publication.
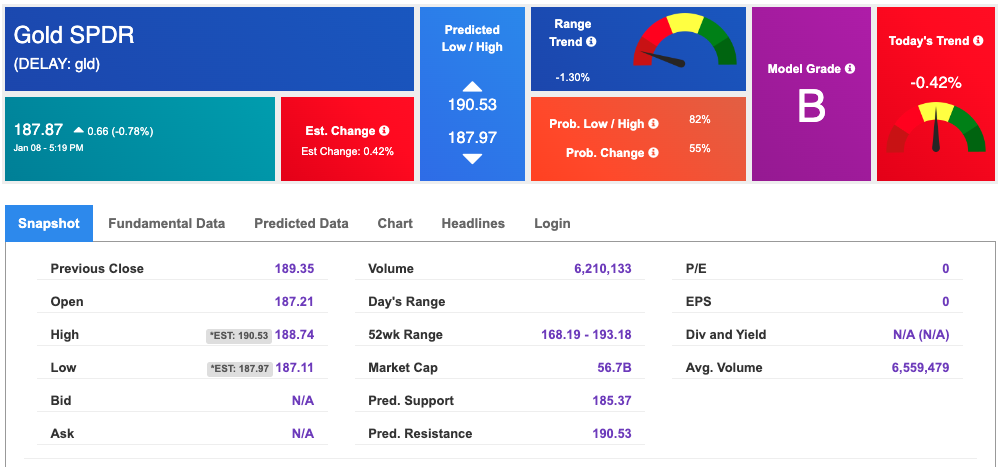
Using SPDR GOLD TRUST (GLD) as a tracker in our Stock Forecast Tool, the 10-day prediction window shows mixed signals. The gold proxy is trading at $187.87 at the time of publication. Vector signals show -0.42% for today. Prediction data is uploaded after the market close at 6 p.m., CST. Today’s data is based on market signals from the previous trading session.
The yield on the 10-year Treasury note is down at 4.031% at the time of publication.
The yield on the 30-year Treasury note is down at 4.194% at the time of publication.
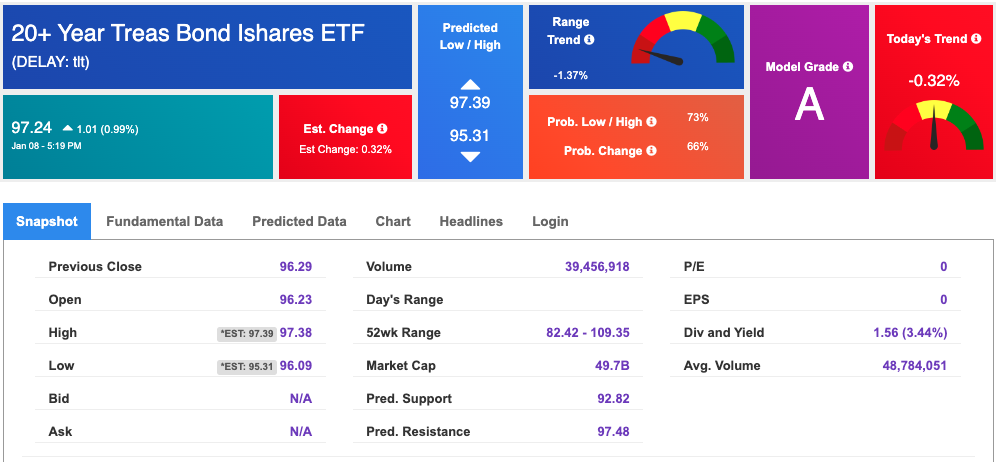
Using the iShares 20+ Year Treasury Bond ETF (TLT) as a proxy for bond prices in our Stock Forecast Tool, we see mixed signals in our 10-day prediction window. Prediction data is uploaded after the market close at 6 p.m., CST. Today’s data is based on market signals from the previous trading session.
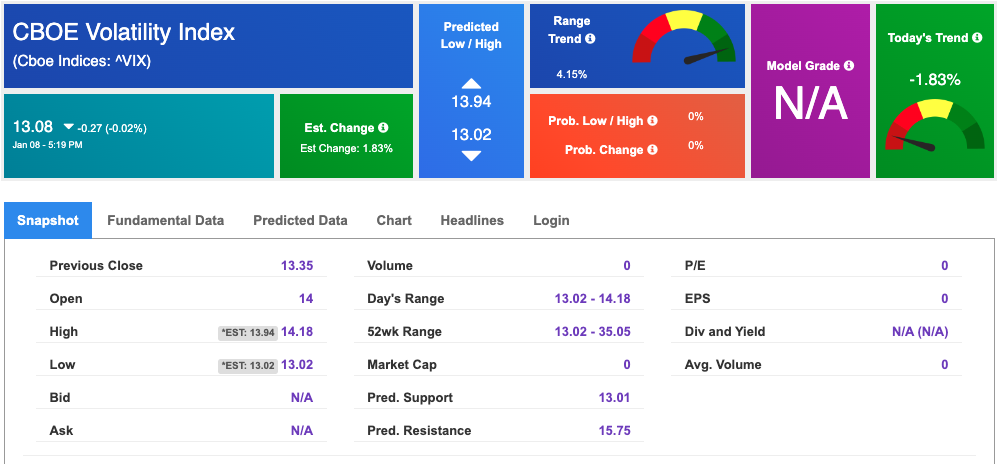
The CBOE Volatility Index (^VIX) is priced at $13.08 down 0.02% at the time of publication, and our 10-day prediction window shows mixed signals. Prediction data is uploaded after the market close at 6 p.m., CST. Today’s data is based on market signals from the previous trading session.
Please share this Tradespoon Market Commentary with your friends.
![]()

![]()
Comments Off on


Tradespoon Tools make finding winning trades in minute as easy as 1-2-3.
Our simple 3 step approach has resulted in an average return of almost 20% per trade!