 Special Offer: Try the 'Elite Trading Circle Membership' for ONLY $37!
CLICK HERE TO LEARN MORE
Special Offer: Try the 'Elite Trading Circle Membership' for ONLY $37!
CLICK HERE TO LEARN MORE
Markets impressively bounced back on Tuesday with all three major U.S indices closing in the green. April retail sales data provided support as the report showed a healthy economic standing, as the report produced a 0.9% increase in April and a 1.4% increase in the March revision. Inflation remains prominent in investor and economic sentiment, however, the latest retail report shows an economy that remained active through the headwinds. Another economic report released today was the April industrial production report, which showed a rise of 1.1%. Retail earnings take prominence this week with Walmart, Home Depot, Lowe’s, and Target quarterly reports. Walmart, reported before the market open today, saw shares slide over 11% throughout the day following weak earnings after estimates missed expectations. Focus remains on key inflation economic reports and Fed action, with Fed Chair Jerome Powell speaking today.
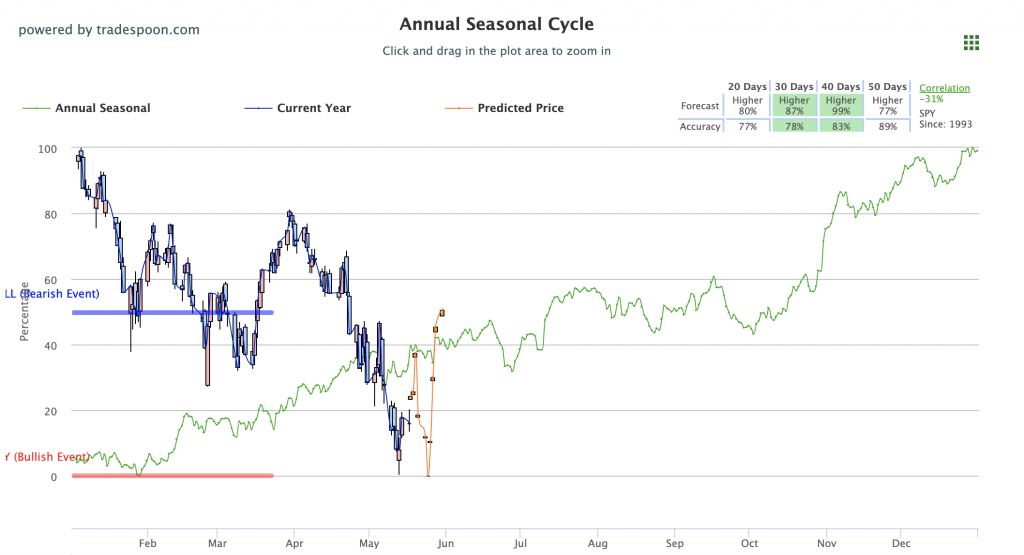
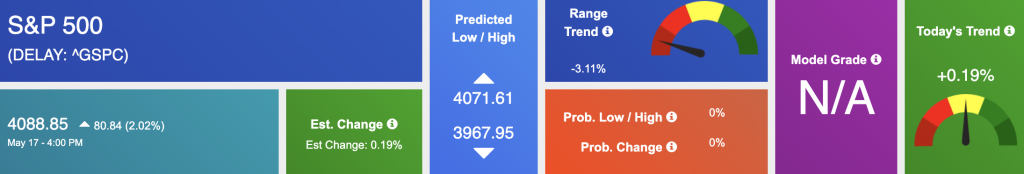
Looking at the current market conditions, the $VIX is trading near the 30 level. Geopolitical risks in Ukraine and Powel’s speech on Tuesday can impact the next move in the market. We are watching the overhead resistance levels in the SPY, which are presently at $410 and then $430. The $SPY support is at $395 and then $385. We expect the market to continue the pattern of lower highs and lower lows for the next 2-6 weeks. In the short term, the market is oversold. Long-term U.S. Treasury yields rose while the dollar pulled back today; oil futures continued to rise. Globally, both Asian and European markets closed in the green. We encourage all market commentary readers to maintain clearly defined stop levels for all positions. For reference, the SPY Seasonal Chart is shown below:
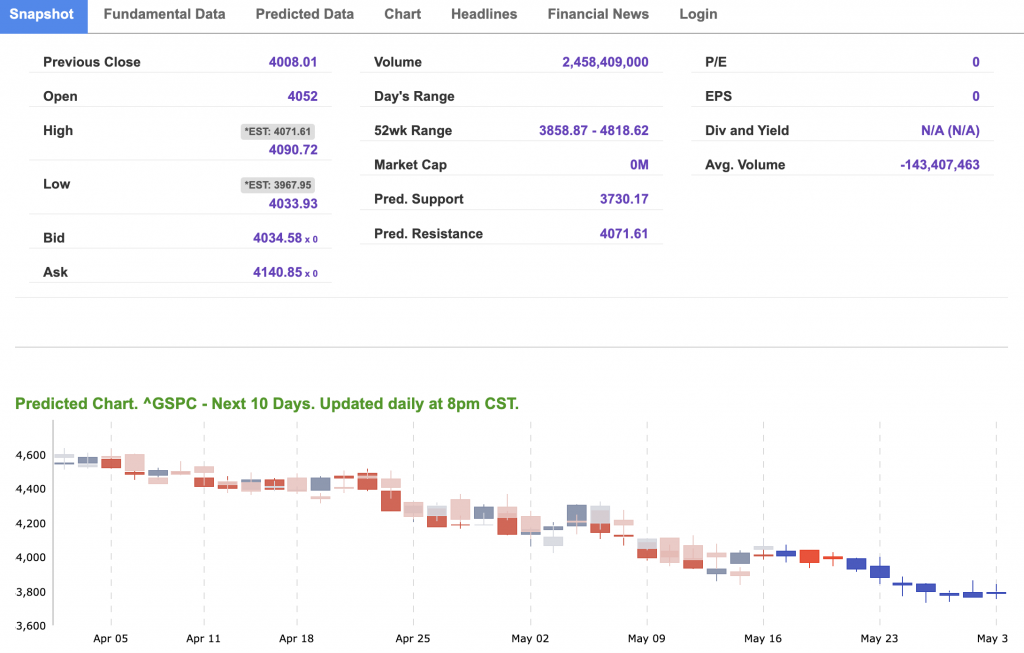
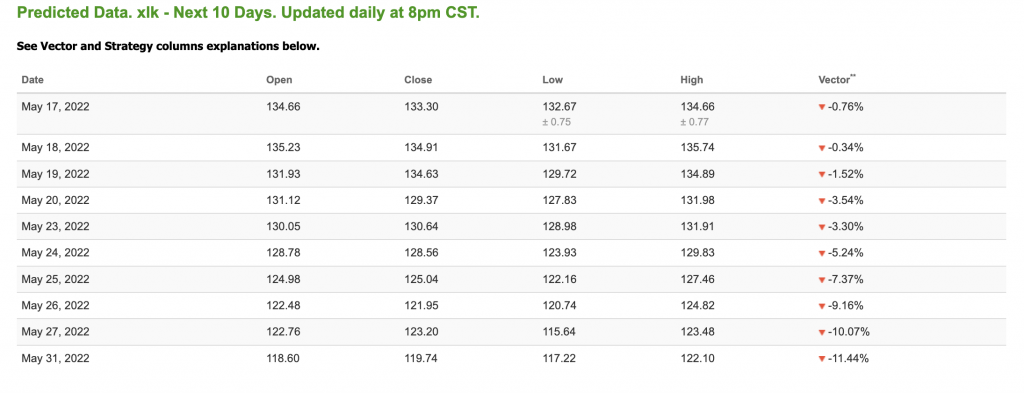
Note: The Vector column calculates the change of the Forecasted Average Price for the next trading session relative to the average of actual prices for the last trading session. The column shows the expected average price movement “Up or Down”, in percent. Trend traders should trade along the predicted direction of the Vector. The higher the value of the Vector the higher its momentum.
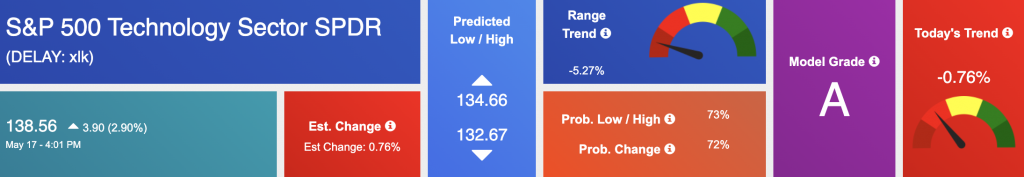
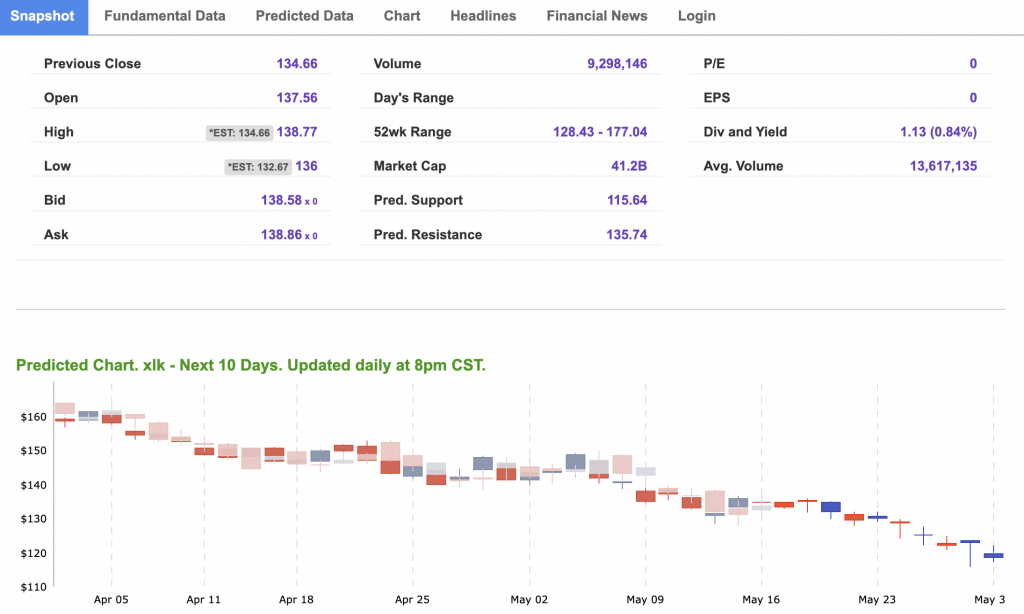
*Please note: At the time of publication Vlad Karpel does have a position in the featured symbol, XLK. Our featured symbol is part of your free subscription service. It is not included in any paid Tradespoon subscription service. Vlad Karpel only trades his money in paid subscription services. If you are a paid subscriber, please review your Premium Member Picks, ActiveTrader, or MonthlyTrader recommendations. If you are interested in receiving Vlad’s picks, please click here.
West Texas Intermediate for Crude Oil delivery (CL.1) is priced at $105.59 per barrel, up 5.84%, at the time of publication.
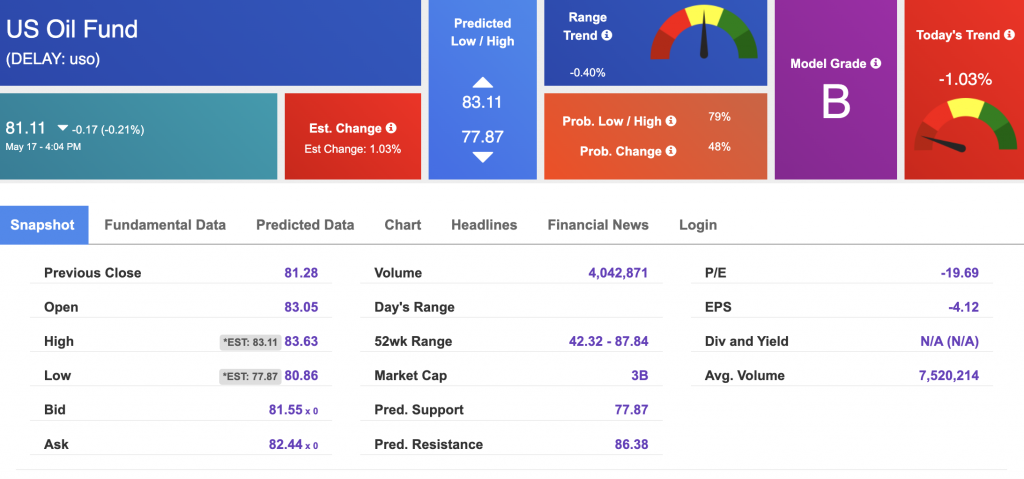
Looking at USO, a crude oil tracker, our 10-day prediction model shows mixed signals. The fund is trading at $81.11 at the time of publication. Prediction data is uploaded after the market close at 6 p.m., CST. Today’s data is based on market signals from the previous trading session.
The price for the Gold Continuous Contract (GC00) is up 0.61% at $1852.20 at the time of publication.
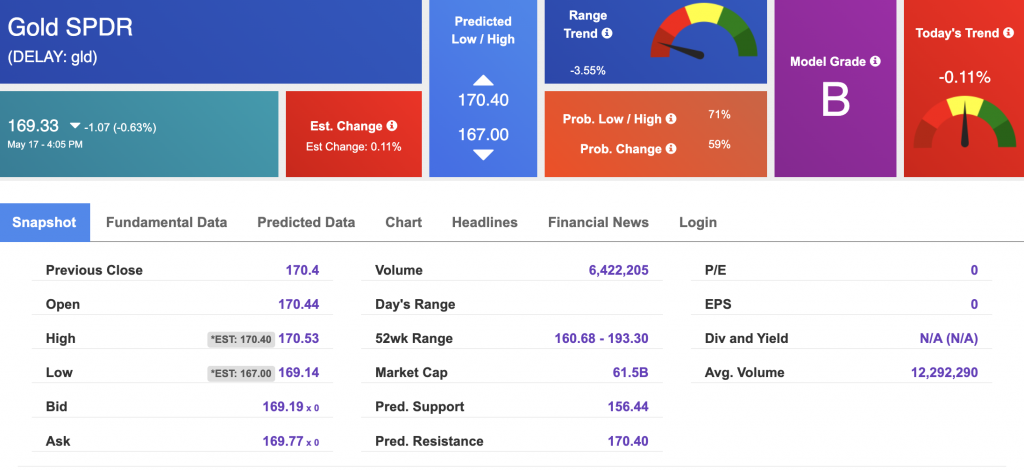
Using SPDR GOLD TRUST (GLD) as a tracker in our Stock Forecast Tool, the 10-day prediction window shows mixed signals. The gold proxy is trading at $169.33 at the time of publication. Vector signals show -0.11% for today. Prediction data is uploaded after the market close at 6 p.m., CST. Today’s data is based on market signals from the previous trading session.
The yield on the 10-year Treasury note is down, at 2.879% at the time of publication.
The yield on the 30-year Treasury note is up, at 3.181% at the time of publication.
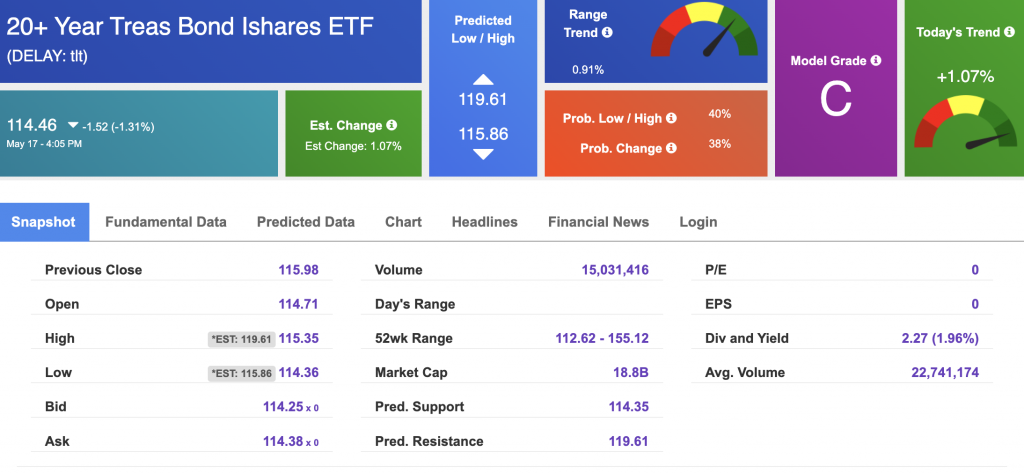
Using the iShares 20+ Year Treasury Bond ETF (TLT) as a proxy for bond prices in our Stock Forecast Tool, we see mixed signals in our 10-day prediction window. Prediction data is uploaded after the market close at 6 p.m., CST. Today’s data is based on market signals from the previous trading session.
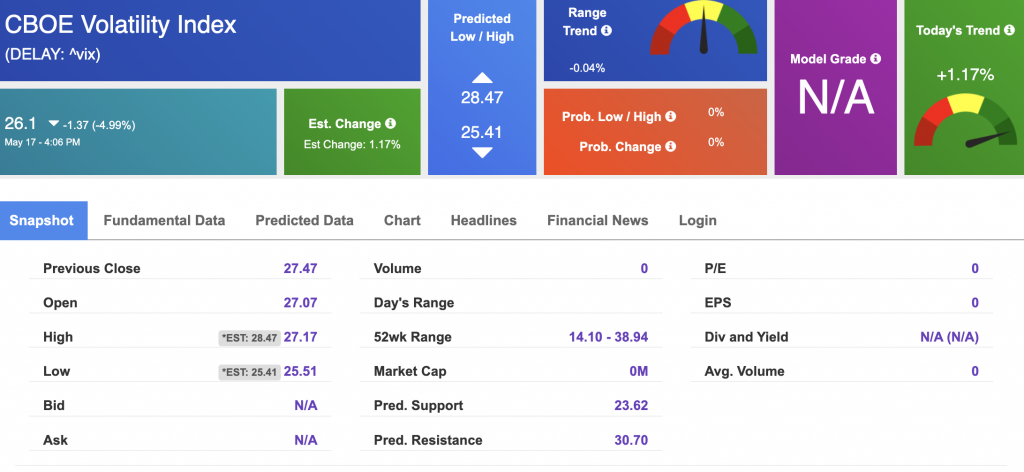
The CBOE Volatility Index (^VIX) is $26.1 at the time of publication, and our 10-day prediction window shows mixed signals. Prediction data is uploaded after the market close at 6 p.m., CST. Today’s data is based on market signals from the previous trading session.
Please share this Tradespoon Market Commentary with your friends.
![]()

![]()
Comments Off on


Tradespoon Tools make finding winning trades in minute as easy as 1-2-3.
Our simple 3 step approach has resulted in an average return of almost 20% per trade!

