 Save Big on Commissions ($0.65 per Contract)
CLICK HERE TO LEARN MORE
Save Big on Commissions ($0.65 per Contract)
CLICK HERE TO LEARN MORE
In a strong rebound from previous losses, the stock market closed higher on Monday, propelled by technology stocks. Investor focus now shifts to the second round of high-level debt-ceiling negotiations, set to take place at the White House on Tuesday. Simultaneously, the final round of key earnings releases is underway, offering valuable insights into the market’s trajectory.
Debt-Ceiling Talks and Market Optimism: As lawmakers strive to increase the nation’s borrowing limit, currently set at a staggering $31.4 trillion, investors eagerly await the outcome of the debt-ceiling talks. President Joe Biden voiced his optimism on Sunday, indicating his belief in reaching a consensus with Republicans. The progress of these negotiations holds significant importance for investors, who carefully monitor any developments that could influence market sentiment and overall stability.
Concerns Mount Over U.S. Banks and a Potential Credit Crunch: Amidst the positive market sentiment, a recently released Federal Reserve survey reveals alarming trends in the U.S. banking sector. The survey warns that banks continue to experience a decline in loan demand, coupled with a notable tightening of loan terms. In fact, these loan conditions have witnessed the most substantial tightening in six years, raising concerns of a potential credit crunch and the subsequent risk of a recession.
The findings of the Dallas Federal Reserve Banking Conditions Survey were unveiled. This survey, conducted twice each quarter, provided insights into the state of the banking industry. In May, the loan demand index registered at –31.8, indicating a decline from the previous reading of -45.6 in April. This marked the continuation of a negative trend in loan demand. Notably, almost 48% of CEOs and senior loan officers surveyed from various financial institutions revealed that they had recently tightened credit standards and terms. This figure represents the highest percentage observed since the survey’s inception in 2017. Looking ahead, respondents expressed concerns about further contractions in loan demand and anticipated a rise in nonperforming loans within the next six months.
Oil Market Stability and Global Economic Growth Concerns: After experiencing four consecutive weeks of losses, the oil market showed signs of steadying on Monday. Lingering worries surrounding global economic growth, particularly in China, have been instrumental in recent declines. Investors closely monitor these concerns as they have a significant impact on oil prices. Globally, both Asian and European markets finished in the green.
Key Earnings Releases and Economic Data: This week, investors will be paying close attention to the retail sales report and retail earnings. Among the notable companies releasing their earnings are Home Depot, Cisco Systems, Target, Walmart, Alibaba, Applied Materials, and Deere. These reports will provide crucial information to help gauge the overall market performance and consumer sentiment.
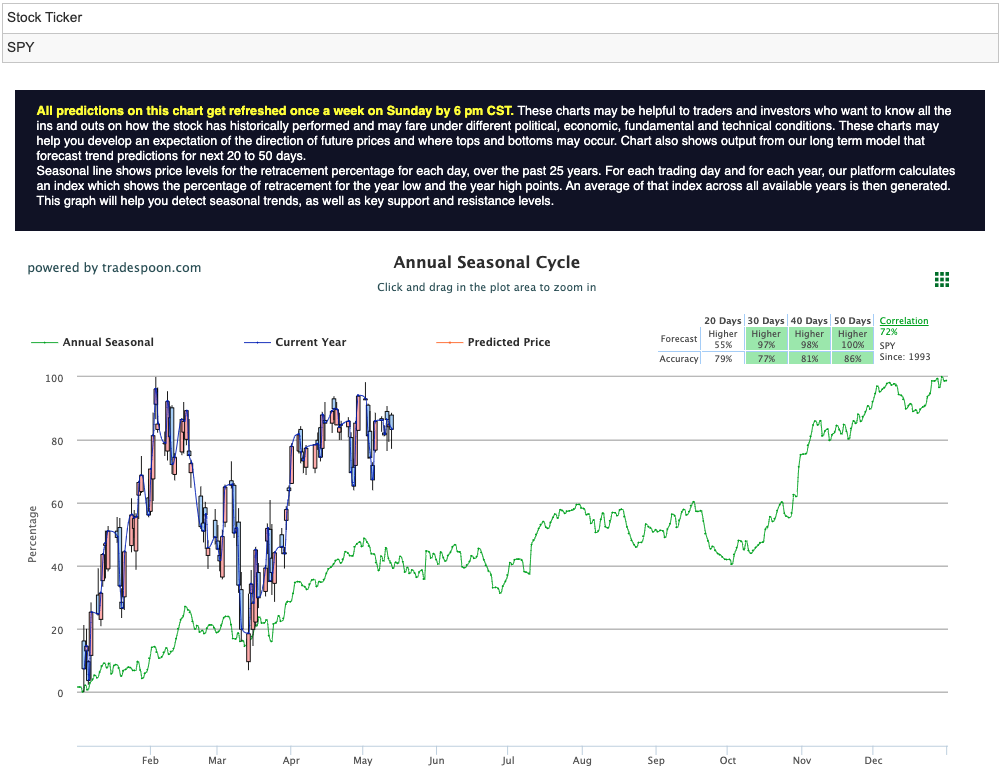
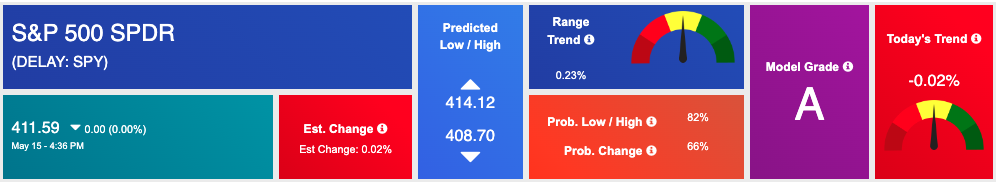
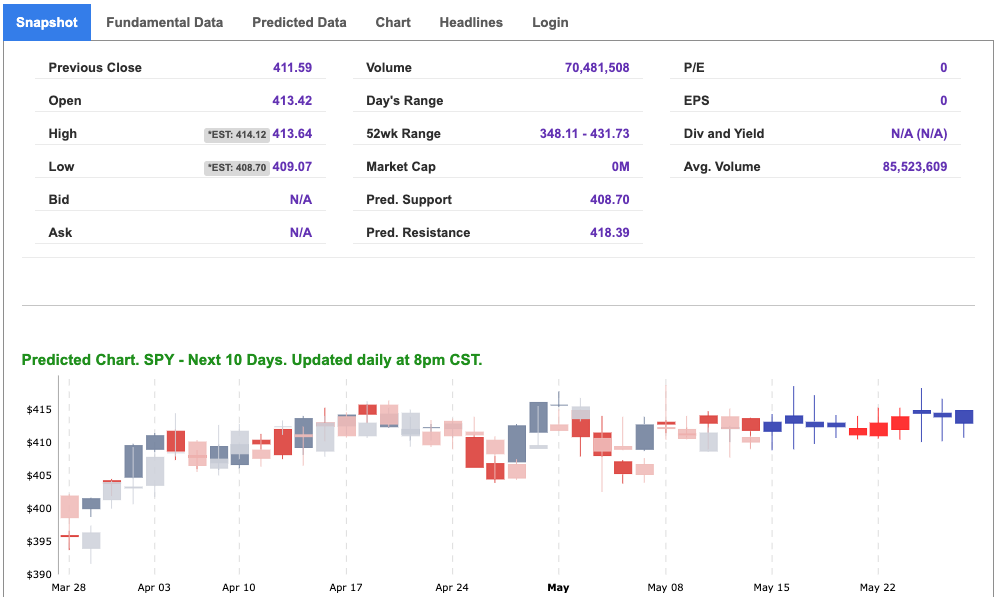
Market Outlook and Analysis: As the market continues to navigate various economic indicators and corporate earnings, several factors come into play. The VIX, currently trading near the $18 level, serves as a gauge of market volatility and can be influenced by earnings announcements from BIDU, HD, and WMT, as well as the retail data. Additionally, technical analysis suggests that the SPY faces resistance levels at $414 and $418, while support levels rest at $408 and $404. Based on the current market conditions, a sideways trading pattern is expected for the next 2-8 weeks. Consequently, a cautious stance is recommended, with a bearish outlook and encouragement for subscribers to hedge their positions. For reference, the SPY Seasonal Chart is shown below:
With the stock market rallying on Monday, fueled by technology stocks, investors eagerly await the outcomes of debt-ceiling negotiations and the final round of key earnings releases. Meanwhile, concerns loom over the tightening loan conditions in U.S. banks and the potential credit crunch they may trigger. Market commentary readers should maintain clearly defined stop levels for all positions.
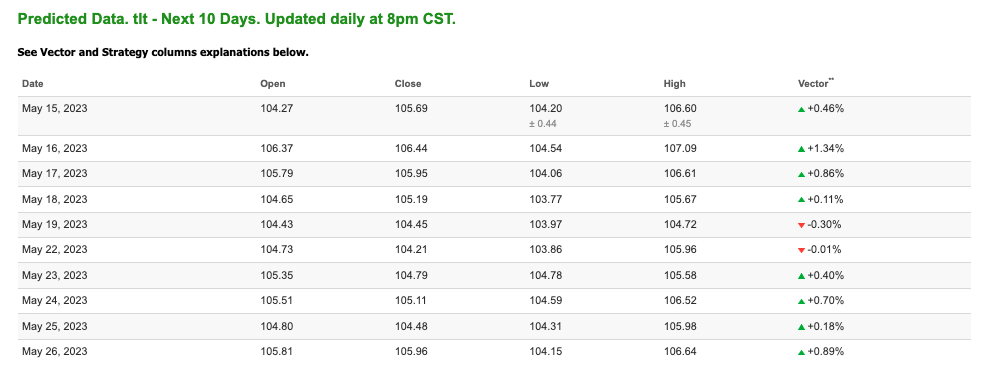
Note: The Vector column calculates the change of the Forecasted Average Price for the next trading session relative to the average of actual prices for the last trading session. The column shows the expected average price movement “Up or Down”, in percent. Trend traders should trade along the predicted direction of the Vector. The higher the value of the Vector the higher its momentum.
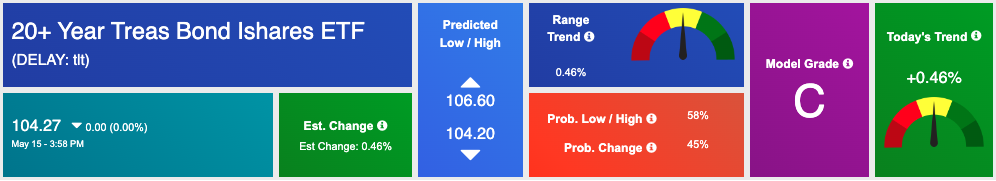
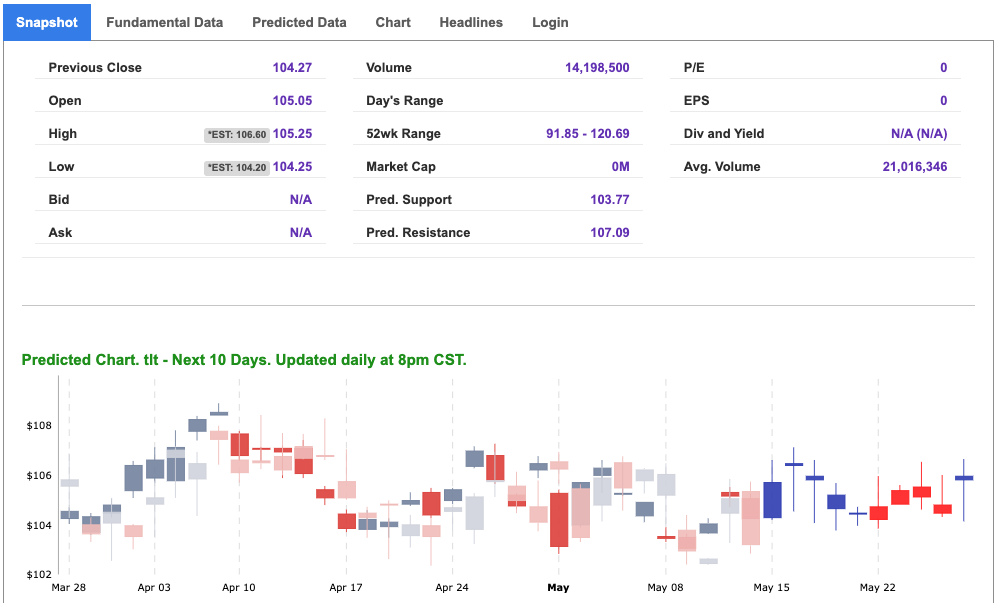
*Please note: At the time of publication Vlad Karpel does have a position in the featured symbol, tlt. Our featured symbol is part of your free subscription service. It is not included in any paid Tradespoon subscription service. Vlad Karpel only trades his money in paid subscription services. If you are a paid subscriber, please review your Premium Member Picks, ActiveTrader, or MonthlyTrader recommendations. If you are interested in receiving Vlad’s picks, please click here.
West Texas Intermediate for Crude Oil delivery (CL.1) is priced at $71.31 per barrel, up 1.81%, at the time of publication.
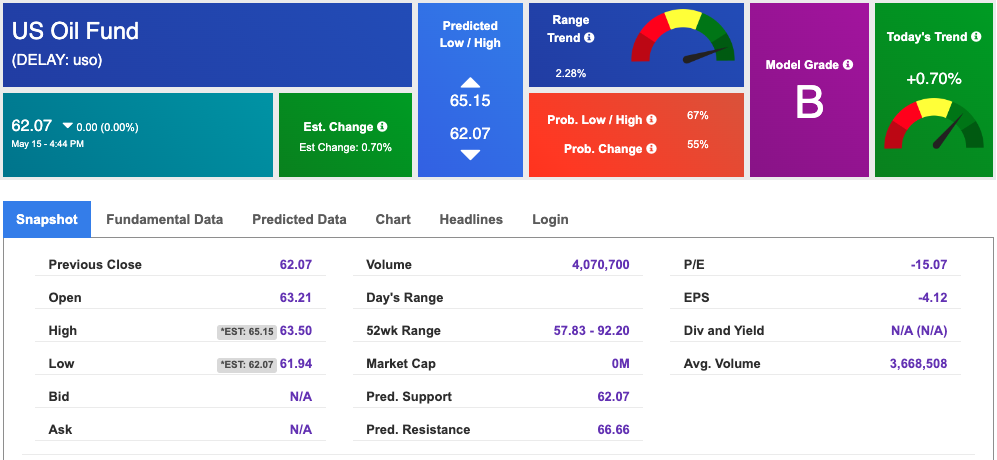
Looking at USO, a crude oil tracker, our 10-day prediction model shows mixed signals. The fund is trading at $62.07 at the time of publication. Prediction data is uploaded after the market close at 6 p.m., CST. Today’s data is based on market signals from the previous trading session.
The price for the Gold Continuous Contract (GC00) is up 0.08% at $2021.40 at the time of publication.
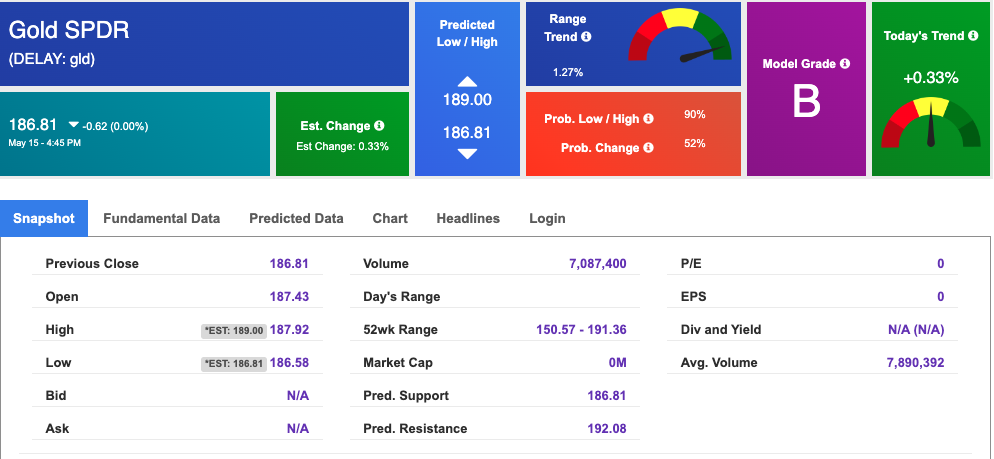
Using SPDR GOLD TRUST (GLD) as a tracker in our Stock Forecast Tool, the 10-day prediction window shows mixed signals. The gold proxy is trading at $186.81 at the time of publication. Vector signals show +0.33% for today. Prediction data is uploaded after the market close at 6 p.m., CST. Today’s data is based on market signals from the previous trading session.
The yield on the 10-year Treasury note is up at 3.507% at the time of publication.
The yield on the 30-year Treasury note is up at 3.843% at the time of publication.
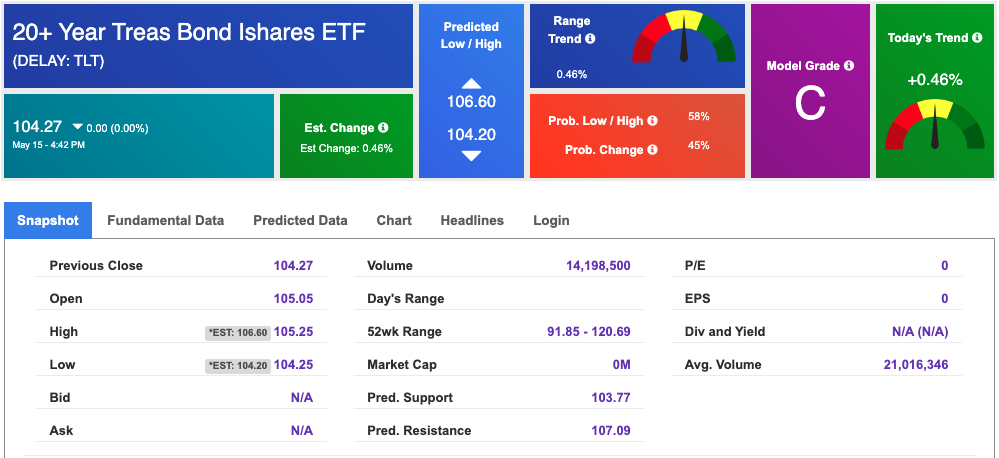
Using the iShares 20+ Year Treasury Bond ETF (TLT) as a proxy for bond prices in our Stock Forecast Tool, we see mixed signals in our 10-day prediction window. Prediction data is uploaded after the market close at 6 p.m., CST. Today’s data is based on market signals from the previous trading session.
The CBOE Volatility Index (^VIX) is $17.12 at the time of publication, and our 10-day prediction window shows mixed signals. Prediction data is uploaded after the market close at 6 p.m., CST. Today’s data is based on market signals from the previous trading session.
Please share this Tradespoon Market Commentary with your friends.
![]()

![]()
Comments Off on


Tradespoon Tools make finding winning trades in minute as easy as 1-2-3.
Our simple 3 step approach has resulted in an average return of almost 20% per trade!

