 Are you a Long-Term Trader? Then take a look at our NEW RoboInvestor Service?
CLICK HERE TO LEARN MORE
Are you a Long-Term Trader? Then take a look at our NEW RoboInvestor Service?
CLICK HERE TO LEARN MORE
As the new trading week kicks off, Wall Street sees a slight uptick in stocks following last week’s record highs. Investors, however, approach cautiously, with markets opening with minimal changes on Monday amid anticipation of Tuesday’s critical inflation data.
Throughout the year, the market has enjoyed a buoyant ride, buoyed by robust corporate earnings, indications of a thriving economy, and excitement surrounding the potential of artificial intelligence technology. Nevertheless, the looming release of Tuesday’s consumer-price index holds sway over investor sentiment, with many keenly observing for any cues that might influence the Federal Reserve’s future monetary policy decisions.
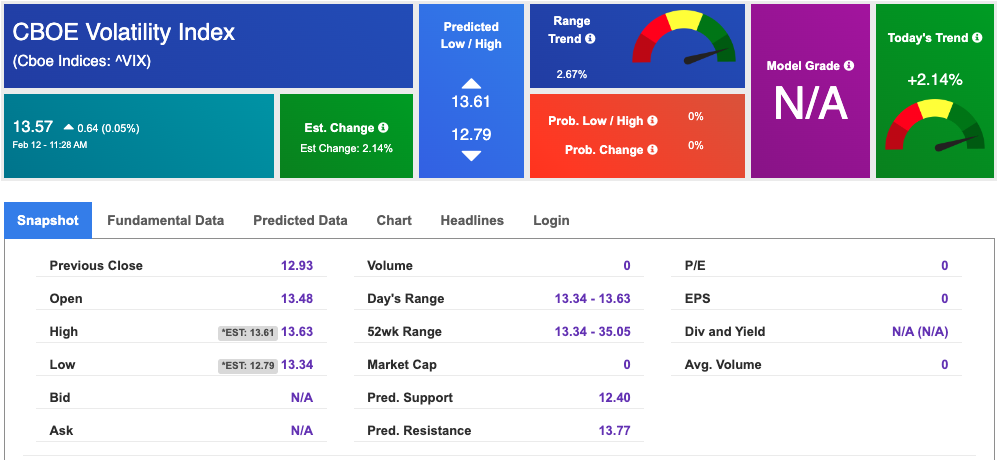
In early trading, the 10-year Treasury yield has climbed to 4.184%, a figure indicative of investor jitters as they navigate uncertainties in the market. Reflecting this sentiment, the CBOE Volatility Index, often dubbed the market’s “fear gauge,” has seen a 4.3% uptick, settling at 13.48.
Driving today’s gains are notable performances in the communication services, materials, and energy sectors, all registering increases of more than 0.7%. Over in Europe, optimism prevails as stocks close higher, mirroring the anticipation surrounding Tuesday’s U.S. inflation data.
Analyzing current market trends unveils a subtle shift toward patterns suggestive of higher highs and higher lows in the coming weeks. This suggests that while the market may have reached its peak phase of the rally, there’s still room for growth. Factoring in economic indicators and corporate earnings, investors gain a clearer understanding of the prevailing sentiment and potential trajectory of the financial landscape in 2024.
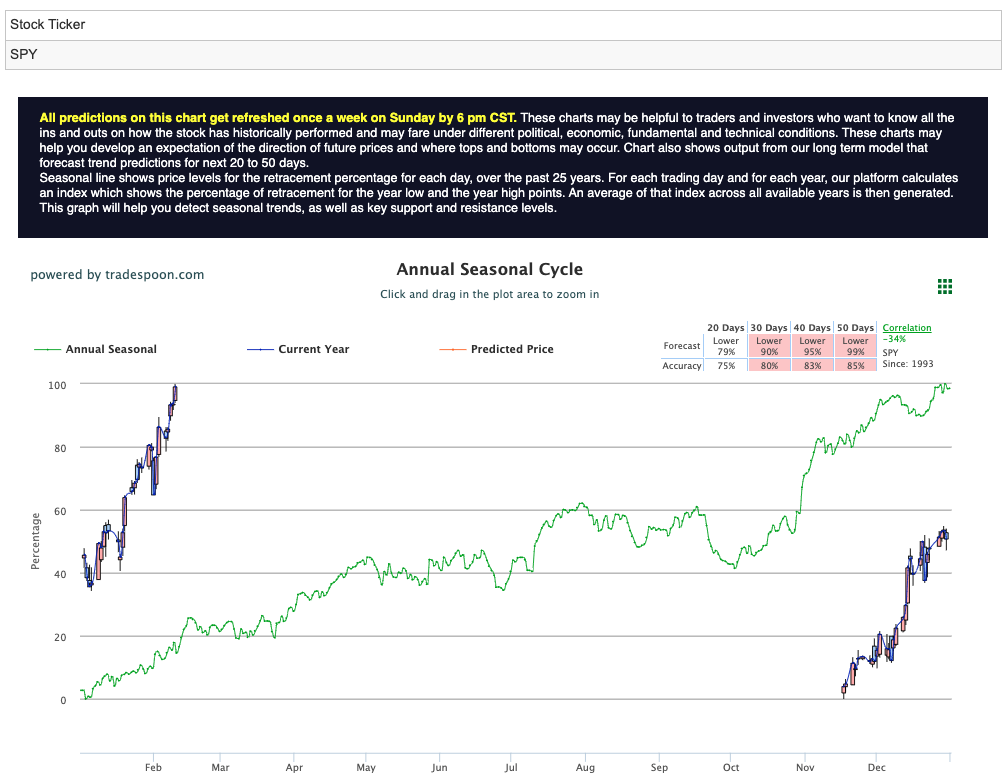
Looking ahead, projections indicate the SPY rally could encounter resistance levels around $500-510, with short-term support likely to hold steady between 460-470 in the ensuing months. For reference, the SPY Seasonal Chart is shown below:
Reflecting on last week’s performance, economic data painted a positive picture, with the Institute for Supply Management (ISM) Services Purchasing Managers’ Index (PMI) and the S&P Global Services PMI signaling expansion in the services sector. This trend underscores the overall strength of the industry.
As the week progresses, attention turns to an array of earnings reports. Tuesday sees highly anticipated releases from industry giants like Airbnb, Coca-Cola, and Lyft. Cisco Systems takes the spotlight on Wednesday, while Thursday brings reports from DraftKings and Coinbase. Additionally, alongside Tuesday’s core CPI, Thursday will feature key data on retail sales and the import price index, followed by core PPI and housing data on Friday.
With the stage set for another eventful week, investors remain vigilant, navigating through data and corporate earnings to steer their portfolios amidst an evolving financial landscape.
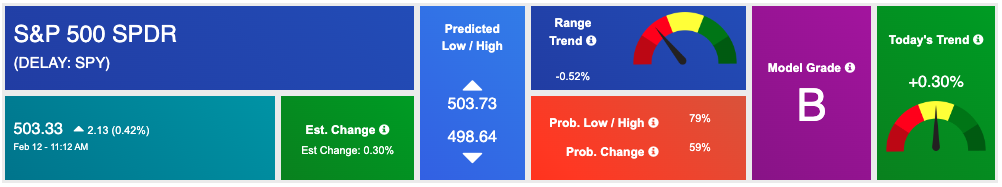
Using the “SPY” symbol to analyze the S&P 500 our 10-day prediction window shows a near-term positive outlook. Prediction data is uploaded after the market closes at 6 p.m. CST. Today’s data is based on market signals from the previous trading session.
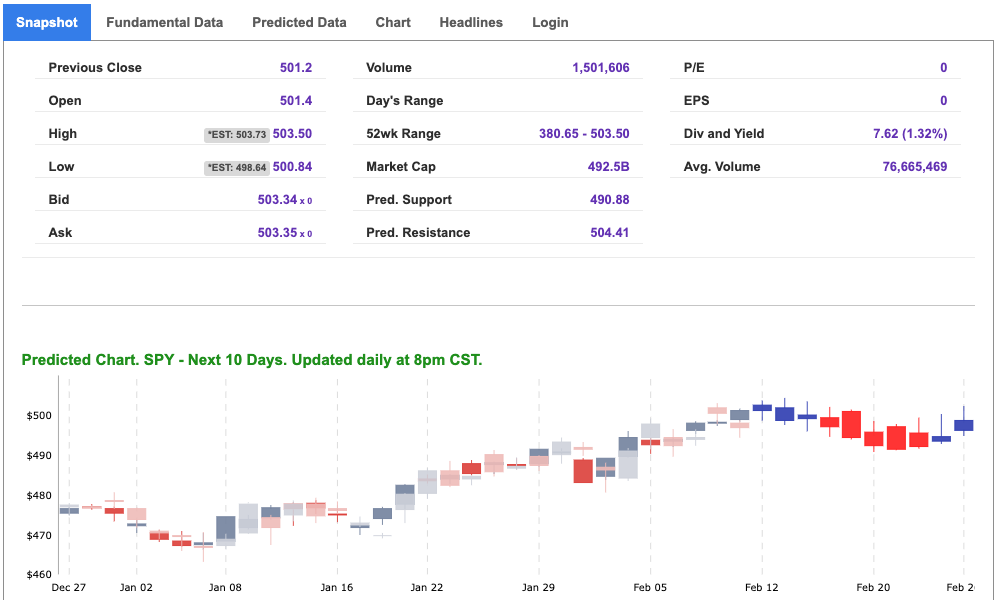
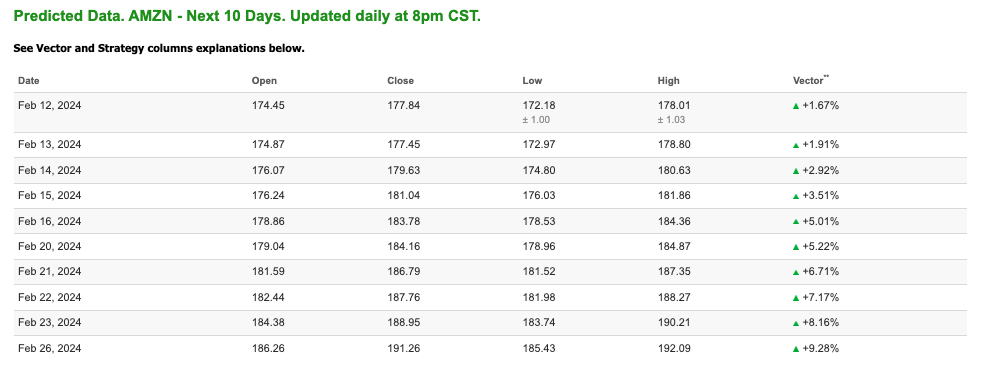
Note: The Vector column calculates the change of the Forecasted Average Price for the next trading session relative to the average of actual prices for the last trading session. The column shows the expected average price movement “Up or Down”, in percent. Trend traders should trade along the predicted direction of the Vector. The higher the value of the Vector the higher its momentum.
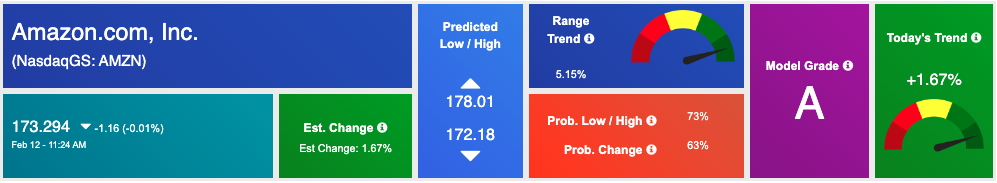
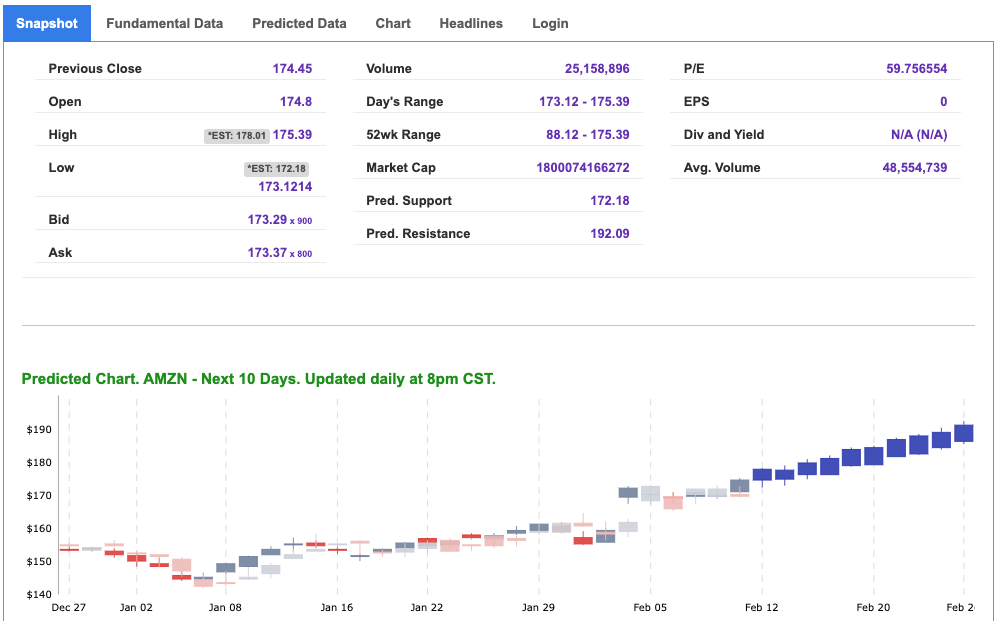
*Please note: At the time of publication Vlad Karpel does have a position in the featured symbol, amzn. Our featured symbol is part of your free subscription service. It is not included in any paid Tradespoon subscription service. Vlad Karpel only trades his money in paid subscription services. If you are a paid subscriber, please review your Premium Member Picks, ActiveTrader, or MonthlyTrader recommendations. If you are interested in receiving Vlad’s picks, please click here.
West Texas Intermediate for Crude Oil delivery (CL.1) is priced at $76.68 per barrel, down 0.18%, at the time of publication.
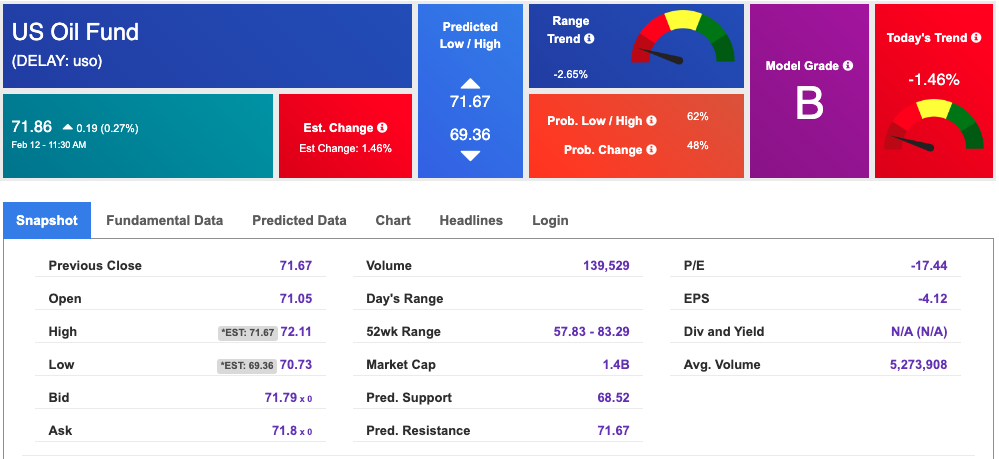
Looking at USO, a crude oil tracker, our 10-day prediction model shows mixed signals. The fund is trading at $71.86 at the time of publication. Prediction data is uploaded after the market close at 6 p.m., CST. Today’s data is based on market signals from the previous trading session.
The price for the Gold Continuous Contract (GC00) is down 0.32% at $2032.10 at the time of publication.
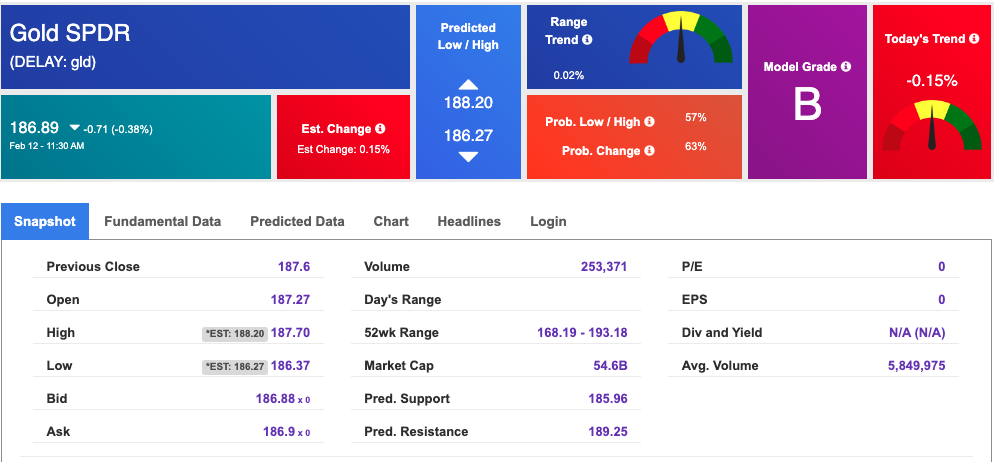
Using SPDR GOLD TRUST (GLD) as a tracker in our Stock Forecast Tool, the 10-day prediction window shows mixed signals. The gold proxy is trading at $186.89 at the time of publication. Vector signals show -0.15% for today. Prediction data is uploaded after the market close at 6 p.m., CST. Today’s data is based on market signals from the previous trading session.
The yield on the 10-year Treasury note is down at 4.164% at the time of publication.
The yield on the 30-year Treasury note is down at 4.371% at the time of publication.
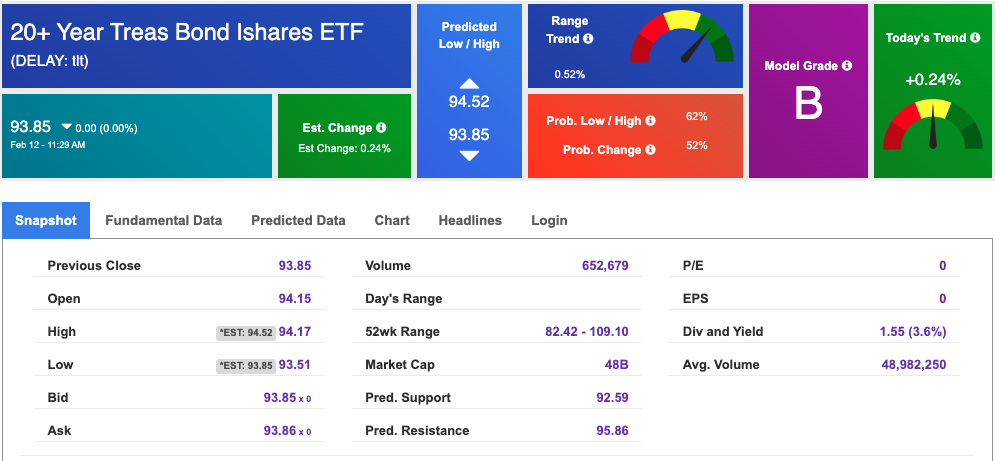
Using the iShares 20+ Year Treasury Bond ETF (TLT) as a proxy for bond prices in our Stock Forecast Tool, we see mixed signals in our 10-day prediction window. Prediction data is uploaded after the market close at 6 p.m., CST. Today’s data is based on market signals from the previous trading session.
The CBOE Volatility Index (^VIX) is priced at $13.57 up 0.05% at the time of publication, and our 10-day prediction window shows mixed signals. Prediction data is uploaded after the market close at 6 p.m., CST. Today’s data is based on market signals from the previous trading session.
Please share this Tradespoon Market Commentary with your friends.
![]()

![]()
Comments Off on


Tradespoon Tools make finding winning trades in minute as easy as 1-2-3.
Our simple 3 step approach has resulted in an average return of almost 20% per trade!

