 Special Offer: Try the 'Elite Trading Circle Membership' for ONLY $37!
CLICK HERE TO LEARN MORE
Special Offer: Try the 'Elite Trading Circle Membership' for ONLY $37!
CLICK HERE TO LEARN MORE
The stock market experienced some fluctuations on Wednesday, with the Dow slipping while the S&P and Nasdaq closed in the green. This came after a second day of congressional testimony by Federal Reserve Chairman Jerome Powell, who returned to Capitol Hill to testify before the House Financial Services Committee.
On Wednesday, Powell told the House Financial Services Committee that the central bank has not yet decided on the size of the March rate hike. The market’s next test will come on Friday with the release of the February jobs report. Economists expect 225,000 jobs to have been added, down from 517,000 in January, which would indicate a decline in demand and inflation and could prompt the Fed to pause its rate hikes.
The two-year Treasury yield was up to around 5%, indicating that the Fed is not finished with lifting interest rates. This follows Powell’s comments to the Senate earlier in the week that recent economic data point to too much economic strength and inflation for the Fed to pause its rate hikes at the moment. Rate increases are meant to reduce economic demand and control inflation.
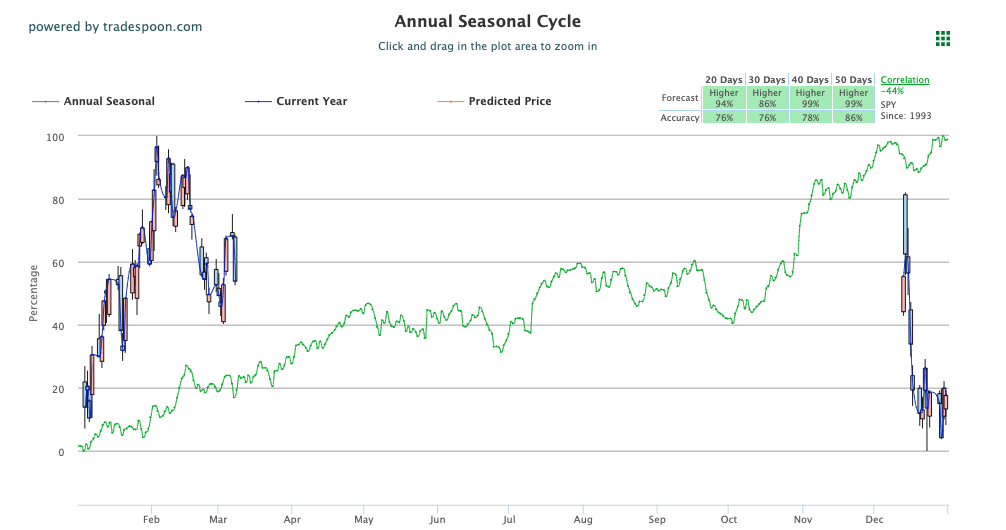
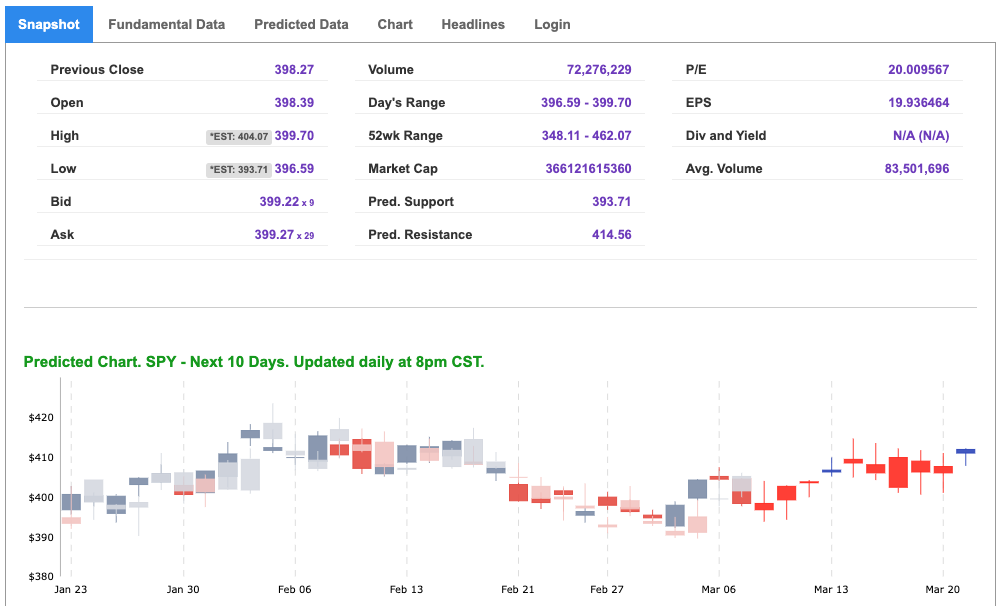
The $VIX is trading near the $18 level, and the earnings reports of companies such as $CRWD, $ORCL, and $DOCU this week, as well as Powell’s congressional hearing, could influence the next move in the market. The SPY is currently trading at overhead resistance levels of $408 and then $418, with support at $402 and then $395. Analysts predict the market to trade sideways for the next 2-8 weeks, and suggest a market-neutral approach, and encourage subscribers to hedge their positions. Market commentary readers should maintain clearly defined stop levels for all positions. For reference, the SPY Seasonal Chart is shown below:
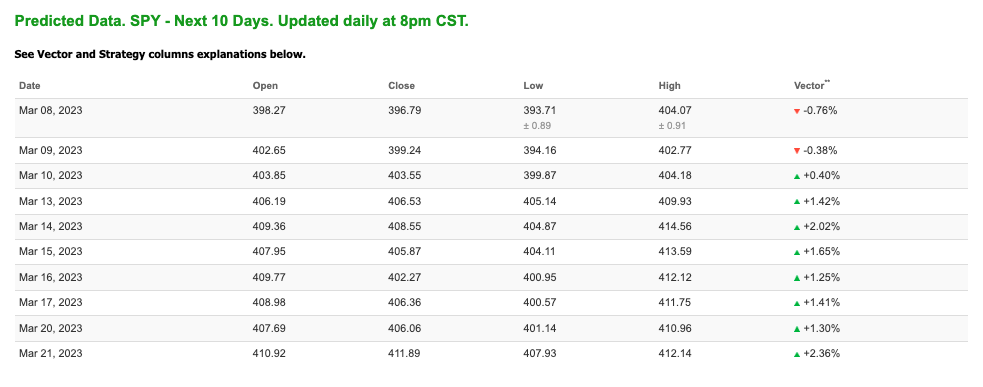
Note: The Vector column calculates the change of the Forecasted Average Price for the next trading session relative to the average of actual prices for the last trading session. The column shows the expected average price movement “Up or Down”, in percent. Trend traders should trade along the predicted direction of the Vector. The higher the value of the Vector the higher its momentum.
*Please note: At the time of publication Vlad Karpel does have a position in the featured symbol, spy. Our featured symbol is part of your free subscription service. It is not included in any paid Tradespoon subscription service. Vlad Karpel only trades his money in paid subscription services. If you are a paid subscriber, please review your Premium Member Picks, ActiveTrader, or MonthlyTrader recommendations. If you are interested in receiving Vlad’s picks, please click here.
West Texas Intermediate for Crude Oil delivery (CL.1) is priced at $76.40 per barrel, down 0.33%, at the time of publication.
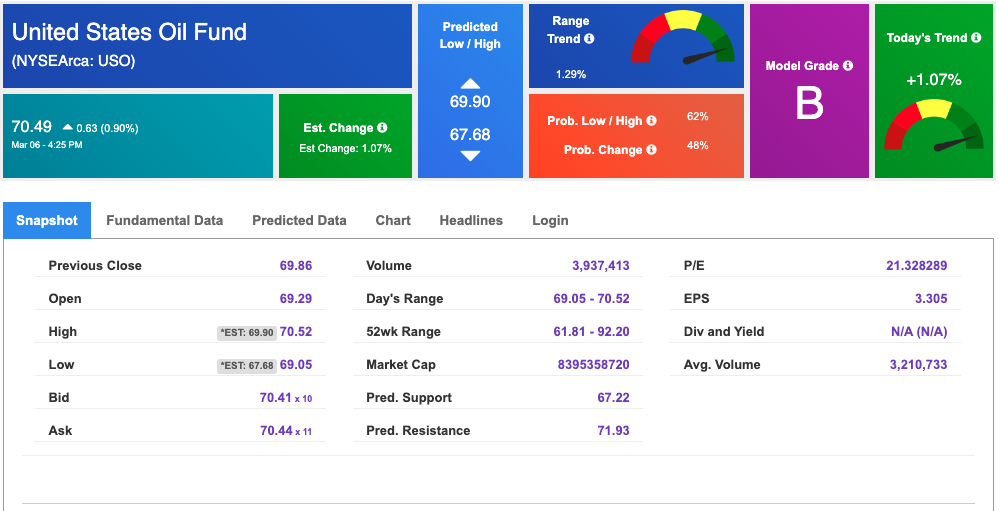
Looking at USO, a crude oil tracker, our 10-day prediction model shows mixed signals. The fund is trading at $70.49 at the time of publication. Prediction data is uploaded after the market close at 6 p.m., CST. Today’s data is based on market signals from the previous trading session.
The price for the Gold Continuous Contract (GC00) is down 0.01% at $1818.40 at the time of publication.
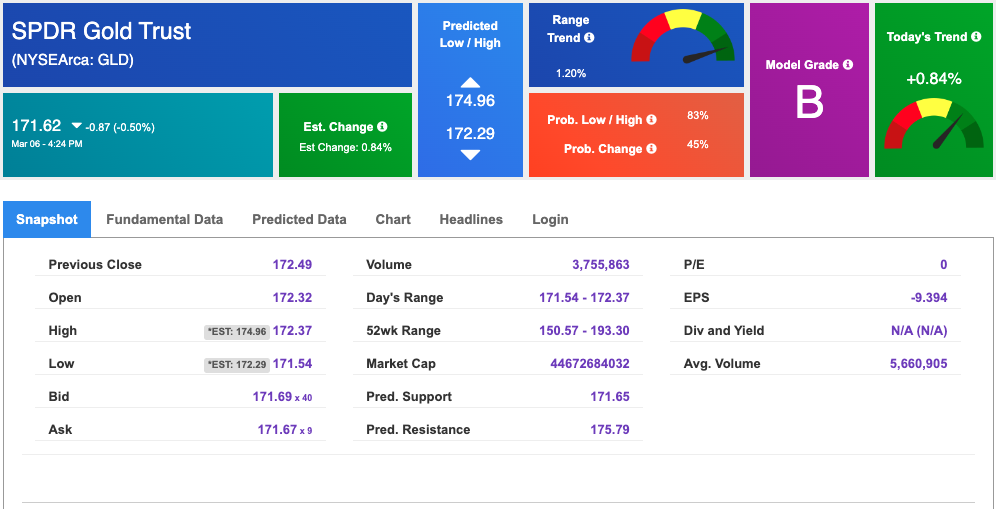
Using SPDR GOLD TRUST (GLD) as a tracker in our Stock Forecast Tool, the 10-day prediction window shows mixed signals. The gold proxy is trading at $171.62 at the time of publication. Vector signals show +0.84% for today. Prediction data is uploaded after the market close at 6 p.m., CST. Today’s data is based on market signals from the previous trading session.
The yield on the 10-year Treasury note is up at 3.992% at the time of publication.
The yield on the 30-year Treasury note is up at 3.896% at the time of publication.
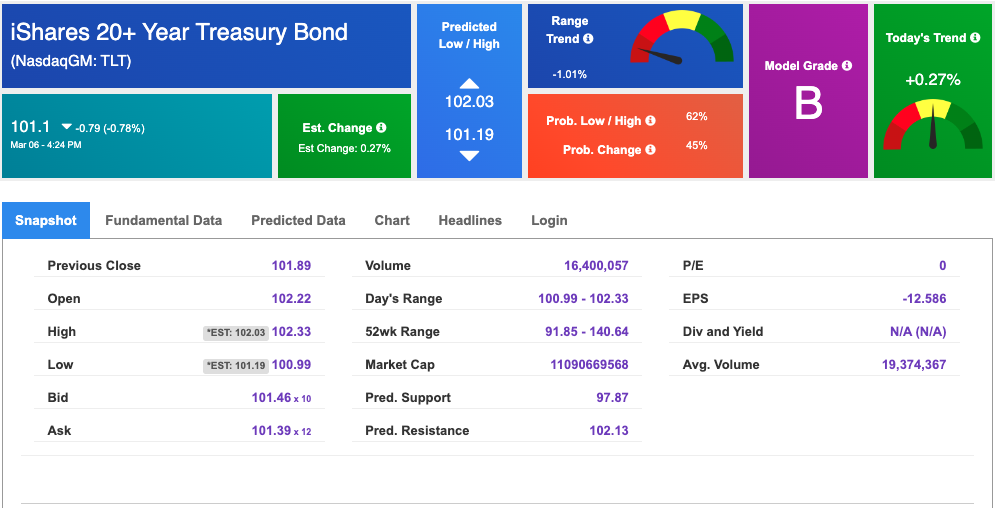
Using the iShares 20+ Year Treasury Bond ETF (TLT) as a proxy for bond prices in our Stock Forecast Tool, we see mixed signals in our 10-day prediction window. Prediction data is uploaded after the market close at 6 p.m., CST. Today’s data is based on market signals from the previous trading session.
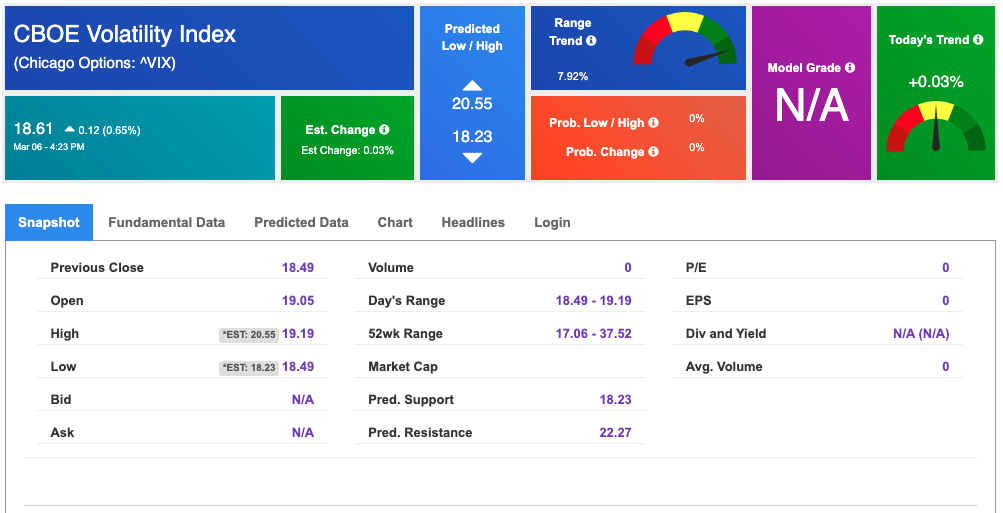
The CBOE Volatility Index (^VIX) is $18.61 at the time of publication, and our 10-day prediction window shows mixed signals. Prediction data is uploaded after the market close at 6 p.m., CST. Today’s data is based on market signals from the previous trading session.
Please share this Tradespoon Market Commentary with your friends.
![]()

![]()
Comments Off on


Tradespoon Tools make finding winning trades in minute as easy as 1-2-3.
Our simple 3 step approach has resulted in an average return of almost 20% per trade!

