 Sign Up for One-on-One Coaching and get our Premium Membership FREE for 1 Year!
CLICK HERE TO APPLY
Sign Up for One-on-One Coaching and get our Premium Membership FREE for 1 Year!
CLICK HERE TO APPLY
Ahead of this week’s crucial Federal Reserve meeting, the Dow Jones rose modestly, while the S&P 500 and Nasdaq Composite plummeted to even lower levels as investors focused on Russia-Ukraine developments and China’s COVID shutdown. Markets were tumultuous on Monday, with investors expressing uncertainty about the future as tensions between Russia and Ukraine remain high after a hoped-for détente came to nothing. On Tuesday, the fourth round of negotiations between Moscow and Kyiv was halted and will resume on Tuesday. Likewise, a group of American and Chinese security officials met in Rome on Monday following reports that Russia is attempting to acquire military equipment from the Chinese. China also imposed emergency measures to combat a COVID outbreak in the country’s northeast and seal off the main southern industrial zone of Shenzhen, which has added to concerns about global trade. With inflation now at nearly 8%, the Chinese lockdowns have the potential to make supply-chain difficulties even greater.
Ahead for this week is the Federal Reserve’s policy gathering, which will begin on Tuesday and will conclude on Wednesday with a decision from the Fed and remarks from Fed chair Jerome Powell. In response to rising prices, the Federal Reserve is expected to raise interest rates for the first time in more than two years. Monthly retail sales and import price index reports are also due Wednesday. Globally, both Asian and European markets started the week with mixed results. Geopolitical risks in Ukraine, the PPI data, and the Fed meeting this week can impact the next move in the market. We are watching the vital support levels in the SPY, which are presently at $420 and then $400. With the $VIX is trading near the 32 level, the $SPY overhead resistance is at $445. We expect the market to pull back further in the next two weeks.
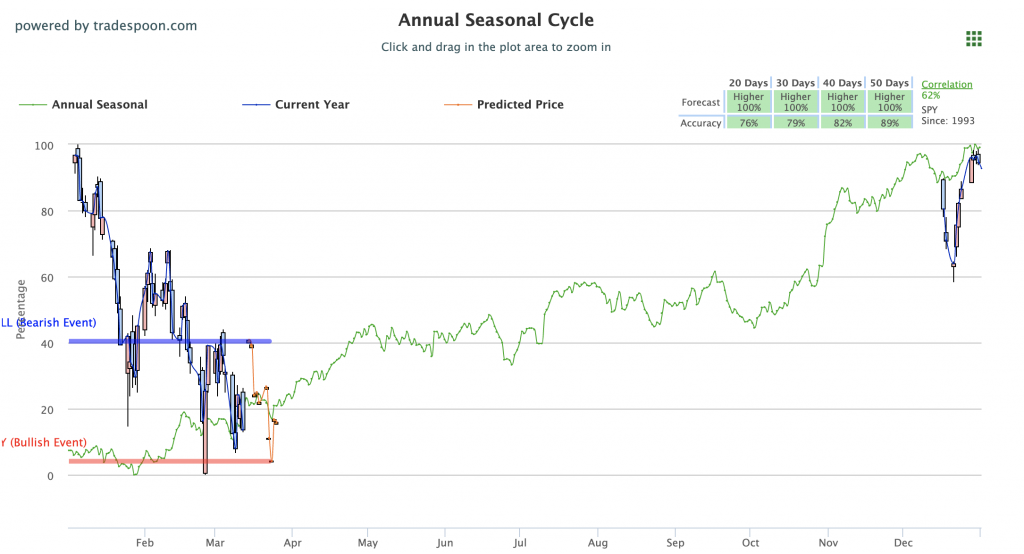
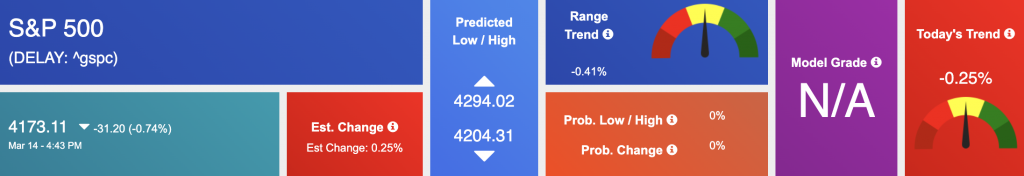
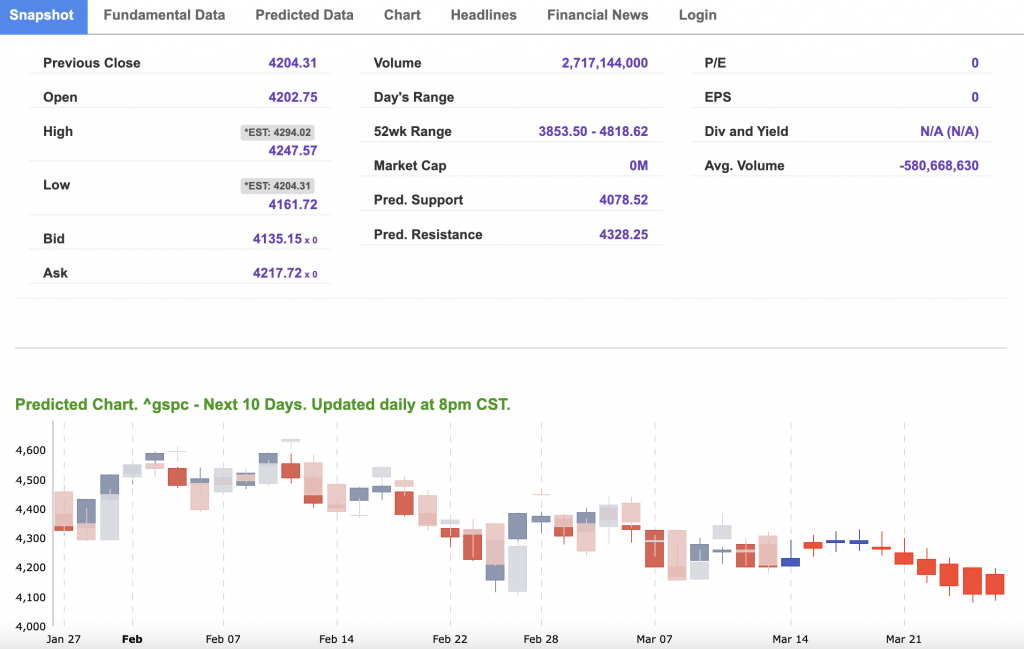
Using the “^GSPC” symbol to analyze the S&P 500 our 10-day prediction window shows a near-term mixed outlook. Prediction data is uploaded after the market closes at 6 p.m. CST. Today’s data is based on market signals from the previous trading session.
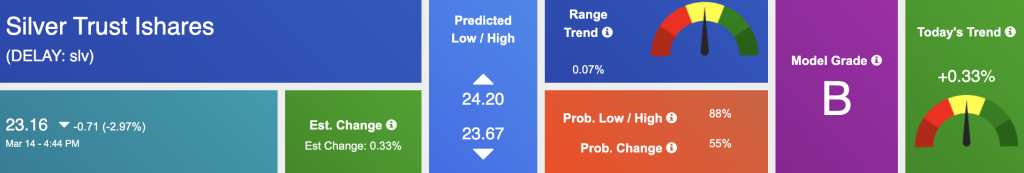
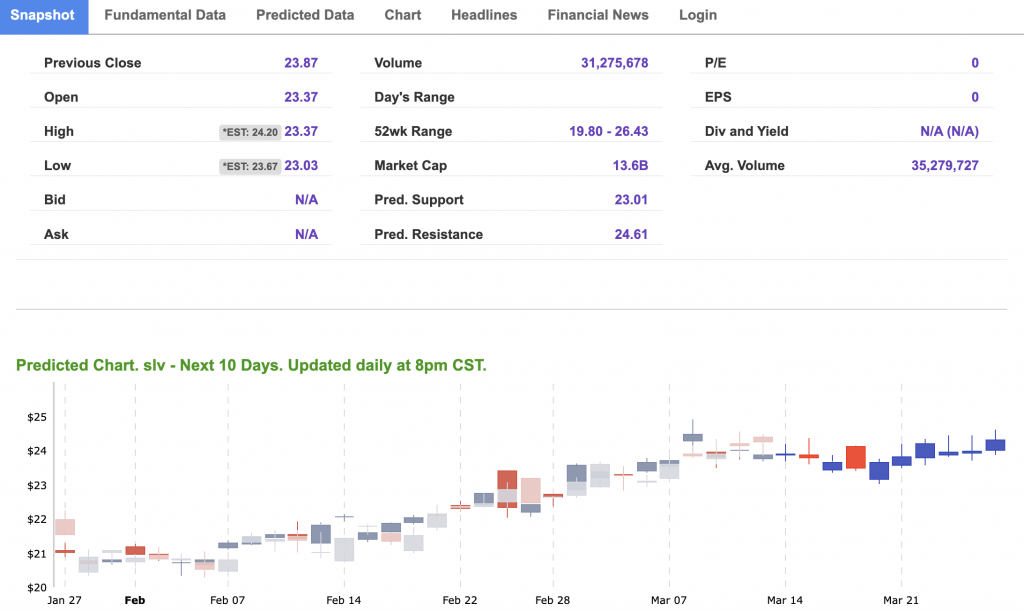
The symbol is trading at $23.16 with a vector of +0.33% at the time of publication.
10-Day Prediction data is uploaded after the market close at 6 p.m., CST. Today’s data is based on market signals from the previous trading session.
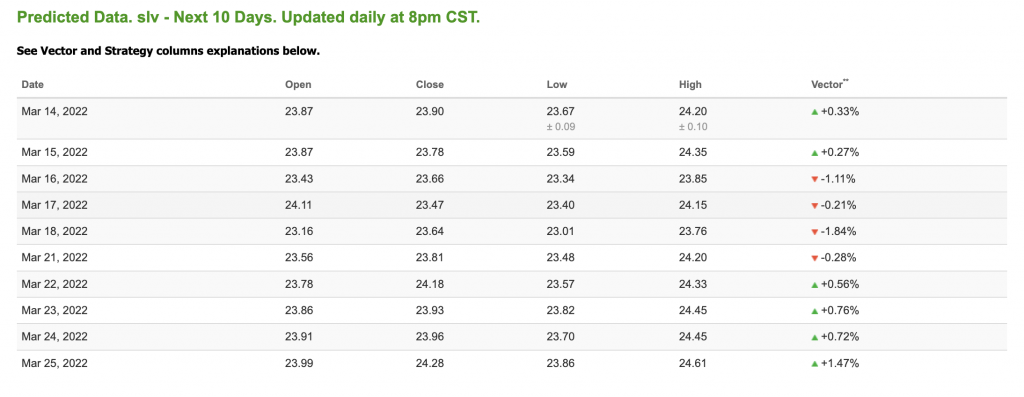
Note: The Vector column calculates the change of the Forecasted Average Price for the next trading session relative to the average of actual prices for the last trading session. The column shows the expected average price movement “Up or Down”, in percent. Trend traders should trade along the predicted direction of the Vector. The higher the value of the Vector the higher its momentum.
*Please note: At the time of publication Vlad Karpel does have a position in the featured symbol, SLV. Our featured symbol is part of your free subscription service. It is not included in any paid Tradespoon subscription service. Vlad Karpel only trades his money in paid subscription services. If you are a paid subscriber, please review your Premium Member Picks, ActiveTrader, or MonthlyTrader recommendations. If you are interested in receiving Vlad’s picks, please click here.
West Texas Intermediate for Crude Oil delivery (CL.1) is priced at $102.04 per barrel, down 6.67% at the time of publication.
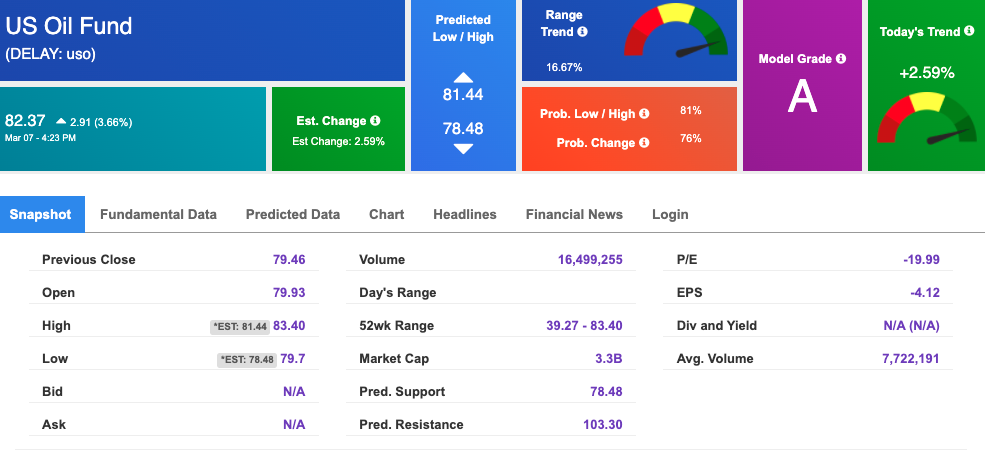
Looking at USO, a crude oil tracker, our 10-day prediction model shows mixed signals. The fund is trading at $82.37 at the time of publication. Prediction data is uploaded after the market close at 6 p.m., CST. Today’s data is based on market signals from the previous trading session.
The price for the Gold Continuous Contract (GC00) is down 1.60% at $1953.20 at the time of publication.

Using SPDR GOLD TRUST (GLD) as a tracker in our Stock Forecast Tool, the 10-day prediction window shows mixed signals. The gold proxy is trading at $186.41 at the time of publication. Vector signals show +1.13% for today. Prediction data is uploaded after the market close at 6 p.m., CST. Today’s data is based on market signals from the previous trading session.
The yield on the 10-year Treasury note is up, at 2.144% at the time of publication.
The yield on the 30-year Treasury note is up, at 2.478% at the time of publication.
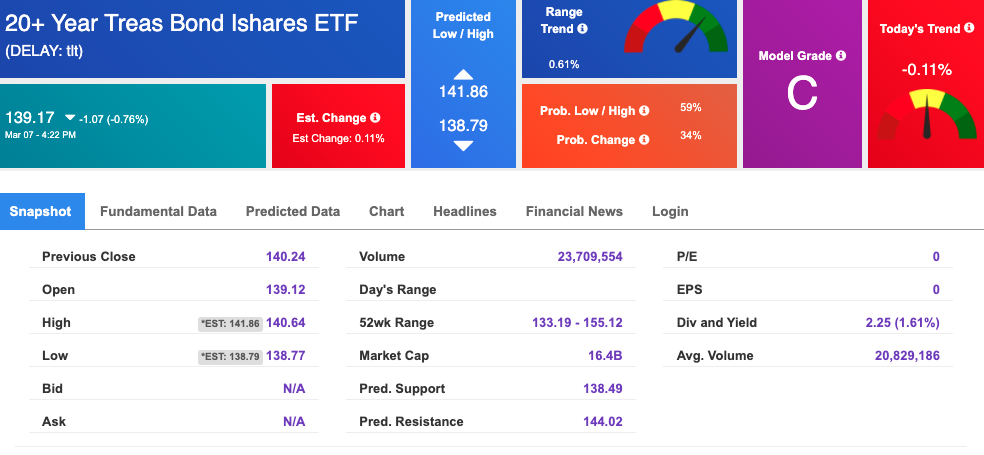
Using the iShares 20+ Year Treasury Bond ETF (TLT) as a proxy for bond prices in our Stock Forecast Tool, we see mixed signals in our 10-day prediction window. Prediction data is uploaded after the market close at 6 p.m., CST. Today’s data is based on market signals from the previous trading session.
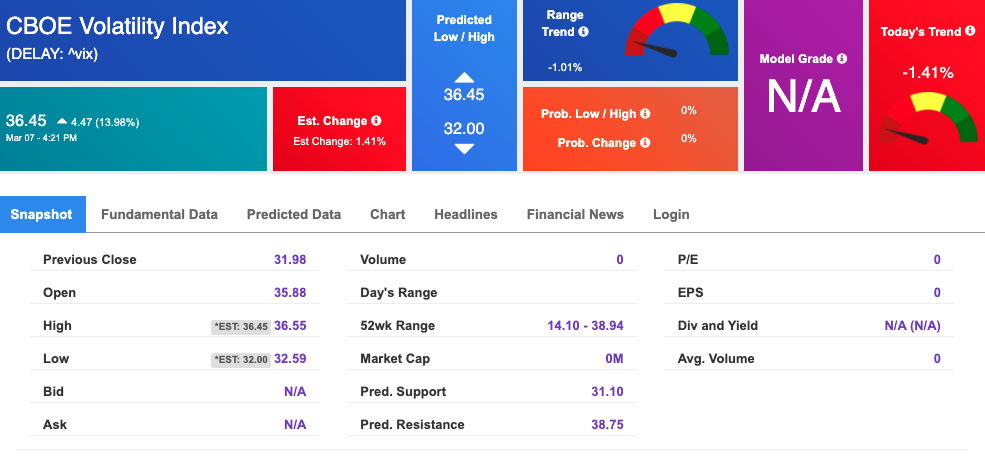
The CBOE Volatility Index (^VIX) is $36.45 at the time of publication, and our 10-day prediction window shows mixed signals. Prediction data is uploaded after the market close at 6 p.m., CST. Today’s data is based on market signals from the previous trading session.
Please share this Tradespoon Market Commentary with your friends.
![]()

![]()
Comments Off on


Tradespoon Tools make finding winning trades in minute as easy as 1-2-3.
Our simple 3 step approach has resulted in an average return of almost 20% per trade!

