 Are you a Long-Term Trader? Then take a look at our NEW RoboInvestor Service?
CLICK HERE TO LEARN MORE
Are you a Long-Term Trader? Then take a look at our NEW RoboInvestor Service?
CLICK HERE TO LEARN MORE
As a new week unfolds, investors brace themselves for a flurry of earnings reports from major retailers, eager to gauge the pulse of consumer spending and the broader economic landscape. A host of prominent names including Macy’s, Kohl’s, Nordstrom, Dick’s Sporting Goods, Foot Locker, BJ’s Wholesale Club, Dollar Tree, and Lowe’s are poised to unveil their financial performance, providing critical insights into the health of the U.S. consumer market. Adding to the mix, technology giant Nvidia is also set to reveal its earnings, contributing to the intricate tapestry of market sentiment.
One notable event looming on the horizon is the Jackson Hole symposium, hosted by the Federal Reserve, which draws central bankers’ attention worldwide. The symposium, commencing Thursday evening, features Chairman Jerome Powell’s pivotal speech scheduled for Friday morning. Financial analysts and experts are eagerly awaiting his address, anticipating any hints or signals regarding the central bank’s trajectory for interest rates and its approach to shaping future monetary policy.
Chair Powell’s message is expected to underscore the Federal Reserve’s continued reliance on data as the bedrock of its decisions. Amidst evolving economic dynamics, this stance is poised to offer investors valuable insights into the Fed’s perspective on the current economic landscape.
While earnings and the Fed’s messaging occupy center stage, there are additional factors at play that demand market participants’ attention. Bond yields have recently experienced an uptick, sending ripples through the equity market. The S&P 500, which scaled to impressive heights earlier this year, is now down nearly 5%, a reflection of the 10-year Treasury yield’s climb from just under 4% to over 4.3% since the end of July. Lingering concerns about inflation’s stickiness, even after a significant decrease from its peak last year, contribute to the current market unease.
The start of the week brings a measure of relief as the 10-year yield stabilizes around the 4.3% mark. However, the tech sector remains on the precipice of a potential correction, a situation noted by technical analysts who find this outcome increasingly likely. Meanwhile, Chinese economic reports reveal gaps in data, raising alarms about the nation’s economic well-being, as highlighted by analysts from CreditSights.
China’s absence of youth unemployment data for July and its decision to cease reporting the metric triggered a drop in Chinese stocks. Furthermore, China’s central bank’s adjustments to interest rates fell short of market expectations, quashing hopes for stimulus to support the world’s second-largest economy. In a somewhat unexpected move, the People’s Bank of China reduced its one-year loan prime rate by a modest 0.1 percentage point to 3.45%, while maintaining the five-year rate at 4.2%. This divergence from economists’ predictions—anticipating a more substantial 0.15 percentage point cut—adds to the uncertainty prevailing in financial markets.
Against this backdrop, European stock markets ascend on Monday, with energy firms at the forefront of gains. The upward trajectory of oil prices, coupled with the heightened awareness of the ongoing hurricane season, propelled Brent crude—the global oil price benchmark—by 1.1%, while West Texas Intermediate, the U.S. standard, achieved a 1.2% increase.
As we head into the second half of 2023, an air of cautious optimism prevails despite the anticipated surge in market volatility. Forecasts for the SPY rally boundary, a bellwether for investor sentiment, span a range of $450 to $470. – while support levels, spanning from 400 to 430, might offer investors a guide to navigating the turbulent waters of the financial landscape. For reference, the SPY Seasonal Chart is shown below:
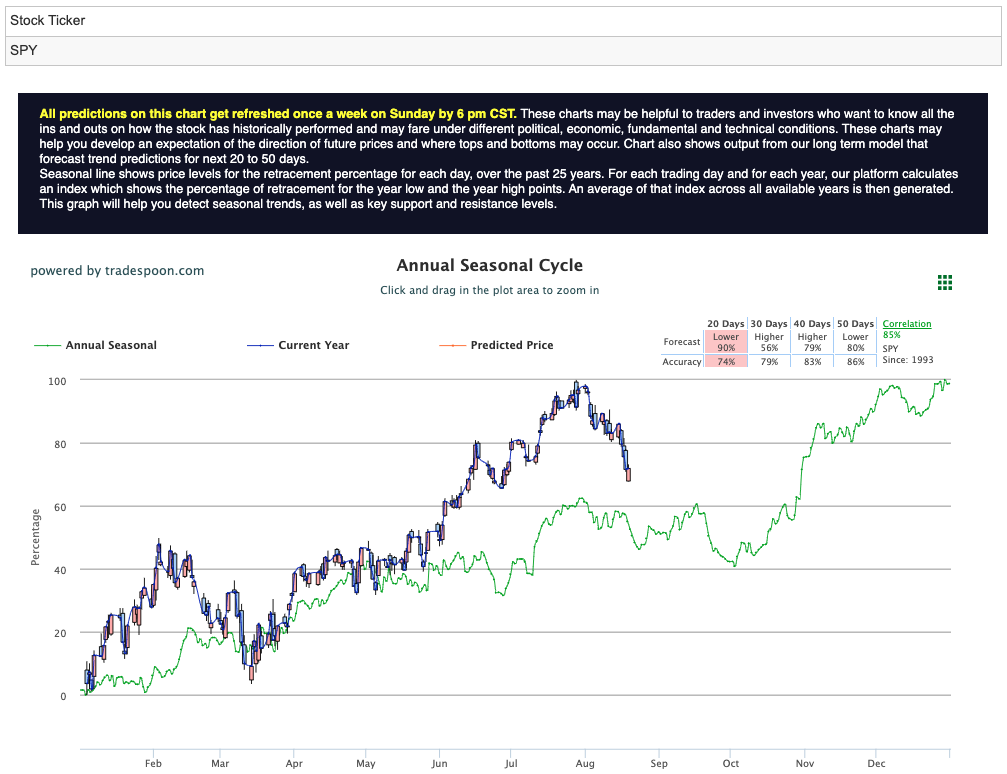
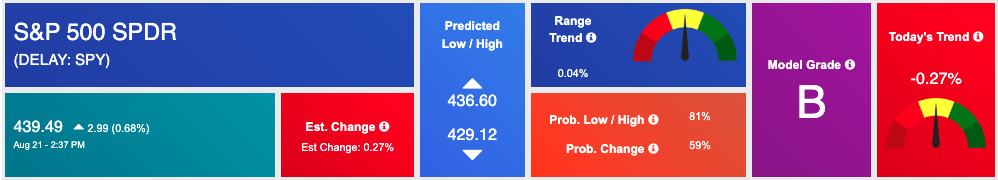
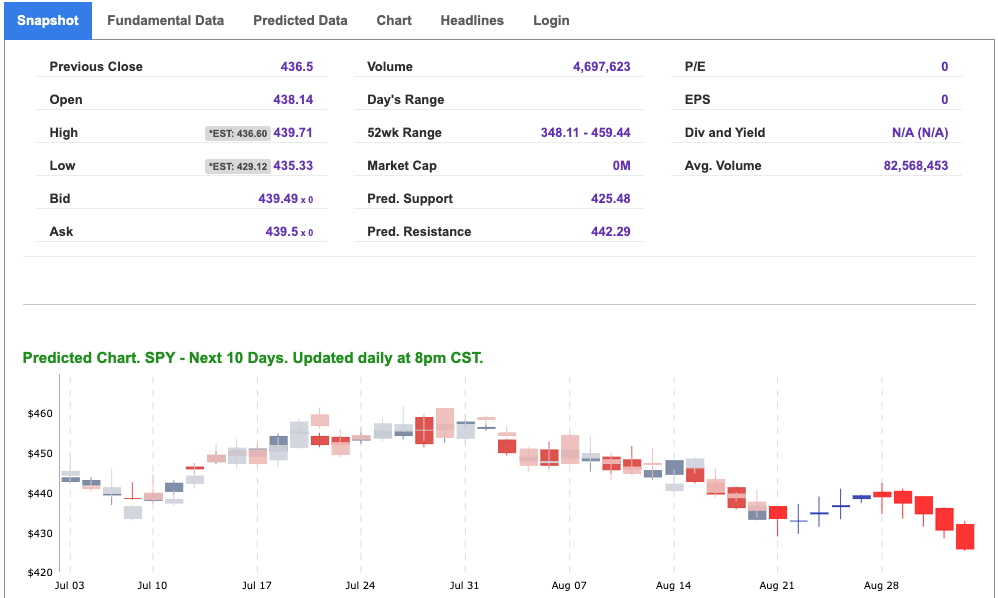
Using the “SPY” symbol to analyze the S&P 500 our 10-day prediction window shows a near-term positive outlook. Prediction data is uploaded after the market closes at 6 p.m. CST. Today’s data is based on market signals from the previous trading session.
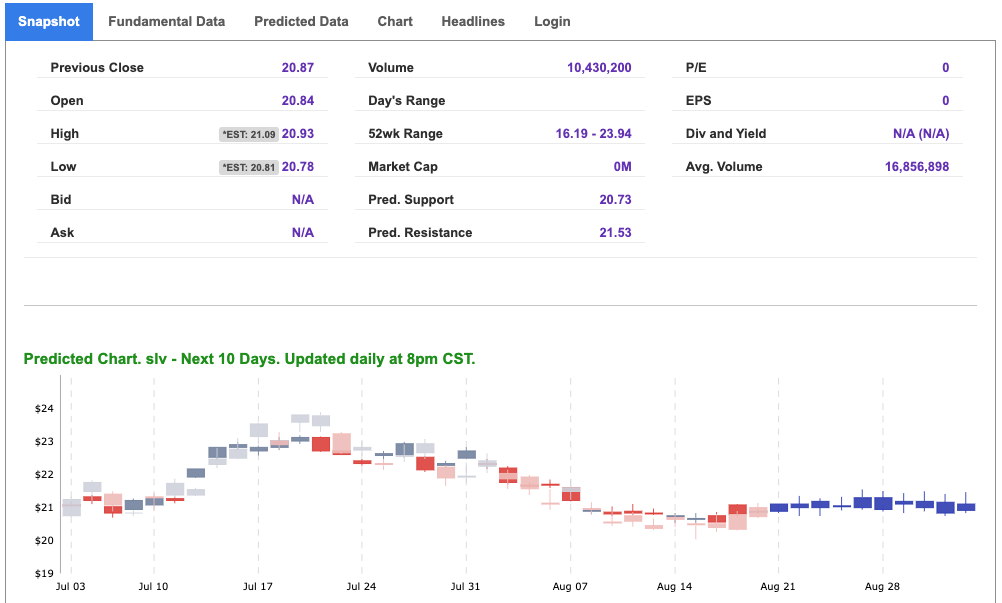
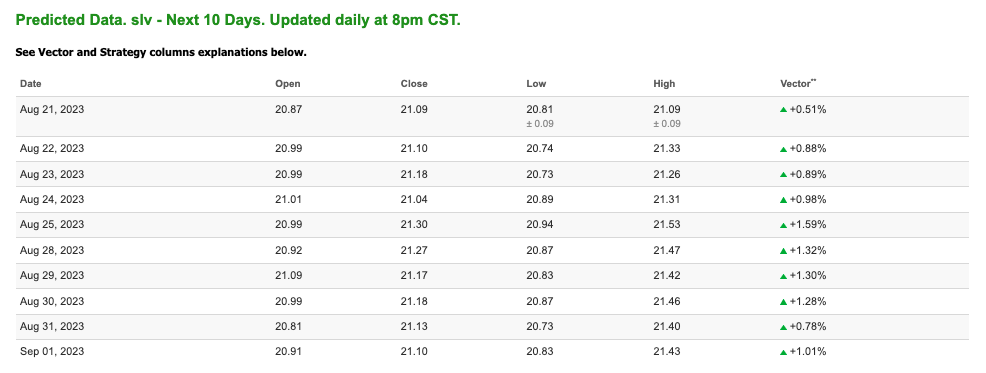
Note: The Vector column calculates the change of the Forecasted Average Price for the next trading session relative to the average of actual prices for the last trading session. The column shows the expected average price movement “Up or Down”, in percent. Trend traders should trade along the predicted direction of the Vector. The higher the value of the Vector the higher its momentum.
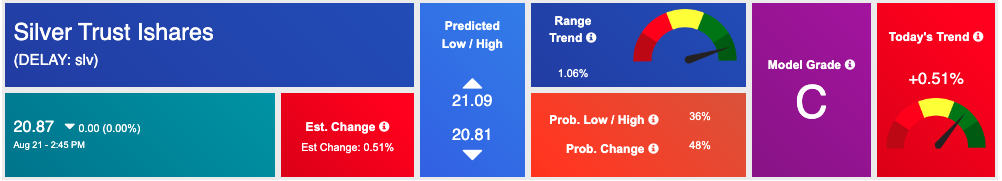
*Please note: At the time of publication Vlad Karpel does NOT have a position in the featured symbol, SLV. Our featured symbol is part of your free subscription service. It is not included in any paid Tradespoon subscription service. Vlad Karpel only trades his money in paid subscription services. If you are a paid subscriber, please review your Premium Member Picks, ActiveTrader, or MonthlyTrader recommendations. If you are interested in receiving Vlad’s picks, please click here.
West Texas Intermediate for Crude Oil delivery (CL.1) is priced at $80.79 per barrel, down 0.57%, at the time of publication.
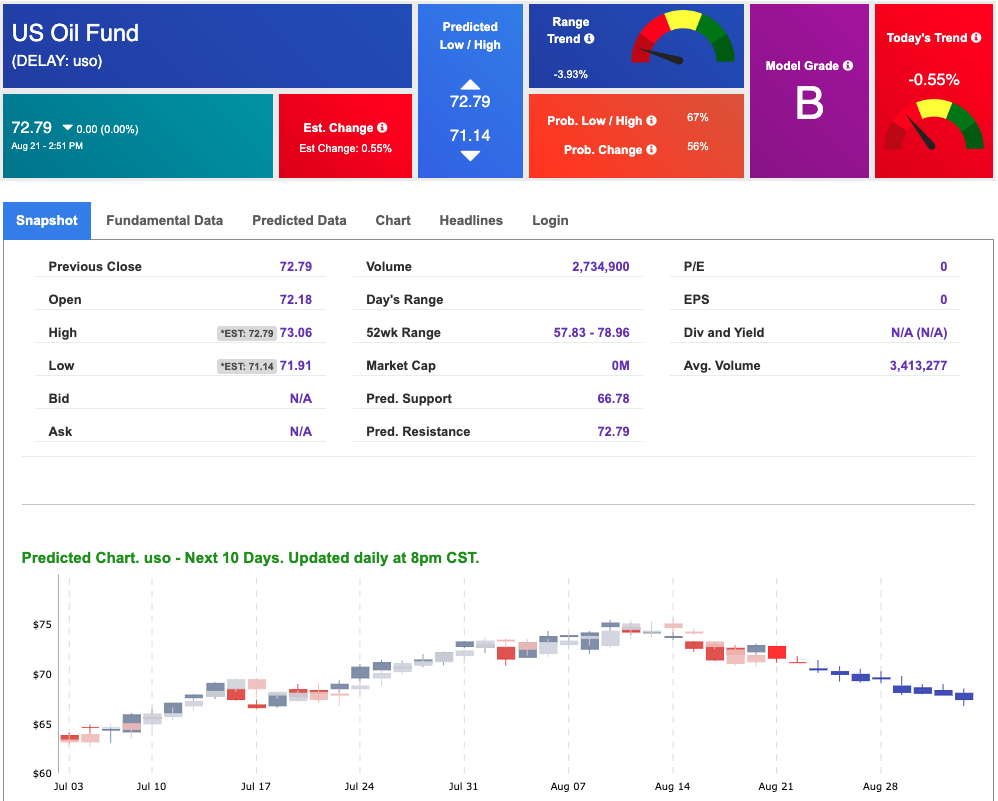
Looking at USO, a crude oil tracker, our 10-day prediction model shows mixed signals. The fund is trading at $72.79 at the time of publication. Prediction data is uploaded after the market close at 6 p.m., CST. Today’s data is based on market signals from the previous trading session.
The price for the Gold Continuous Contract (GC00) is up 0.38% at $1923.70 at the time of publication.
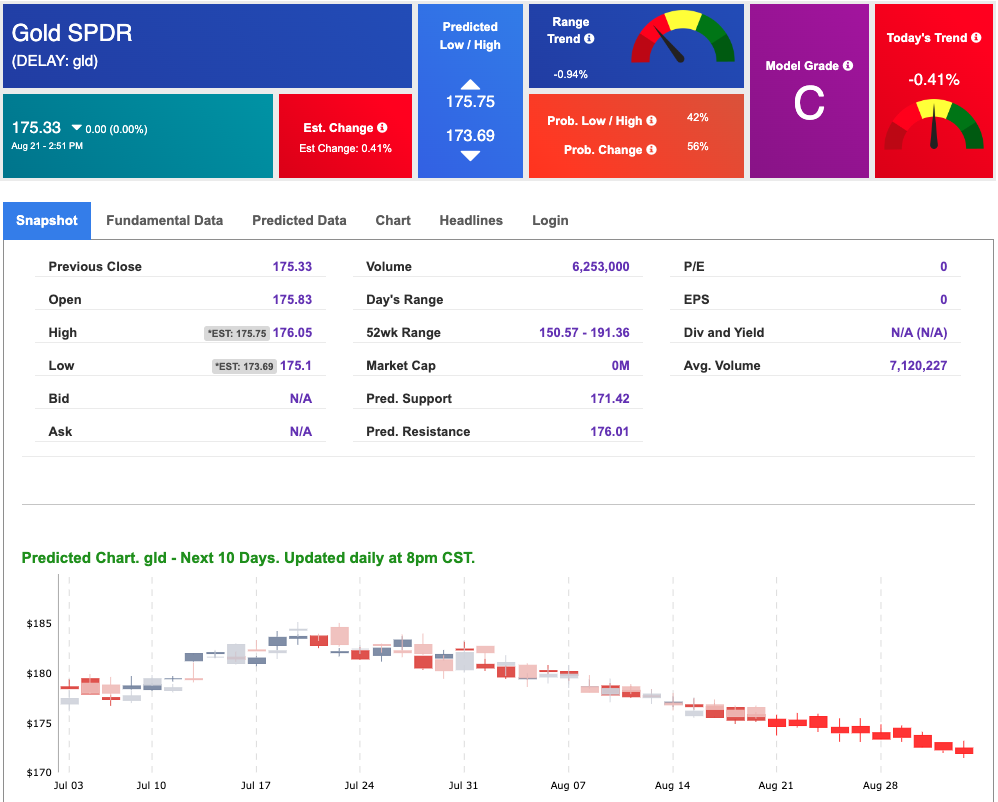
Using SPDR GOLD TRUST (GLD) as a tracker in our Stock Forecast Tool, the 10-day prediction window shows mixed signals. The gold proxy is trading at $175.33 at the time of publication. Vector signals show -0.41% for today. Prediction data is uploaded after the market close at 6 p.m., CST. Today’s data is based on market signals from the previous trading session.
The yield on the 10-year Treasury note is up at 4.338% at the time of publication.
The yield on the 30-year Treasury note is up at 4.461% at the time of publication.
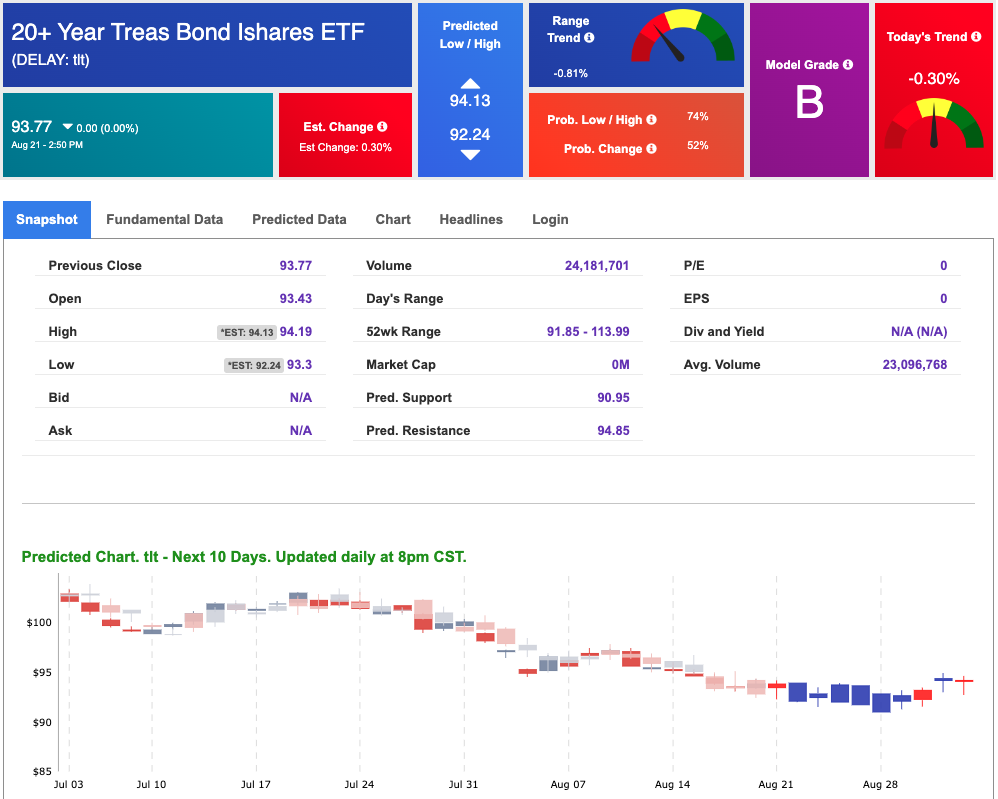
Using the iShares 20+ Year Treasury Bond ETF (TLT) as a proxy for bond prices in our Stock Forecast Tool, we see mixed signals in our 10-day prediction window. Prediction data is uploaded after the market close at 6 p.m., CST. Today’s data is based on market signals from the previous trading session.
The CBOE Volatility Index (^VIX) is priced at $16.93, down 2.14% at the time of publication, and our 10-day prediction window shows mixed signals. Prediction data is uploaded after the market close at 6 p.m., CST. Today’s data is based on market signals from the previous trading session.
Please share this Tradespoon Market Commentary with your friends.
![]()

![]()
Comments Off on


Tradespoon Tools make finding winning trades in minute as easy as 1-2-3.
Our simple 3 step approach has resulted in an average return of almost 20% per trade!

