 Are you a Long-Term Trader? Then take a look at our NEW RoboInvestor Service?
CLICK HERE TO LEARN MORE
Are you a Long-Term Trader? Then take a look at our NEW RoboInvestor Service?
CLICK HERE TO LEARN MORE
The first full trading day of October and the fourth quarter brought a mixed bag of results for U.S. indices. While the Nasdaq trended higher, the Dow Jones found itself in the red, and the S&P 500 closed with somewhat muted results. Surprisingly, investors appeared unfazed by the last-minute deal Congress reached over the weekend to avert a government shutdown. However, beneath this surface, there’s an undercurrent of concern and uncertainty as the labor market’s health takes center stage this week, potentially influencing the Federal Reserve’s decisions on interest rates.
This week, market watchers will keep a keen eye on three critical indicators of the labor market’s strength. These indicators will not only provide insights into the overall health of the U.S. economy but also have the potential to impact the Federal Reserve’s future interest rate policies.
Despite the mixed market performance, concerns about rising Treasury yields persist, with investors closely monitoring their impact. The 10-year Treasury yield has surged to 4.65%, significantly higher than the spring’s just-over-3% level. This relentless climb has raised worries about persistent inflation, even as the Federal Reserve attempts to raise short-term interest rates. The tech sector, in particular, has felt the brunt of this surge, with both the Nasdaq and S&P 500 still trading below their yearly peaks.
The rise in long-dated bond yields continues to weigh heavily on tech stocks, whose valuations depend on future earnings expectations. Additionally, there is a specter of unease looming over the market, as a lackluster demand for treasuries, notably from major players like Japan and China, could further drive interest rates higher, exerting more pressure on equity valuations.
Turning our attention to notable stock movements, Tesla posted a modest 0.6% increase despite falling short of Wall Street’s expectations. An encouraging development was Tesla’s introduction of an updated Model Y in China, which bolstered positive sentiment surrounding the company. In contrast, Rivian Automotive faced a dip in its stock price despite surpassing expectations.
Discover Financial Services emerged as the top performer in the S&P 500, surging by 4.8%. The credit card company reached a consent order with the Federal Deposit Insurance Corp. to enhance consumer compliance, notably without incurring any fines or penalties. Meanwhile, Nvidia received a significant endorsement from Goldman Sachs, maintaining a “Buy” rating and a target price of $605. In response, Nvidia’s stock saw a 3% increase, closing at $447.82.
Lastly, Apple witnessed a 1.5% increase in its stock price. This boost came after the tech giant announced plans to release an iOS 17 software update, specifically designed to address overheating issues reported with the newly launched iPhone 15.
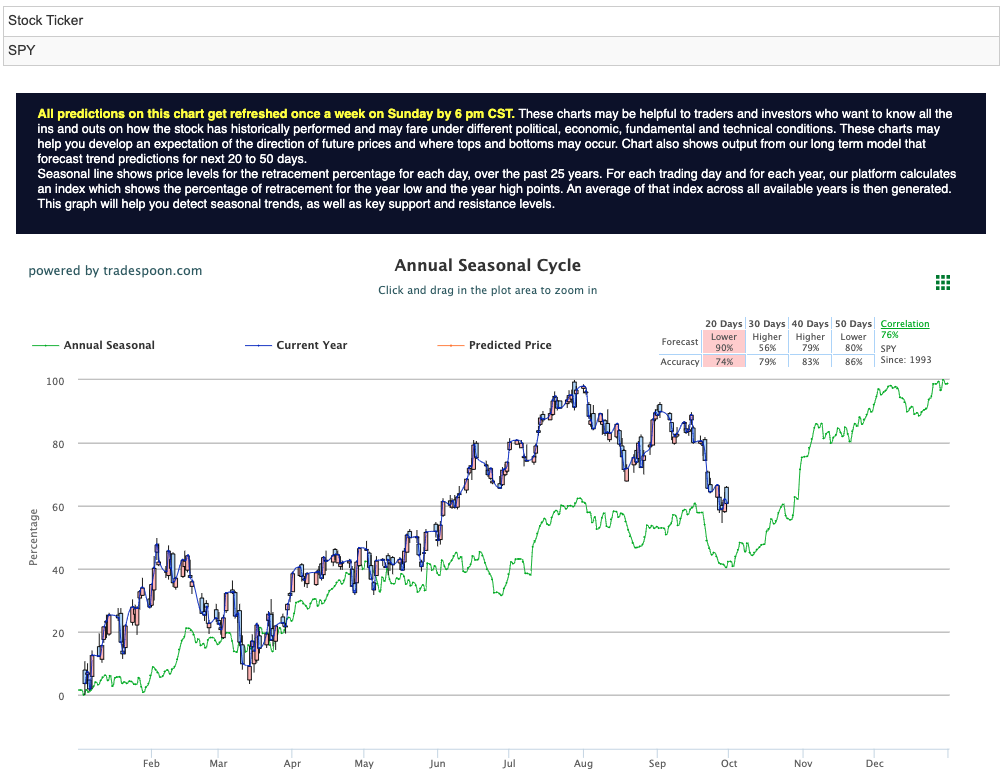
In light of the current market dynamics and encouraging economic data suggesting a low likelihood of a recession, a market-neutral stance may be wise. While the SPY rally could face resistance levels between $450 and $470, there is also a potential support zone spanning $400 to $430 over the next few months. For reference, the SPY Seasonal Chart is shown below:
In this ever-evolving financial landscape, investors should remain vigilant and stay informed about the unfolding economic trends, particularly as the Federal Reserve continues to signal an extended period of higher interest rates. Additionally, the looming possibility of a government shutdown adds an extra layer of risk to the equation, making it essential to closely follow upcoming economic data releases, including the September unemployment data and Services PMI data, which hold the keys to understanding future market developments.
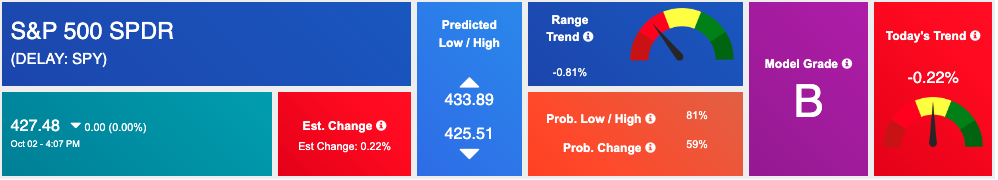
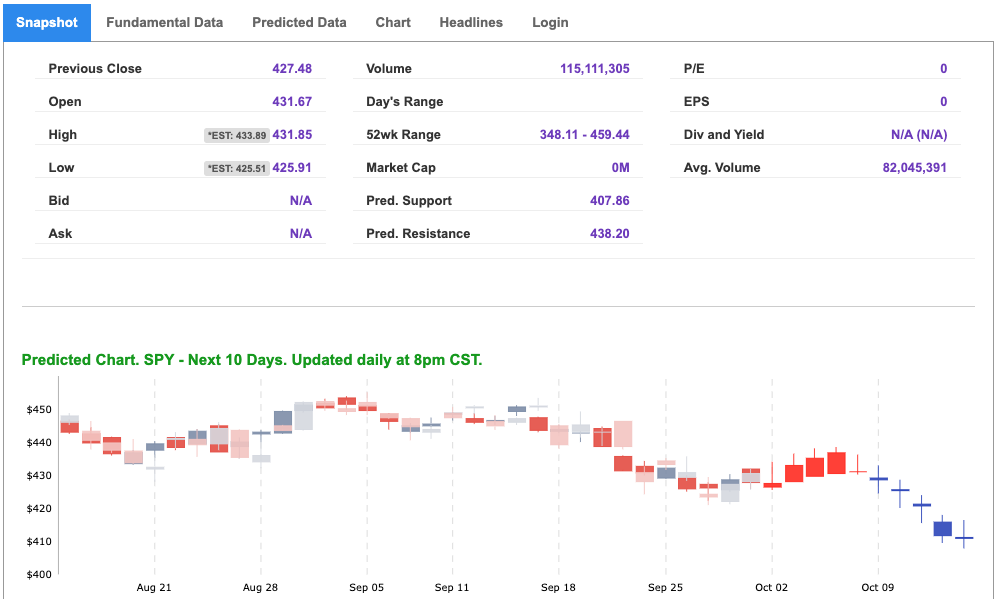
Using the “SPY” symbol to analyze the S&P 500 our 10-day prediction window shows a near-term positive outlook. Prediction data is uploaded after the market closes at 6 p.m. CST. Today’s data is based on market signals from the previous trading session.
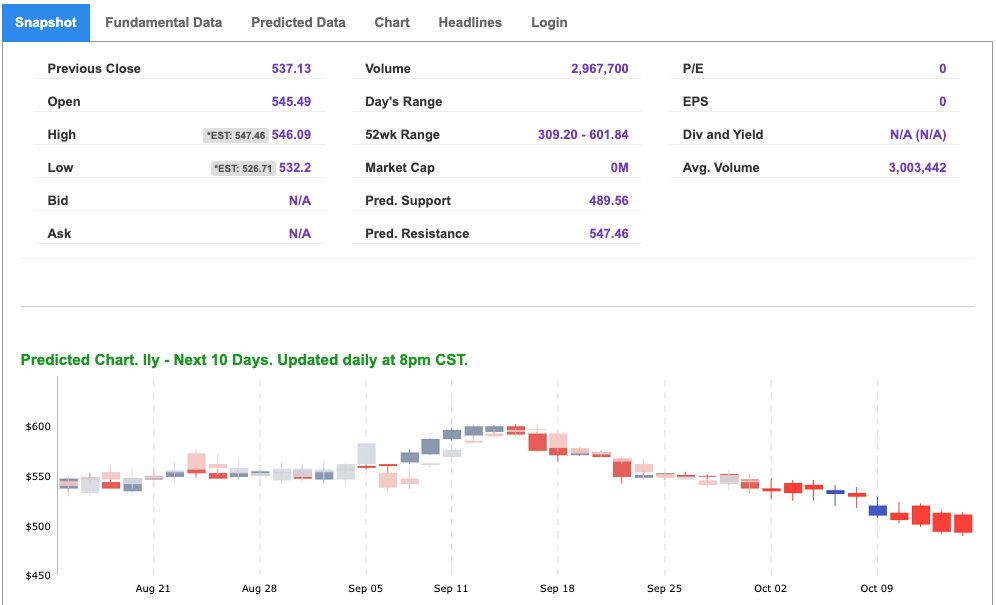
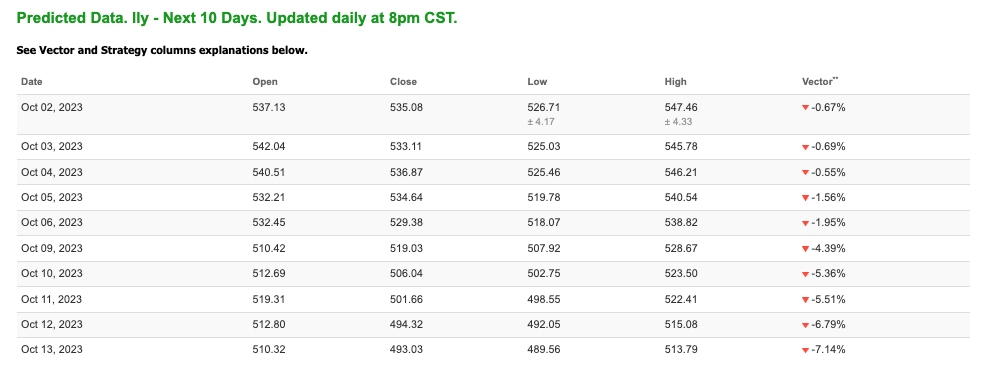
Note: The Vector column calculates the change of the Forecasted Average Price for the next trading session relative to the average of actual prices for the last trading session. The column shows the expected average price movement “Up or Down”, in percent. Trend traders should trade along the predicted direction of the Vector. The higher the value of the Vector the higher its momentum.
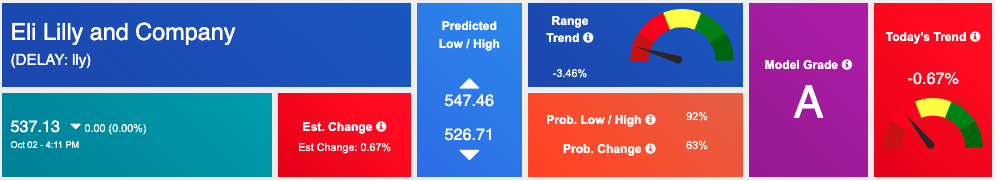
*Please note: At the time of publication Vlad Karpel does NOT have a position in the featured symbol, lly. Our featured symbol is part of your free subscription service. It is not included in any paid Tradespoon subscription service. Vlad Karpel only trades his money in paid subscription services. If you are a paid subscriber, please review your Premium Member Picks, ActiveTrader, or MonthlyTrader recommendations. If you are interested in receiving Vlad’s picks, please click here.
West Texas Intermediate for Crude Oil delivery (CL.1) is priced at $88.62 per barrel, down 2.39%, at the time of publication.

Looking at USO, a crude oil tracker, our 10-day prediction model shows mixed signals. The fund is trading at $80.86 at the time of publication. Prediction data is uploaded after the market close at 6 p.m., CST. Today’s data is based on market signals from the previous trading session.
The price for the Gold Continuous Contract (GC00) is down 1.18% at $1844.10 at the time of publication.
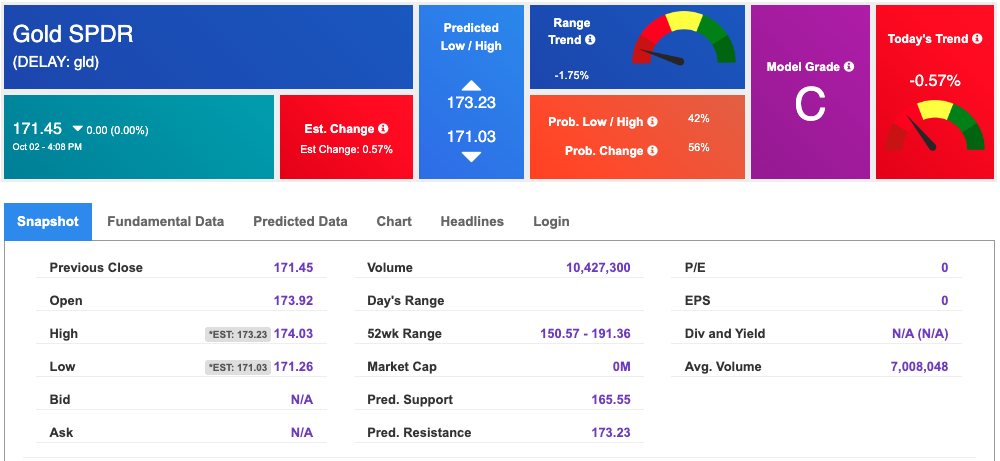
Using SPDR GOLD TRUST (GLD) as a tracker in our Stock Forecast Tool, the 10-day prediction window shows mixed signals. The gold proxy is trading at $171.45 at the time of publication. Vector signals show -0.57% for today. Prediction data is uploaded after the market close at 6 p.m., CST. Today’s data is based on market signals from the previous trading session.
The yield on the 10-year Treasury note is up at 4.687% at the time of publication.
The yield on the 30-year Treasury note is up at 4.796% at the time of publication.
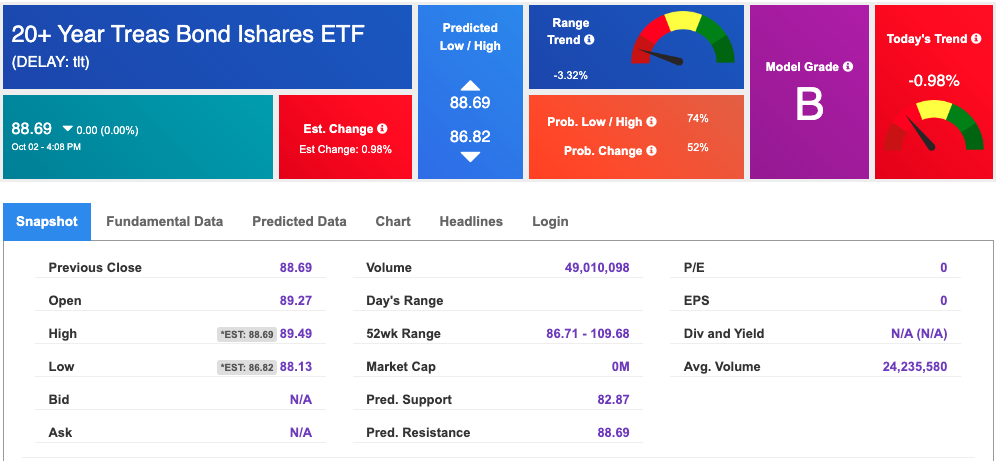
Using the iShares 20+ Year Treasury Bond ETF (TLT) as a proxy for bond prices in our Stock Forecast Tool, we see mixed signals in our 10-day prediction window. Prediction data is uploaded after the market close at 6 p.m., CST. Today’s data is based on market signals from the previous trading session.
The CBOE Volatility Index (^VIX) is priced at $17.61, up 0.51% at the time of publication, and our 10-day prediction window shows mixed signals. Prediction data is uploaded after the market close at 6 p.m., CST. Today’s data is based on market signals from the previous trading session.
Please share this Tradespoon Market Commentary with your friends.
![]()

![]()
Comments Off on


Tradespoon Tools make finding winning trades in minute as easy as 1-2-3.
Our simple 3 step approach has resulted in an average return of almost 20% per trade!

