 Are you a Long-Term Trader? Then take a look at our NEW RoboInvestor Service?
CLICK HERE TO LEARN MORE
Are you a Long-Term Trader? Then take a look at our NEW RoboInvestor Service?
CLICK HERE TO LEARN MORE
On Wednesday, U.S. equities soared after positive corporate earnings and solid economic data eased fears of a recession. All three major U.S. indices ended sharply higher as investors weighed earnings reports and better-than-expected economic data following a month of losses owing to international tensions sparked by Speaker Nancy Pelosi’s trip to Taiwan. The Nasdaq climbed as Moderna and PayPal’s strong earnings fueled investor optimism and caused both shares to rise impressively. Starbucks, Robinhood, and CVS also saw shares boosted by impressive quarterly earnings reports. Next week, earnings are due to continue but will lessen in significant big-name releases.
On the economic report’s front, the ISM business conditions index in July rose to a three-month high of 56.7 percent, suggesting the economy continues to grow in the face of adversity, according to data from the Institute for Supply Management (ISM). Also released today, U.S. factory orders increased 2 percent in June, surpassing forecasts. Elsewhere, oil futures continued to slip. In response to President Biden’s recent visit to Saudi Arabia, the Organization of Petroleum Exporting Countries (OPEC) and its allies agreed to raise oil production by a small amount — 100,000 barrels per day.
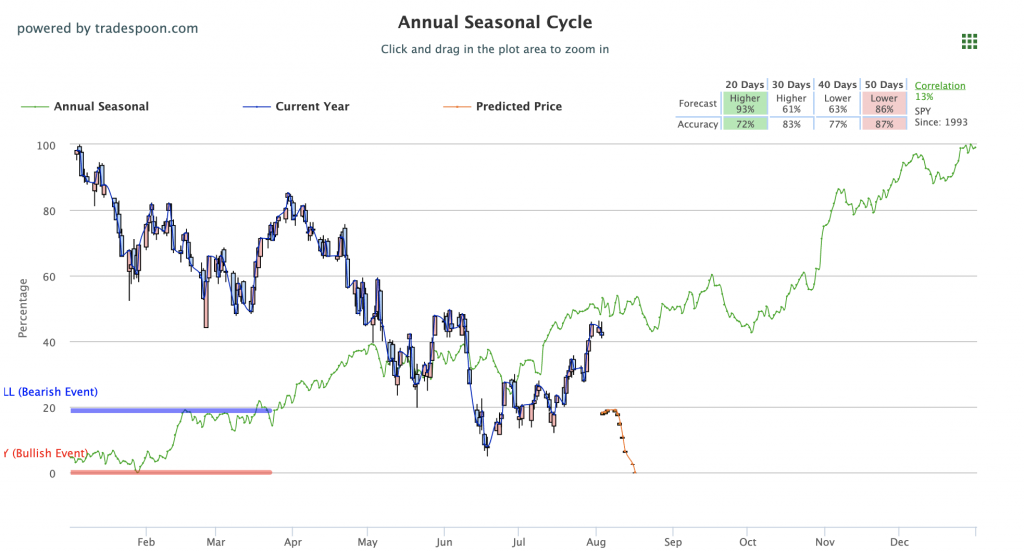
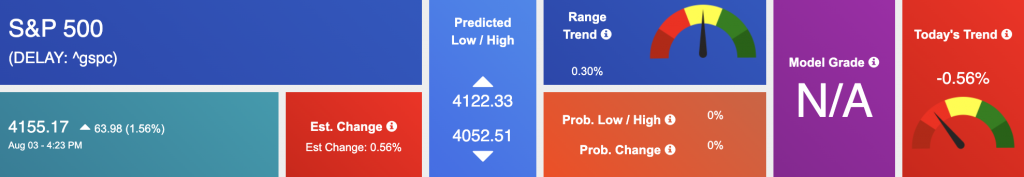
The next move in the market may be affected by marquee earnings, such as $EBAY, $COP, and $DDOG, and the July unemployment figures on Friday. We are watching the overhead resistance levels in the SPY, which are presently at $420 and then $430. The $SPY support is at $406 and then $401. We anticipate the market to continue its short-term rally for the next several weeks. We would be a seller into any further rallies, and we recommend subscribers not to chase the market at these prices. Globally, Asian markets traded with mixed results while European markets advanced. We encourage all market commentary readers to maintain clearly defined stop levels for all positions. For reference, the SPY Seasonal Chart is shown below:
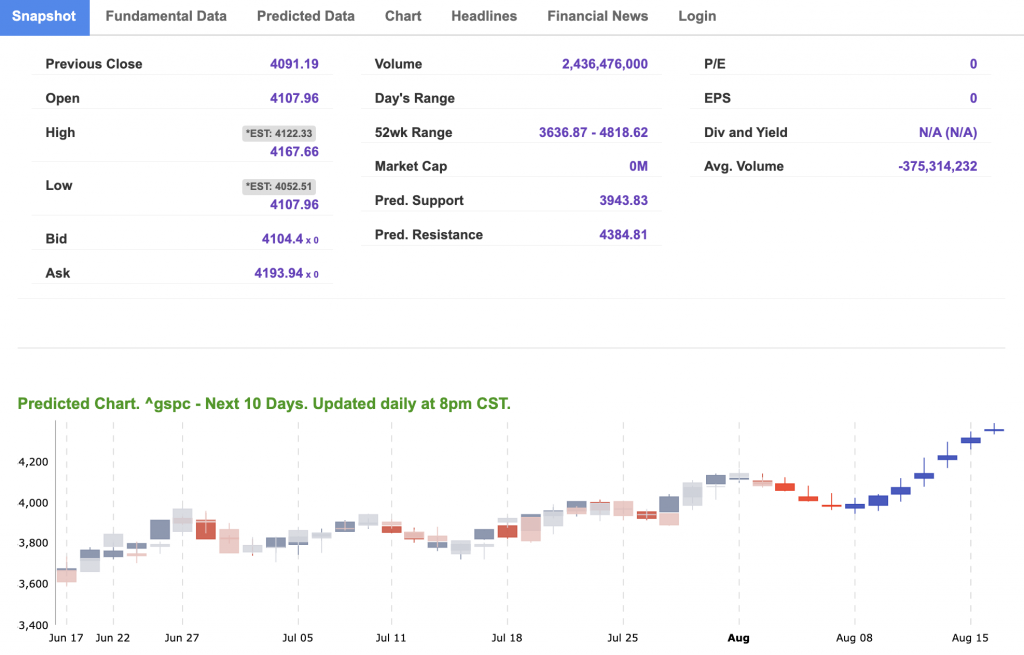
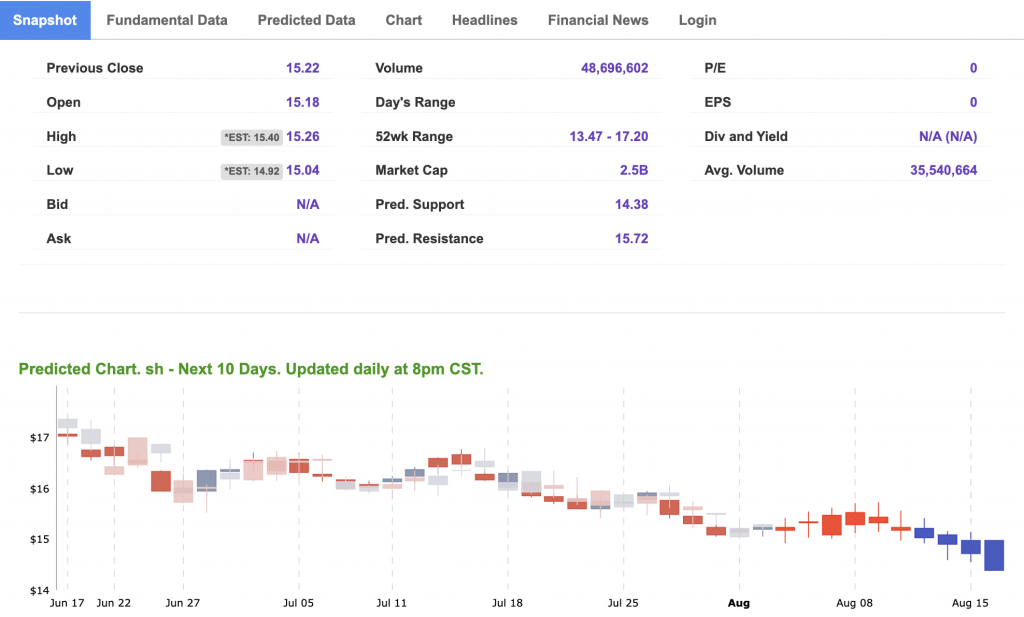
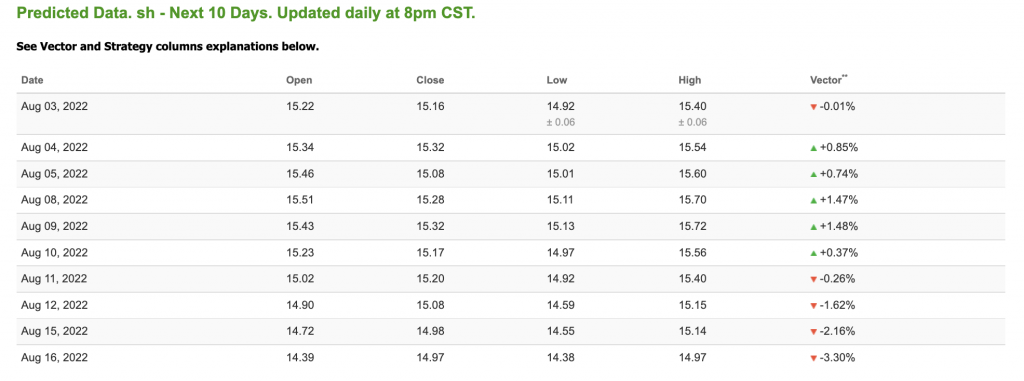
Note: The Vector column calculates the change of the Forecasted Average Price for the next trading session relative to the average of actual prices for the last trading session. The column shows the expected average price movement “Up or Down”, in percent. Trend traders should trade along the predicted direction of the Vector. The higher the value of the Vector the higher its momentum.
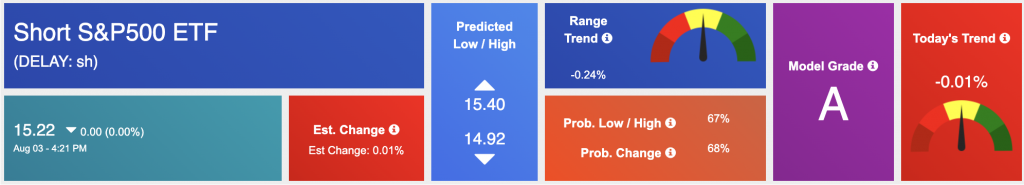
*Please note: At the time of publication Vlad Karpel does have a position in the featured symbol, SH. Our featured symbol is part of your free subscription service. It is not included in any paid Tradespoon subscription service. Vlad Karpel only trades his money in paid subscription services. If you are a paid subscriber, please review your Premium Member Picks, ActiveTrader, or MonthlyTrader recommendations. If you are interested in receiving Vlad’s picks, please click here.
West Texas Intermediate for Crude Oil delivery (CL.1) is priced at $90.92 per barrel, down 3.71%, at the time of publication.
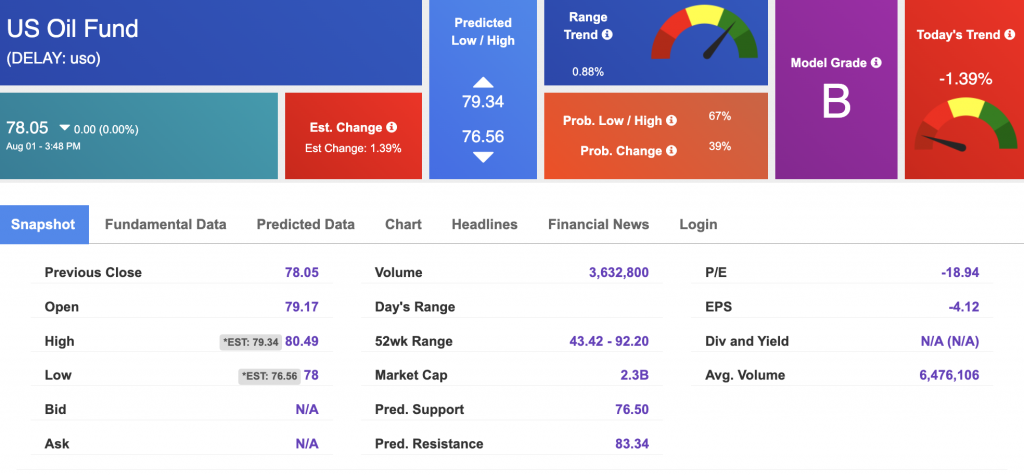
Looking at USO, a crude oil tracker, our 10-day prediction model shows mixed signals. The fund is trading at $78.05 at the time of publication. Prediction data is uploaded after the market close at 6 p.m., CST. Today’s data is based on market signals from the previous trading session.
The price for the Gold Continuous Contract (GC00) is down 0.42% at $1782.10 at the time of publication.
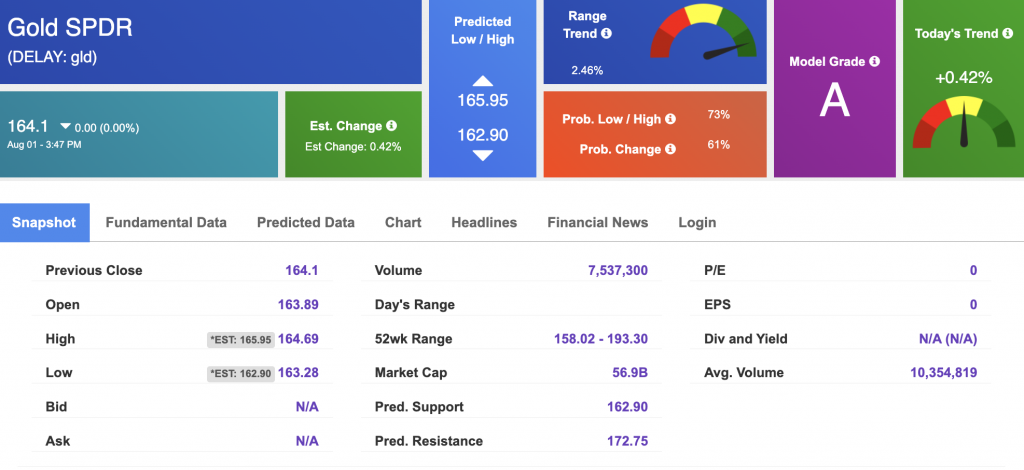
Using SPDR GOLD TRUST (GLD) as a tracker in our Stock Forecast Tool, the 10-day prediction window shows mixed signals. The gold proxy is trading at $164.1 at the time of publication. Vector signals show +0.42% for today. Prediction data is uploaded after the market close at 6 p.m., CST. Today’s data is based on market signals from the previous trading session.
The yield on the 10-year Treasury note is down, at 2.706% at the time of publication.
The yield on the 30-year Treasury note is down, at 2.947% at the time of publication.
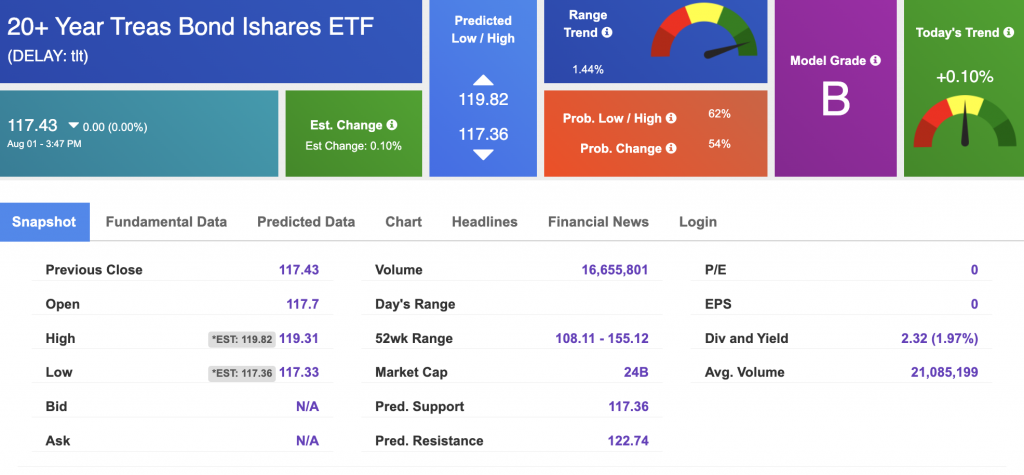
Using the iShares 20+ Year Treasury Bond ETF (TLT) as a proxy for bond prices in our Stock Forecast Tool, we see mixed signals in our 10-day prediction window. Prediction data is uploaded after the market close at 6 p.m., CST. Today’s data is based on market signals from the previous trading session.
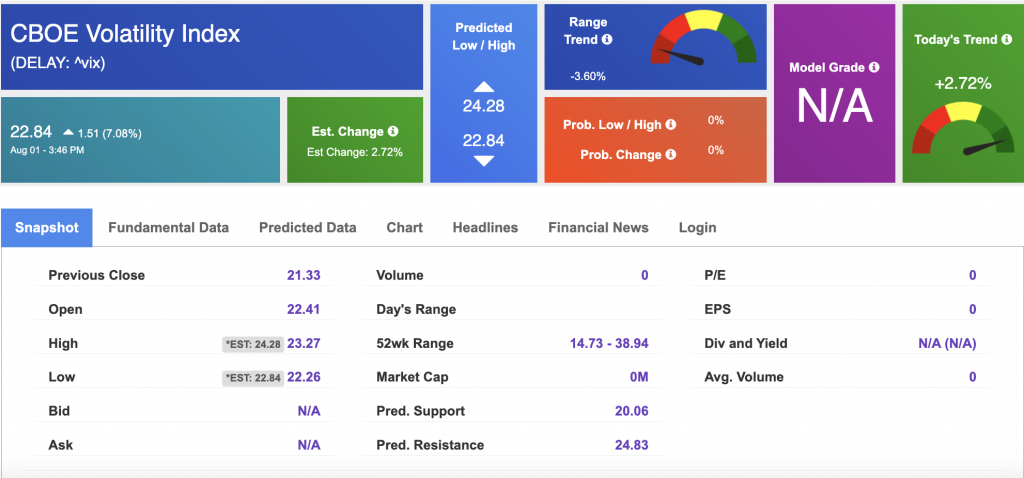
The CBOE Volatility Index (^VIX) is $22.84 at the time of publication, and our 10-day prediction window shows mixed signals. Prediction data is uploaded after the market close at 6 p.m., CST. Today’s data is based on market signals from the previous trading session.
Please share this Tradespoon Market Commentary with your friends.
![]()

![]()
Comments Off on


Tradespoon Tools make finding winning trades in minute as easy as 1-2-3.
Our simple 3 step approach has resulted in an average return of almost 20% per trade!

