 Are you a Long-Term Trader? Then take a look at our NEW RoboInvestor Service?
CLICK HERE TO LEARN MORE
Are you a Long-Term Trader? Then take a look at our NEW RoboInvestor Service?
CLICK HERE TO LEARN MORE
After losing their opening gains, all three major U.S. indices closed in the red today, with the Nasdaq leading the way- down 0.93%. Last week, U.S. indices were able to snap a multi-week losing streak and book solid gains. Early gains began to drop as data revealed that US durable-goods orders increased by 0.7% in May, versus forecasts for a 0.2 percent raise, and pending home sales rebounded last month, reversing a six-month decline. Further fueling investors’ recession and inflation concerns. On Tuesday, look out for Consumer Confidence Index report while Wednesday will feature Q1 GDP data. Key monthly inflation data is set for Thursday and Friday we will see manufacturing and construction reports. Several retail earnings are set to release this week, including Nike today, Bed Bath & Beyond and General Mills on Wednesday, and Micron Technology on Thursday.
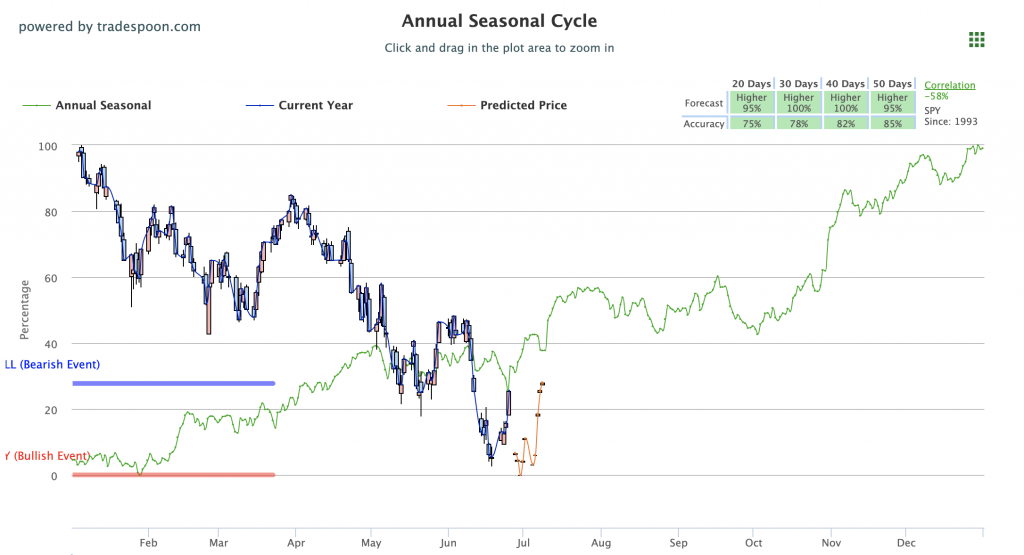
The $VIX is trading near the 30-level and we are watching the $MU, $NKE, and $WBA earnings this week, as well as PCE data on Thursday, that can influence the next move in the market. We are also monitoring the overhead resistance levels in the SPY, which are presently at $396 and then $409. The $SPY support is at $380 and then $362. We expect the market to continue the short-term rally this week. In geopolitical global news, the Group of Seven economic powers met in Germany to reaffirm their long-term commitment to Ukraine and discuss the prospect of a price cap on Russian oil. Globally, Asian markets closed in the green while European markets finished with mixed results. We encourage all market commentary readers to maintain clearly defined stop levels for all positions. For reference, the SPY Seasonal Chart is shown below:
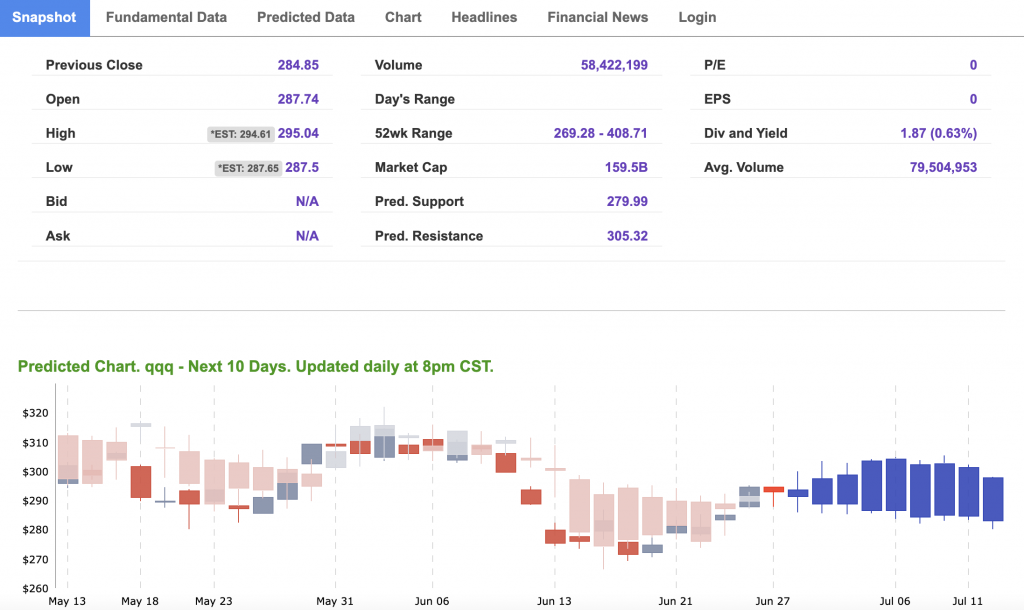
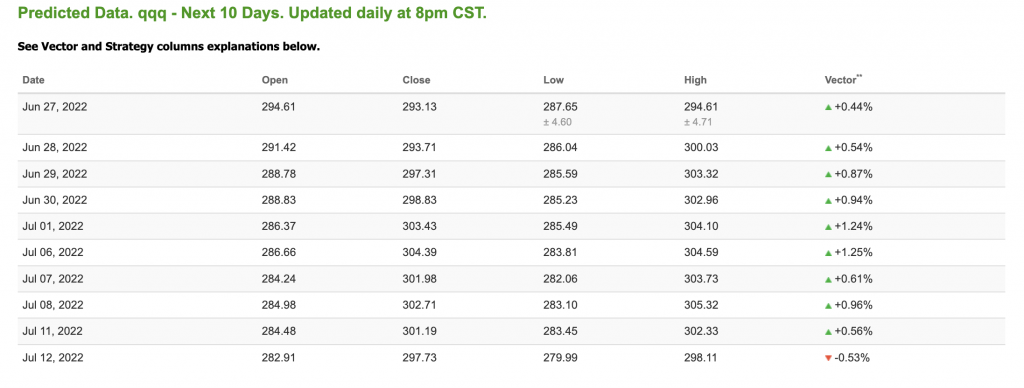
Note: The Vector column calculates the change of the Forecasted Average Price for the next trading session relative to the average of actual prices for the last trading session. The column shows the expected average price movement “Up or Down”, in percent. Trend traders should trade along the predicted direction of the Vector. The higher the value of the Vector the higher its momentum.
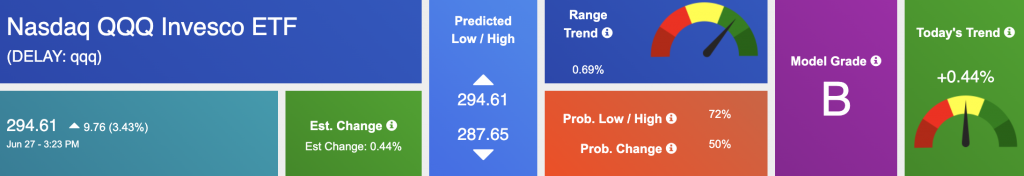
*Please note: At the time of publication Vlad Karpel does have a position in the featured symbol, QQQ. Our featured symbol is part of your free subscription service. It is not included in any paid Tradespoon subscription service. Vlad Karpel only trades his money in paid subscription services. If you are a paid subscriber, please review your Premium Member Picks, ActiveTrader, or MonthlyTrader recommendations. If you are interested in receiving Vlad’s picks, please click here.
West Texas Intermediate for Crude Oil delivery (CL.1) is priced at $115.83 per barrel, down 2.61%, at the time of publication.
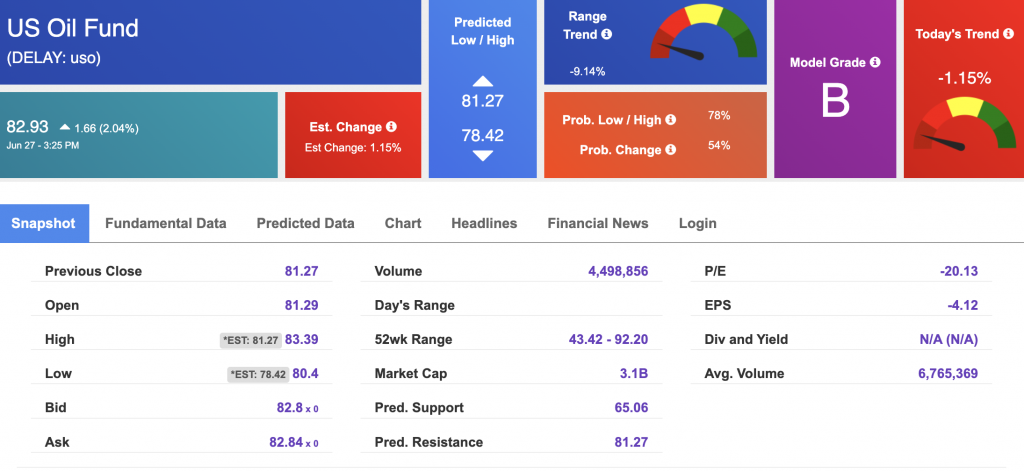
Looking at USO, a crude oil tracker, our 10-day prediction model shows mixed signals. The fund is trading at $82.93 at the time of publication. Prediction data is uploaded after the market close at 6 p.m., CST. Today’s data is based on market signals from the previous trading session.
The price for the Gold Continuous Contract (GC00) is up 1.25% at $1836.10 at the time of publication.
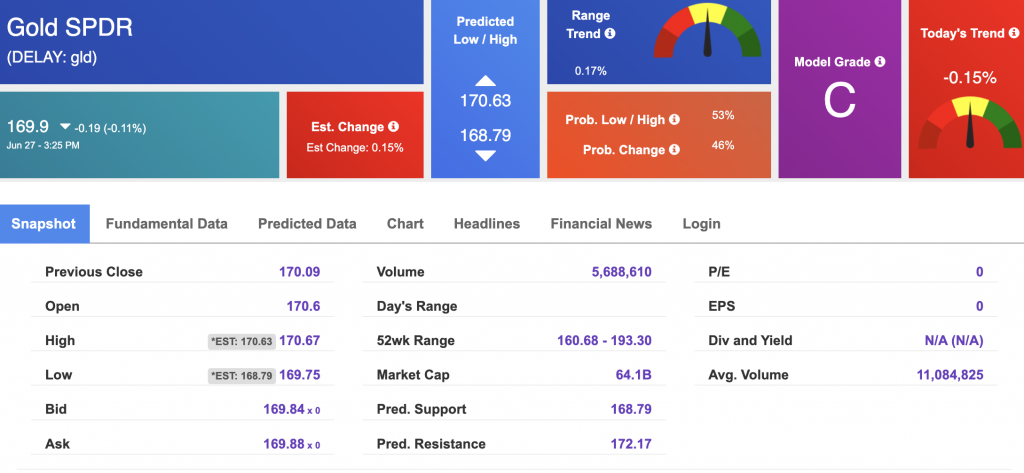
Using SPDR GOLD TRUST (GLD) as a tracker in our Stock Forecast Tool, the 10-day prediction window shows mixed signals. The gold proxy is trading at $169.9 at the time of publication. Vector signals show -0.15% for today. Prediction data is uploaded after the market close at 6 p.m., CST. Today’s data is based on market signals from the previous trading session.
The yield on the 10-year Treasury note is up, at 3.208% at the time of publication.
The yield on the 30-year Treasury note is up, at 3.318% at the time of publication.
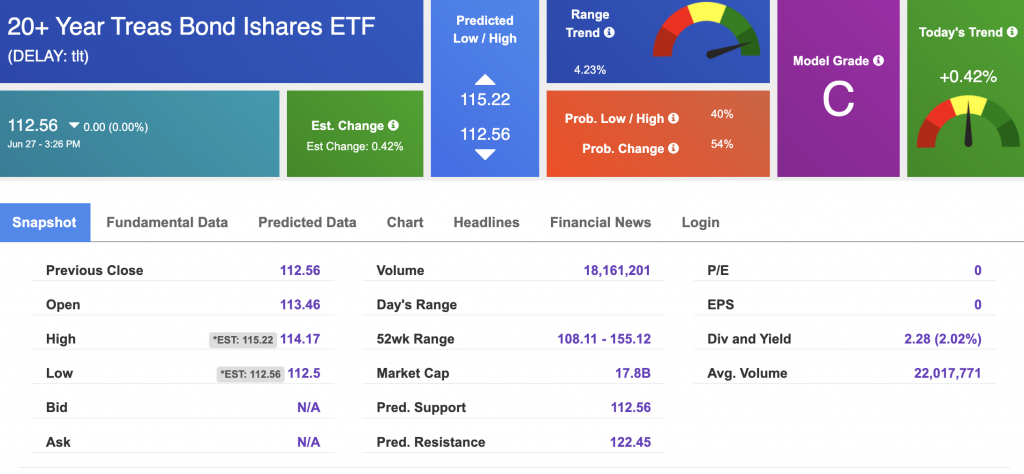
Using the iShares 20+ Year Treasury Bond ETF (TLT) as a proxy for bond prices in our Stock Forecast Tool, we see mixed signals in our 10-day prediction window. Prediction data is uploaded after the market close at 6 p.m., CST. Today’s data is based on market signals from the previous trading session.
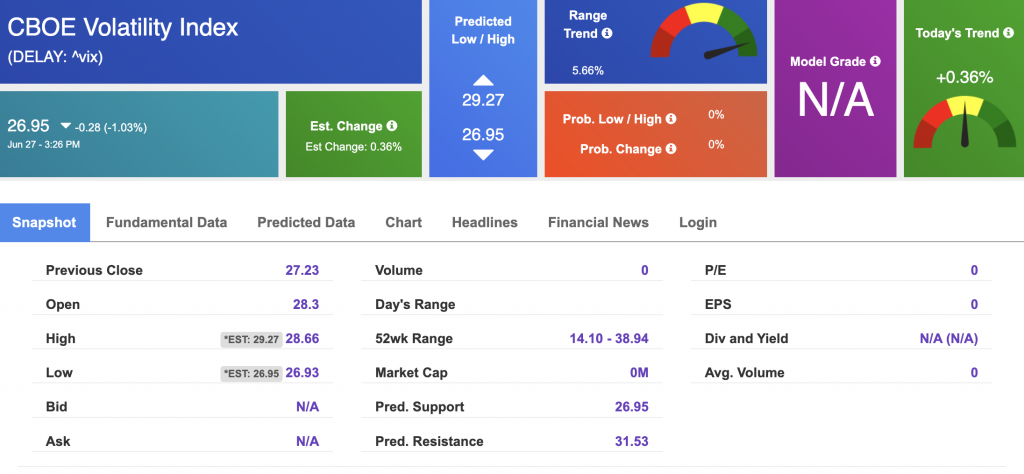
The CBOE Volatility Index (^VIX) is $26.95 at the time of publication, and our 10-day prediction window shows mixed signals. Prediction data is uploaded after the market close at 6 p.m., CST. Today’s data is based on market signals from the previous trading session.
Please share this Tradespoon Market Commentary with your friends.
![]()

![]()
Comments Off on


Tradespoon Tools make finding winning trades in minute as easy as 1-2-3.
Our simple 3 step approach has resulted in an average return of almost 20% per trade!

