 Sign Up for One-on-One Coaching and get our Premium Membership FREE for 1 Year!
CLICK HERE TO APPLY
Sign Up for One-on-One Coaching and get our Premium Membership FREE for 1 Year!
CLICK HERE TO APPLY
To kick off a week filled with inflation and central bank news, U.S. Indices are trading higher as investors remain optimistic in their outlooks. After its short-lived dip the previous week, U.S. stocks ended with a powerful surge on Monday in anticipation of upcoming inflation data and Federal Reserve decisions that could shape financial trends for next year. This Tuesday marks the release of November’s U.S. consumer price data, and the following day will see The Fed announcing their interest-rate decision to be a 50 basis point increase in rates from 4.25% to 4.50%. This snaps the streak that occurred from June through November’s consecutive oversized 75 basis point hikes. Make sure to keep an eye out for these significant changes this week that could have a major impact on the market landscape. Also, this week will be the European Central Bank and Bank of England decision, both scheduled to release their interest rate announcements on Thursday. Additionally, just one day prior to this event UK inflation levels will be released—currently standing at 11.1% year-over-year.
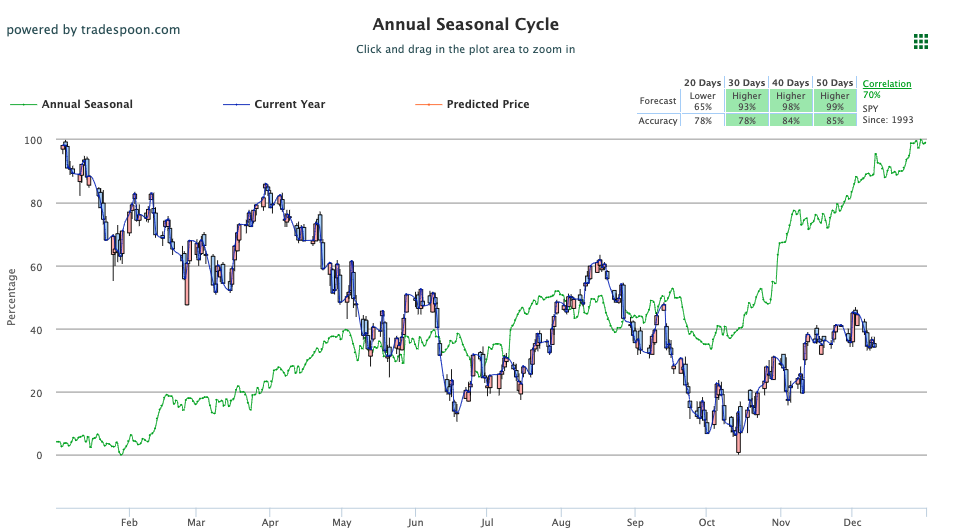
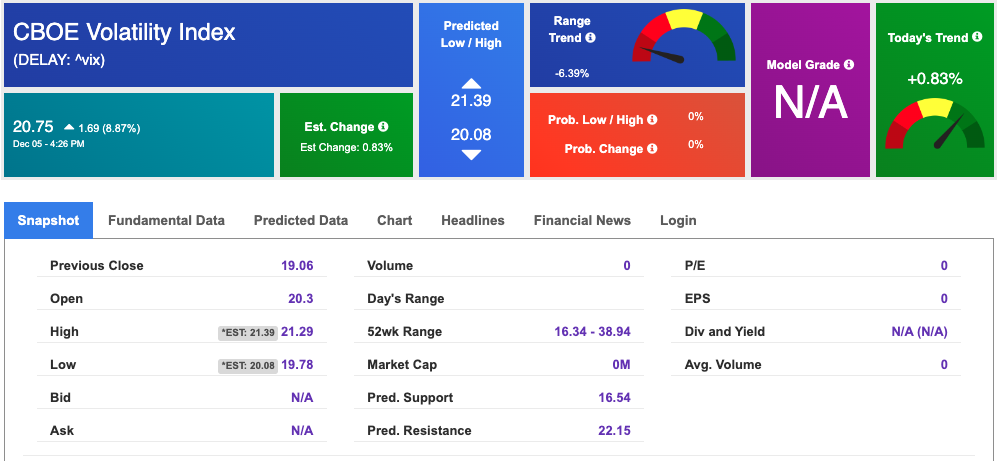
As $VIX trades close to the $22 mark, it is essential to keep an eye on the SPY’s overhead resistance levels of $400 and then subsequently at $410. Simultaneously, we must also be aware of its support located at around $390 and lower down at a possible stop-loss price point of$385. The $ORCL, $ADBE, and $COUP earnings this week – as well as CPI data and Fed decision- can influence the next move in the market. We expect the market to continue building a market top for the next 2-4 weeks. The short-term market is trading in the well-defined range. He would be market neutral at this time and encourages subscribers not to chase the market to the downside or upside. Globally, Asian and European markets closed in the red. Market commentary readers should maintain clearly defined stop levels for all positions. For reference, the SPY Seasonal Chart is shown below:
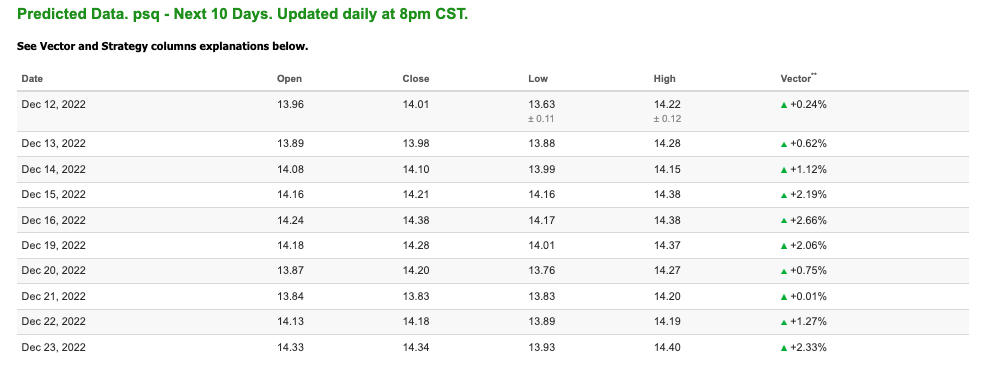
Note: The Vector column calculates the change of the Forecasted Average Price for the next trading session relative to the average of actual prices for the last trading session. The column shows the expected average price movement “Up or Down”, in percent. Trend traders should trade along the predicted direction of the Vector. The higher the value of the Vector the higher its momentum.
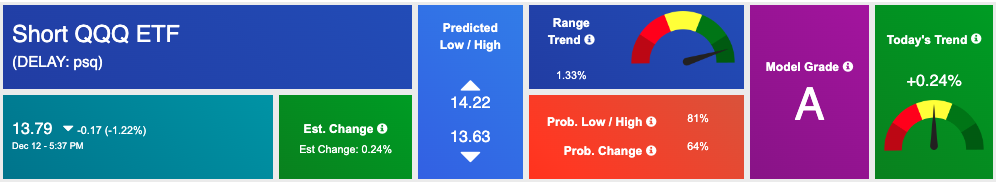
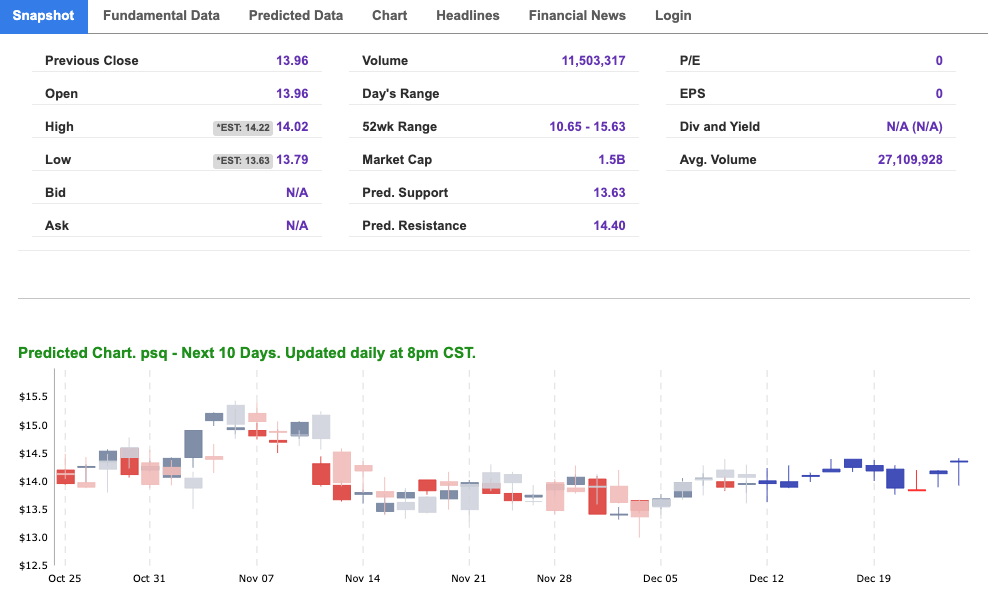
*Please note: At the time of publication Vlad Karpel does have a position in the featured symbol, PSQ. Our featured symbol is part of your free subscription service. It is not included in any paid Tradespoon subscription service. Vlad Karpel only trades his money in paid subscription services. If you are a paid subscriber, please review your Premium Member Picks, ActiveTrader, or MonthlyTrader recommendations. If you are interested in receiving Vlad’s picks, please click here.
West Texas Intermediate for Crude Oil delivery (CL.1) is priced at $73.43 per barrel, up 0.36%, at the time of publication.

Looking at USO, a crude oil tracker, our 10-day prediction model shows mixed signals. The fund is trading at $69.84 at the time of publication. Prediction data is uploaded after the market close at 6 p.m., CST. Today’s data is based on market signals from the previous trading session.
The price for the Gold Continuous Contract (GC00) is flat at $1792.30 at the time of publication.
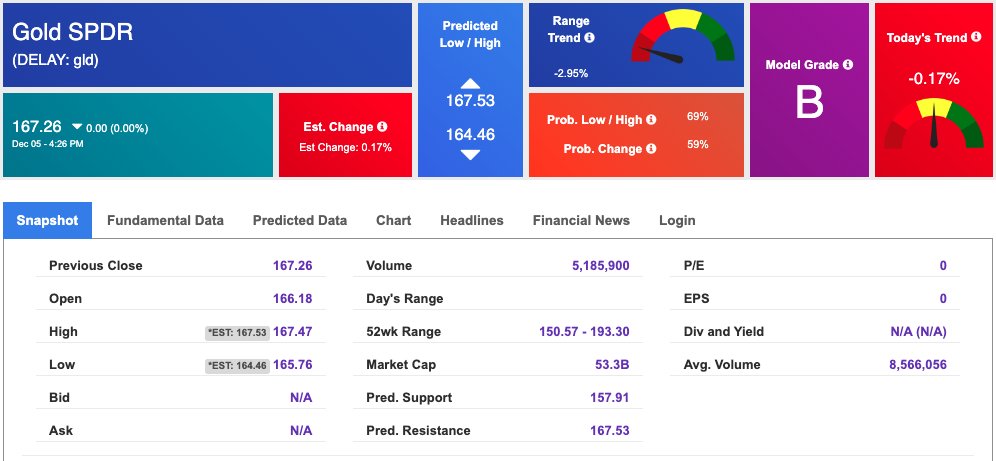
Using SPDR GOLD TRUST (GLD) as a tracker in our Stock Forecast Tool, the 10-day prediction window shows mixed signals. The gold proxy is trading at $167.26 at the time of publication. Vector signals show -0.17% for today. Prediction data is uploaded after the market close at 6 p.m., CST. Today’s data is based on market signals from the previous trading session.
The yield on the 10-year Treasury note is up at 3.615% at the time of publication.
The yield on the 30-year Treasury note is up at 3.576% at the time of publication.
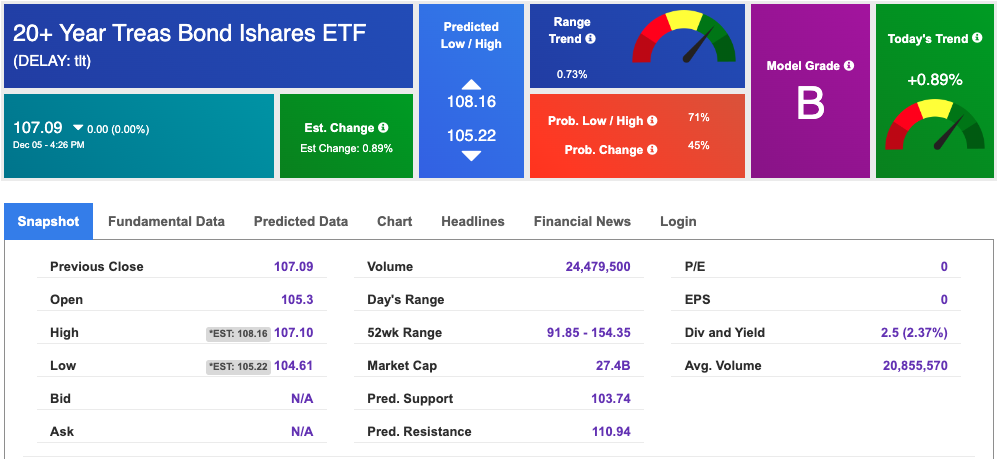
Using the iShares 20+ Year Treasury Bond ETF (TLT) as a proxy for bond prices in our Stock Forecast Tool, we see mixed signals in our 10-day prediction window. Prediction data is uploaded after the market close at 6 p.m., CST. Today’s data is based on market signals from the previous trading session.
The CBOE Volatility Index (^VIX) is $20.75 at the time of publication, and our 10-day prediction window shows mixed signals. Prediction data is uploaded after the market close at 6 p.m., CST. Today’s data is based on market signals from the previous trading session.
Please share this Tradespoon Market Commentary with your friends.
![]()

![]()
Comments Off on


Tradespoon Tools make finding winning trades in minute as easy as 1-2-3.
Our simple 3 step approach has resulted in an average return of almost 20% per trade!

