 Sign Up for One-on-One Coaching and get our Premium Membership FREE for 1 Year!
CLICK HERE TO APPLY
Sign Up for One-on-One Coaching and get our Premium Membership FREE for 1 Year!
CLICK HERE TO APPLY
Stocks fell in the U.S., with traders assessing China’s new COVID-19 subvariant and anticipating another inflation reading from the United States in just two days. All three major U.S. indices closed in the red with the Nasdaq seeing the biggest drop. Today’s drop follows last week’s strong rally which was capped, and added additional support, at the end of the week by a better than expected labor reports. Focus now shifts to this week’s CPI and earnings data, as well as any geopolitical news. Wednesday we will see key consumer price index data for the month of June while Thursday will feature the first batch of big-cap earnings with major banks starting to release Q2 data. Just recently, China imposed strict restrictions in several cities following reporting of a new omicron variant, causing investor sentiment to sour as this flare-up of COVID-19 in China added to worries and pressure on the global economy.
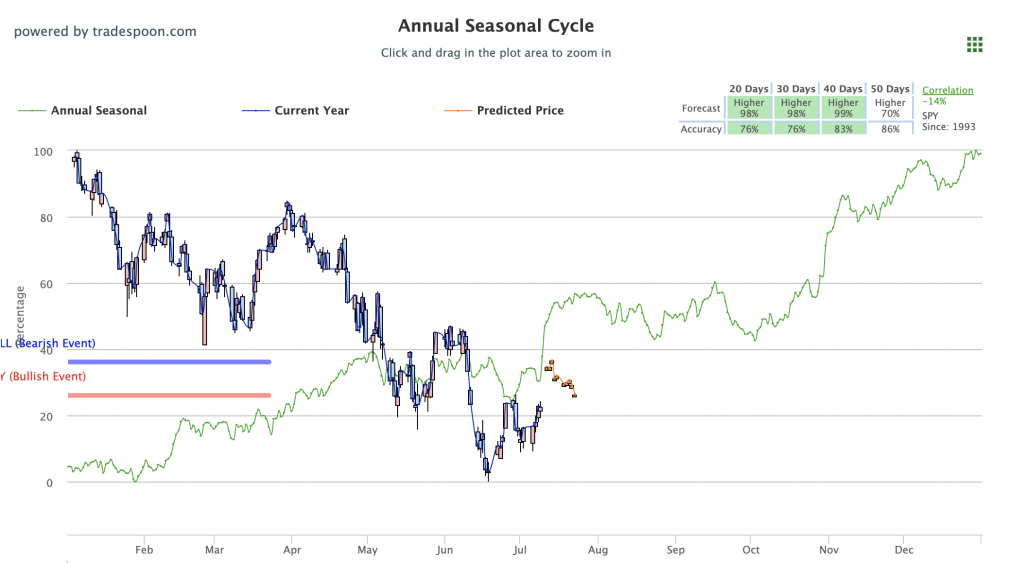
Following last week’s rally, the $VIX spiked to open the week but has since lowered, trading near $26. Q2 earnings take center stage with $JPM, $DAL, and $PEP earnings, as well as CPI data, which can influence the next move in the market. We are watching the overhead resistance levels in the SPY, which are presently at $396 and then $409. The $SPY support is at $380 and then $362. We expect the market to continue the short-term rally for the next couple of weeks. Globally, both European and Asian markets traded with mixed results. We encourage all market commentary readers to maintain clearly defined stop levels for all positions. For reference, the SPY Seasonal Chart is shown below:
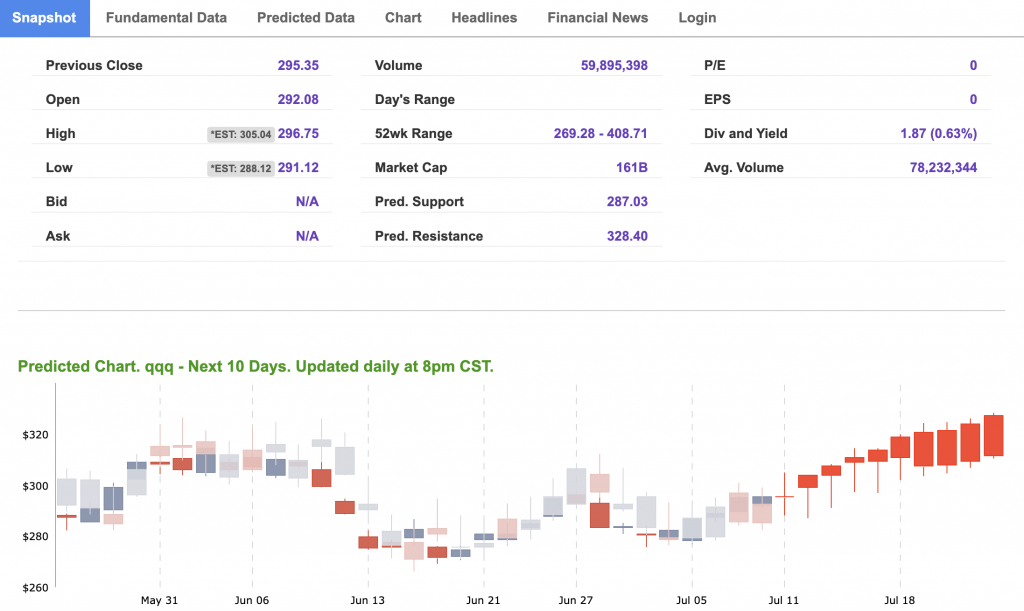
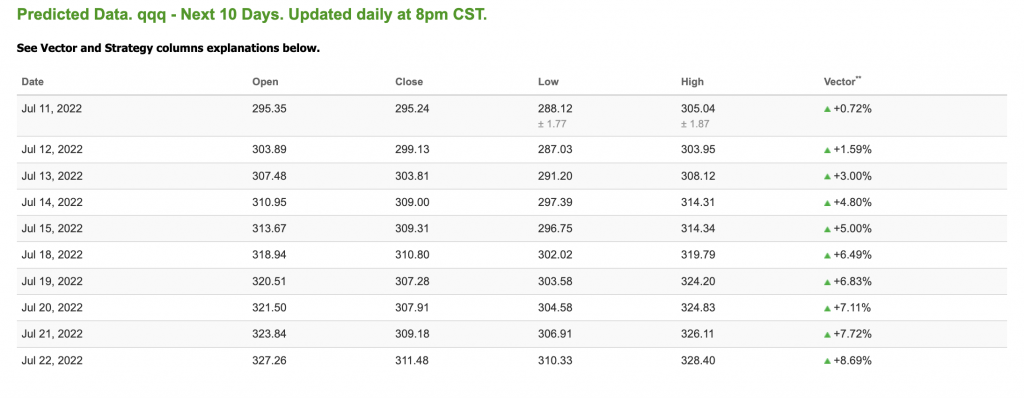
Note: The Vector column calculates the change of the Forecasted Average Price for the next trading session relative to the average of actual prices for the last trading session. The column shows the expected average price movement “Up or Down”, in percent. Trend traders should trade along the predicted direction of the Vector. The higher the value of the Vector the higher its momentum.
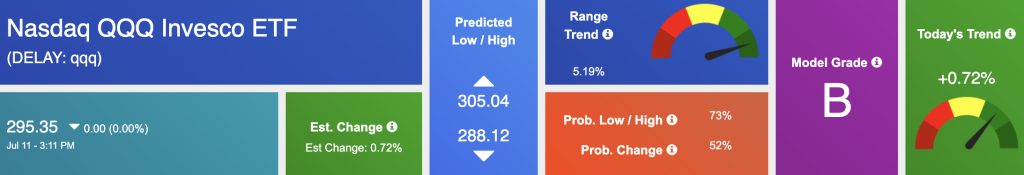
*Please note: At the time of publication Vlad Karpel does have a position in the featured symbol, QQQ. Our featured symbol is part of your free subscription service. It is not included in any paid Tradespoon subscription service. Vlad Karpel only trades his money in paid subscription services. If you are a paid subscriber, please review your Premium Member Picks, ActiveTrader, or MonthlyTrader recommendations. If you are interested in receiving Vlad’s picks, please click here.
West Texas Intermediate for Crude Oil delivery (CL.1) is priced at $103.49 per barrel, down 1.24%, at the time of publication.
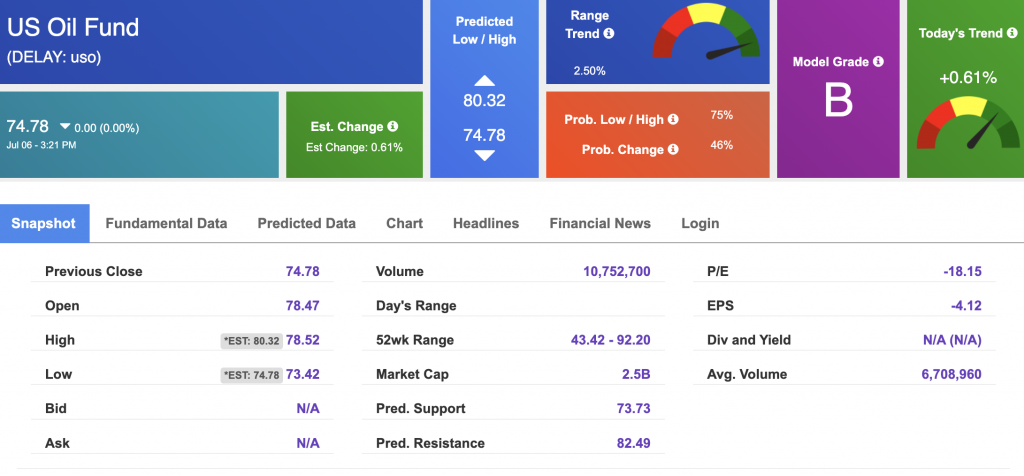
Looking at USO, a crude oil tracker, our 10-day prediction model shows mixed signals. The fund is trading at $74.78 at the time of publication. Prediction data is uploaded after the market close at 6 p.m., CST. Today’s data is based on market signals from the previous trading session.
The price for the Gold Continuous Contract (GC00) is down 0.63% at $1731.30 at the time of publication.
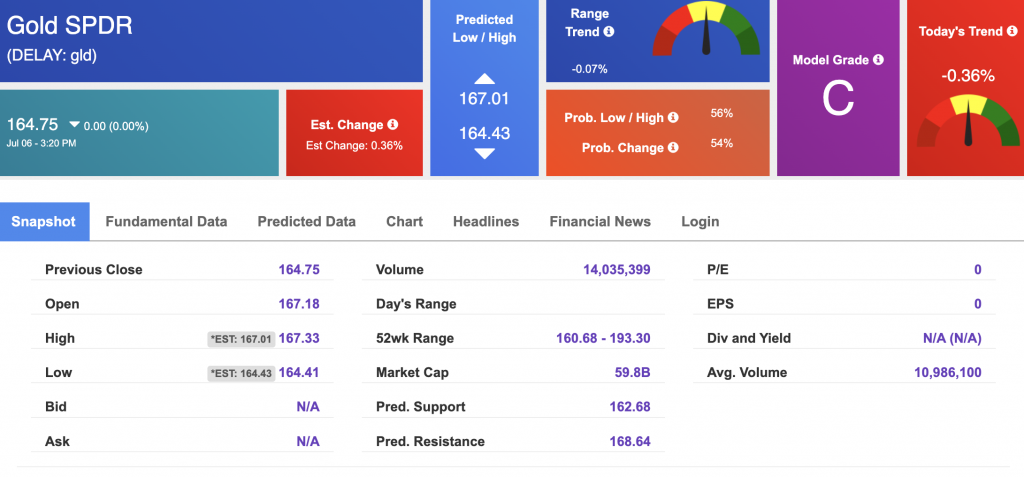
Using SPDR GOLD TRUST (GLD) as a tracker in our Stock Forecast Tool, the 10-day prediction window shows mixed signals. The gold proxy is trading at $164.75 at the time of publication. Vector signals show -0.36% for today. Prediction data is uploaded after the market close at 6 p.m., CST. Today’s data is based on market signals from the previous trading session.
The yield on the 10-year Treasury note is down, at 2.991% at the time of publication.
The yield on the 30-year Treasury note is down, at 3.174% at the time of publication.
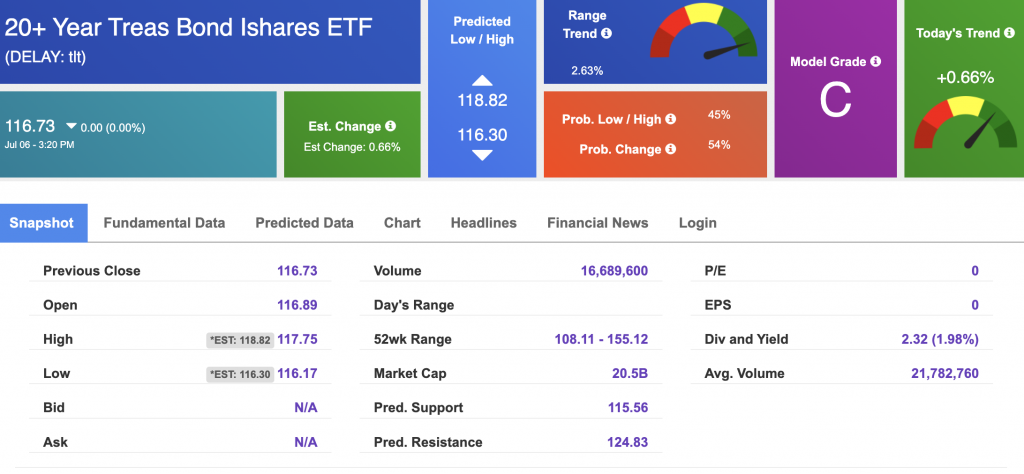
Using the iShares 20+ Year Treasury Bond ETF (TLT) as a proxy for bond prices in our Stock Forecast Tool, we see mixed signals in our 10-day prediction window. Prediction data is uploaded after the market close at 6 p.m., CST. Today’s data is based on market signals from the previous trading session.
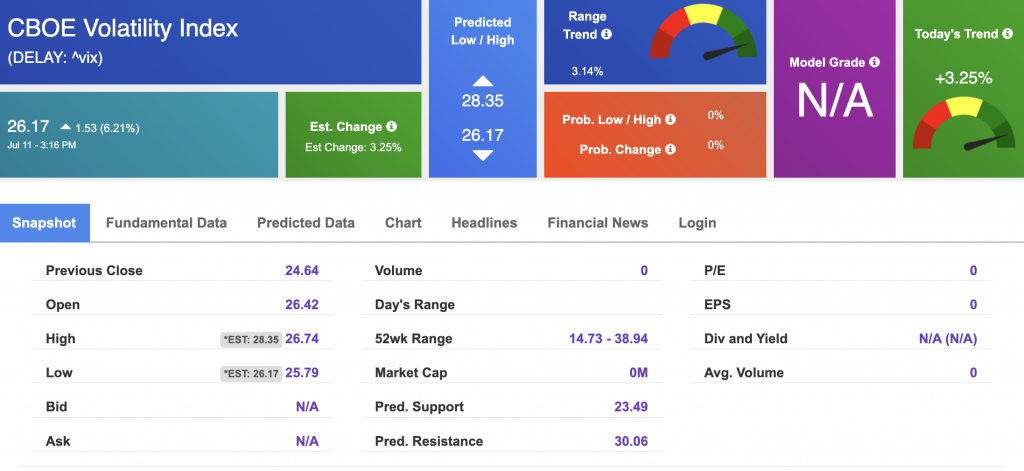
The CBOE Volatility Index (^VIX) is $26.17 at the time of publication, and our 10-day prediction window shows mixed signals. Prediction data is uploaded after the market close at 6 p.m., CST. Today’s data is based on market signals from the previous trading session.
Please share this Tradespoon Market Commentary with your friends.
![]()

![]()
Comments Off on


Tradespoon Tools make finding winning trades in minute as easy as 1-2-3.
Our simple 3 step approach has resulted in an average return of almost 20% per trade!

