 Special Offer: Try the 'Elite Trading Circle Membership' for ONLY $37!
CLICK HERE TO LEARN MORE
Special Offer: Try the 'Elite Trading Circle Membership' for ONLY $37!
CLICK HERE TO LEARN MORE
Markets are starting the week near all-time highs, but the leadership beneath the surface is shifting. The VIX remains contained near 16, which shows investors are not pricing in panic, but the market is becoming more selective as oil, inflation, interest rates, tariffs, earnings, and the war in Iran continue to shape sentiment.
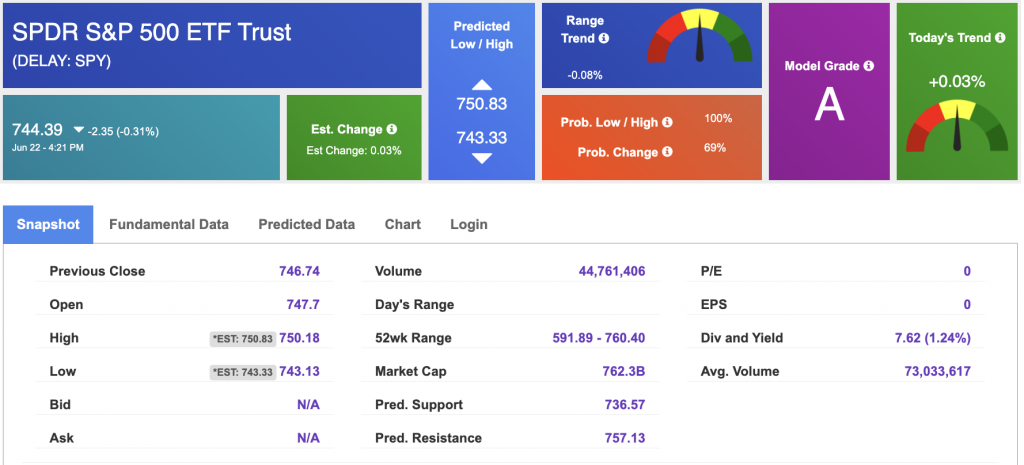
I remain in the market-bullish camp. The long-term trend is still intact, and SPY remains capable of reaching the $760–$780 range over the next few months. At the same time, short-term support sits closer to the $700–$720 area, and investors should recognize that this is still a headline-sensitive market. The rally can continue, but it needs lower oil, stable inflation, resilient earnings, and a Fed that does not become more aggressive.
The biggest positive catalyst remains progress toward a U.S.–Iran agreement. Oil prices moved lower toward the $75–$76 range after Qatar and Pakistan confirmed a 60-day roadmap toward a final U.S.–Iran deal. Markets are treating this as a potential supply-boosting event, especially if the Strait of Hormuz remains open for oil flows and the worst-case energy shock stays off the table.
That matters because oil is one of the most important macro variables for the market right now. When crude prices rise sharply, inflation fears return, the Fed has less room to ease, and consumers face another pressure point. But when oil falls, inflation expectations can ease, energy-sensitive sectors get relief, and risk appetite improves. Energy stocks may come under pressure from lower crude prices, but the broader market benefits if falling oil reduces the threat of another inflation spike.
The market does not need perfect geopolitical peace to keep moving higher. It does need the conflict in Iran to avoid disrupting global oil flows. As long as investors believe the U.S.–Iran deal process is moving forward, the geopolitical risk premium should continue to ease. But this remains a fragile setup. Any breakdown in negotiations, renewed escalation, or threat to the Strait of Hormuz could quickly bring volatility back into the market.
The second major story is rotation. Big Tech weakened today, with Alphabet, Amazon, and other mega-cap names weighing on the Nasdaq and S&P 500. At the same time, the Russell 2000 closed above 3,000 for the first time ever, gaining 0.83% and showing that capital is beginning to move into smaller companies. That is an important development because a healthier bull market usually needs broader participation beyond a handful of mega-cap technology stocks.
This does not mean technology leadership is broken. It means the market is becoming more balanced. Mega-cap tech may remain volatile as rates rise and valuations are tested, but semiconductors remain the power center of the market. Intel’s recent 10.6% jump helped spark a sector-wide rally, and AI-linked chipmakers continue to attract capital because they are tied directly to data centers, memory demand, cloud infrastructure, and next-generation computing power.
That makes Micron one of the most important names to watch this week. MU reports earnings on Wednesday, and the setup has become one of the most important corporate events on the calendar. Price targets have been raised aggressively ahead of the report, with some as high as $1,550, reflecting enthusiasm around AI memory demand and improving pricing trends. Micron’s guidance will matter far beyond one stock. A strong report could reinforce the AI and semiconductor rally, while weak guidance could trigger profit-taking across the group.
The Federal Reserve is the biggest risk to the bullish case. The Fed held rates steady at 3.50%–3.75%, but the tone became more hawkish after officials removed language that had hinted at future cuts. Markets are now pricing in the possibility of a rate hike as soon as October, which is why Treasury yields are rising and growth stocks are facing pressure.
This is the narrow lane the market is trading in. If inflation stays sticky, the Fed cannot ease and may be forced to stay restrictive longer. If the labor market weakens too quickly, recession fears could return. If growth remains strong while inflation stays elevated, rate-hike expectations could rise further. That is why this week’s inflation data matters so much.
The key report is Thursday’s Core PCE reading, the Fed’s preferred inflation gauge. Expectations call for a 0.3% monthly increase, with the year-over-year rate holding near 3.3%. A cooler number would support the bullish case by reducing pressure on the Fed and helping stabilize yields. A hotter number could trigger a broader risk-off move, especially with stocks already near record highs and valuations stretched in parts of the market.
Thursday also brings the final reading on first-quarter GDP, with consensus looking for confirmation of 1.6% growth. A weaker number could raise slowdown concerns, while a stronger number could revive rate-hike fears. That makes the market’s reaction just as important as the number itself. Investors want growth strong enough to support earnings, but not so strong that it forces the Fed to tighten again.
Bank stress test results are also due this week, covering 32 major banks. The results will influence dividend plans, buybacks, and sentiment across the financial sector. With small caps breaking out and broader participation improving, financials are becoming more important to the market’s next leg higher. A positive stress-test outcome could support confidence in banks and help the rotation broaden.
Global inflation data will also be in focus, including Canada CPI, Australia CPI, and Brazil’s IPCA-15 inflation reading. These reports matter because inflation trends outside the U.S. can affect currency flows, commodity prices, emerging-market sentiment, and global central-bank expectations. In a market already sensitive to yields and inflation, global data can still move risk appetite.
The bottom line is that this remains a bullish market, but not a careless one. The long-term trend is intact, volatility is contained, and investors are still finding opportunities. Lower oil prices, progress on U.S.–Iran negotiations, semiconductor strength, and broader participation from small caps all support the bullish case.
But the risks are real. The Fed is leaning more hawkish, inflation remains sticky, Treasury yields are rising, and mega-cap technology is no longer carrying the entire market without resistance. With stocks near record highs, investors should expect sharper reactions to earnings, inflation data, and geopolitical headlines.
This is a market where discipline matters. We want to stay aligned with the trend, but we do not want to chase extended moves without a plan. The best opportunities are likely to come from strong companies with real earnings power, AI or infrastructure exposure, improving margins, and technical setups that offer clear risk management. The rally can continue, but this week will test whether the market can broaden beyond mega-cap tech while absorbing higher-rate risk and another critical inflation print.
West Texas Intermediate for Crude Oil delivery (CL.1) is priced at $75.19 per barrel, down 1.84%, at the time of publication.
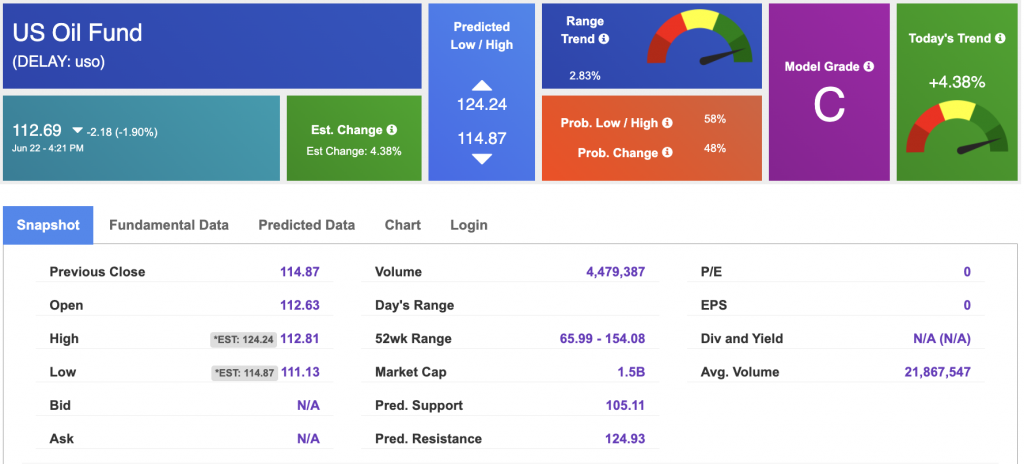
Looking at USO, a crude oil tracker, our 10-day prediction model shows mixed signals. The fund is trading at $112.69 at the time of publication. Prediction data is uploaded after the market close at 6 p.m., CST. Today’s data is based on market signals from the previous trading session.
The price for the Gold Continuous Contract (GC00) is down down 0.85% at $4,209.70 at the time of publication.
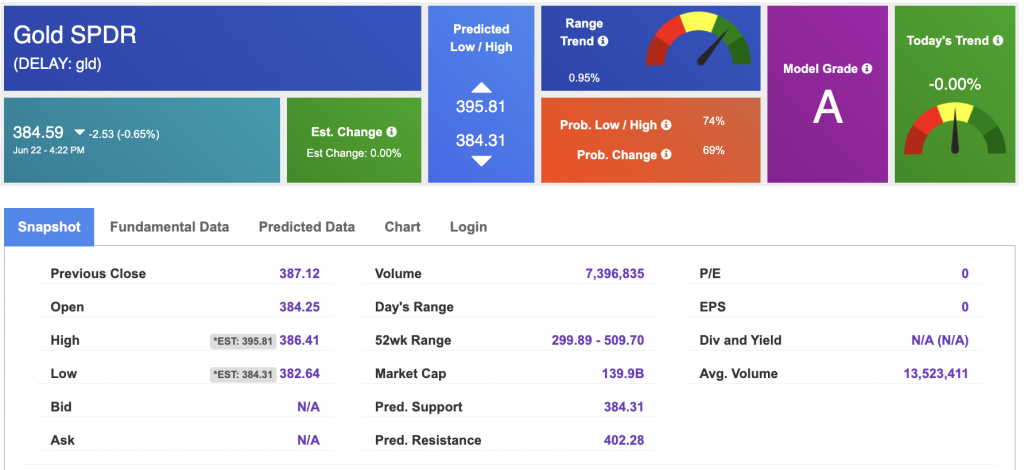
Using SPDR GOLD TRUST (GLD) as a tracker in our Stock Forecast Tool, the 10-day prediction window shows mixed signals. The gold proxy is trading at $384.59 at the time of publication. Vector signals show 0.00% for today. Prediction data is uploaded after the market close at 6 p.m., CST. Today’s data is based on market signals from the previous trading session.
The yield on the 10-year Treasury note is up at 4.516% at the time of publication.
The yield on the 30-year Treasury note is up at 4.950% at the time of publication.
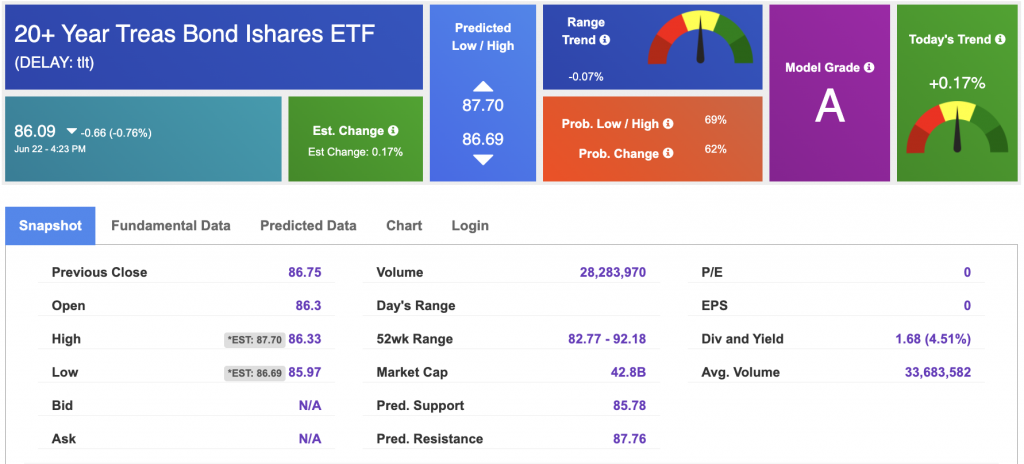
Using the iShares 20+ Year Treasury Bond ETF (TLT) as a proxy for bond prices in our Stock Forecast Tool, we see mixed signals in our 10-day prediction window. Prediction data is uploaded after the market close at 6 p.m., CST. Today’s data is based on market signals from the previous trading session.
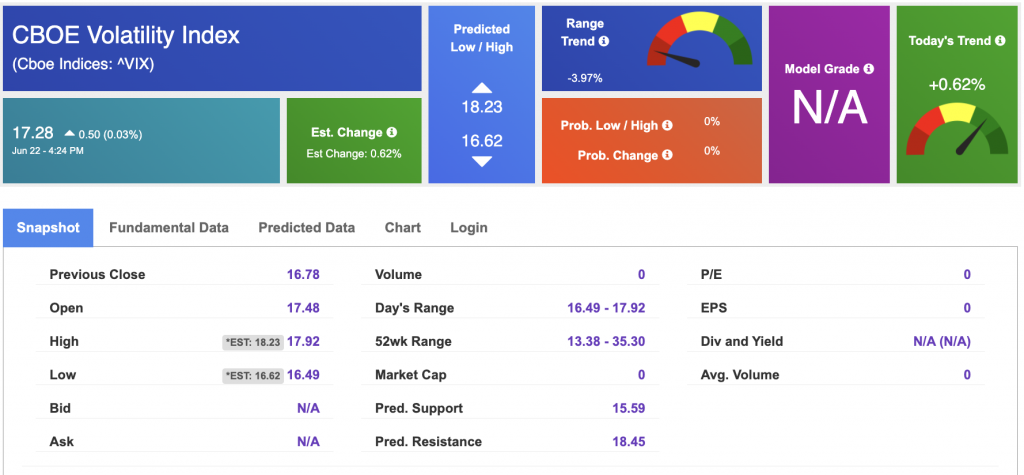
The CBOE Volatility Index (^VIX) is priced at $17.28 at the time of publication, and our 10-day prediction window shows mixed signals. Prediction data is uploaded after the market close at 6 p.m., CST. Today’s data is based on market signals from the previous trading session.
Please share this Tradespoon Market Commentary with your friends.
![]()

![]()
Comments Off on


Tradespoon Tools make finding winning trades in minute as easy as 1-2-3.
Our simple 3 step approach has resulted in an average return of almost 20% per trade!

