 Are you a Long-Term Trader? Then take a look at our NEW RoboInvestor Service?
CLICK HERE TO LEARN MORE
Are you a Long-Term Trader? Then take a look at our NEW RoboInvestor Service?
CLICK HERE TO LEARN MORE
Stocks fell significantly on Wednesday after the release of minutes from the Federal Reserve’s last policy meeting in 2021 revealed a debate about a potentially faster pace of shrinkage and rate hikes. Following the publication of FOMC minutes from its most recent meeting in December, which revealed a more hawkish tone among Fed officials struggling to control inflation, stocks plummeted into the close. In the minutes there was robust discussion among certain Fed members about the possibility of raising rates faster and reducing its $8.8 trillion balance sheet. Nasdaq led all U.S. indices in its dropoff, down over 3%, as tech companies saw selloff pressure. The tech selloff was also influenced by a rise in government bond yields, which added to pressure on technology plays as investors considered the prospect of higher borrowing costs if the Fed hikes rates three times.
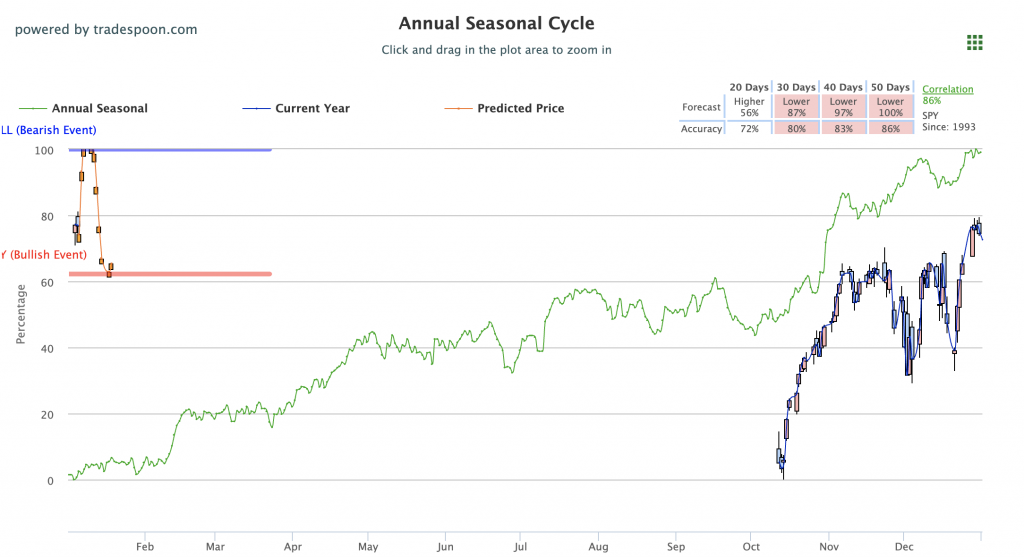
The $VIX just dropped back to 17 level and the $SPY continues to make the new highs. $QQQ is trading below the 50-day moving average on the precipitous drop in $TLT. Omicron virus, the fear of inflation, Fed meeting, December unemployment numbers this week can impact the next move in the market. We are watching the vital support levels in the SPY, which are presently at $472 and then $467, and we expect the market to continue to trade higher into the first quarter of 2022. Globally, European markets closed in the green while Asian markets finished with mixed results. We encourage all market commentary readers to maintain clearly defined stop levels for all positions. For reference, the SPY Seasonal Chart is shown below:
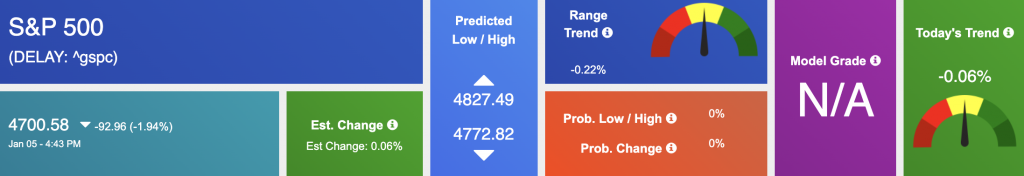
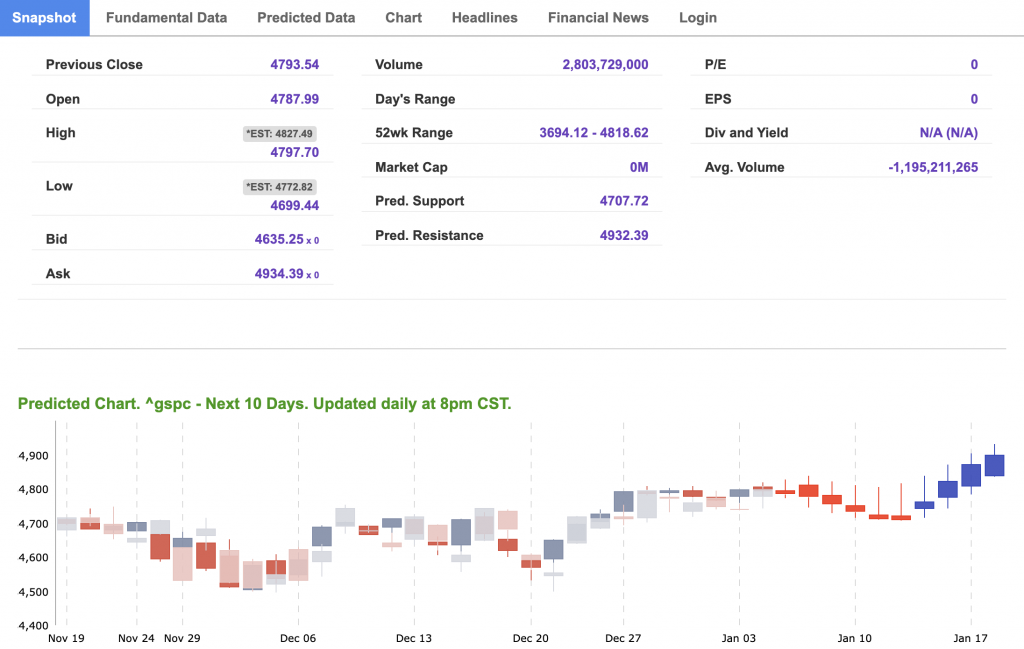
Using the “^GSPC” symbol to analyze the S&P 500 our 10-day prediction window shows a near-term mixed outlook. Prediction data is uploaded after the market closes at 6 p.m. CST. Today’s data is based on market signals from the previous trading session.
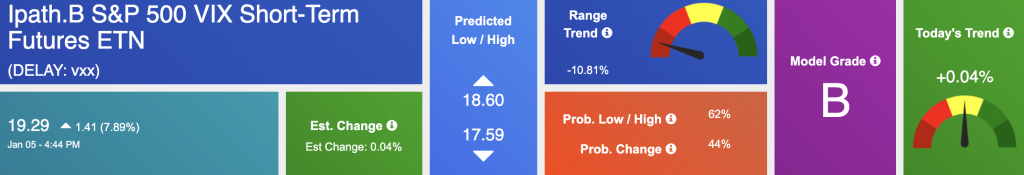
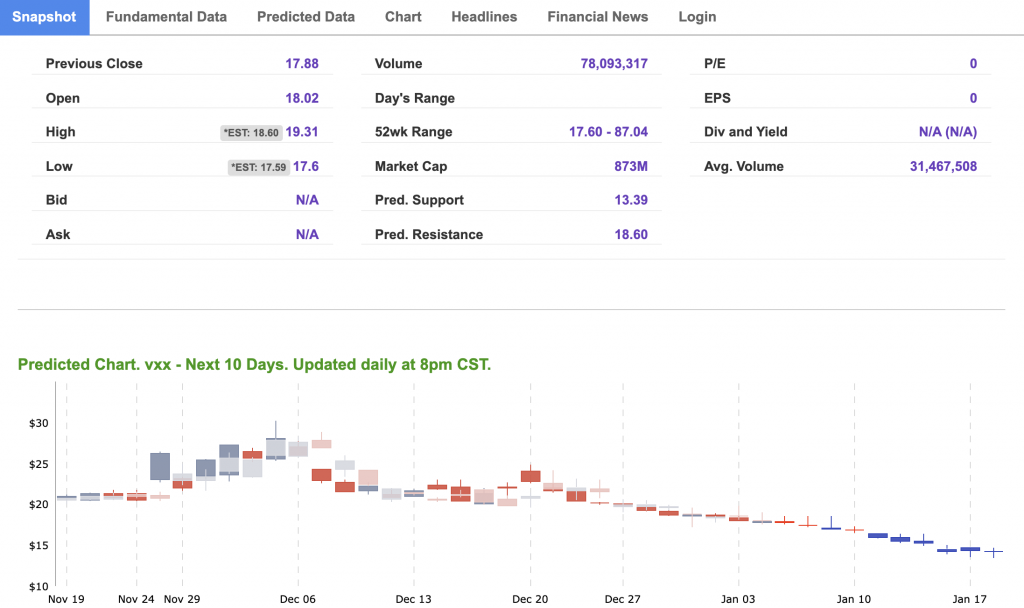
The symbol is trading at $19.29 with a vector of +0.04% at the time of publication.
10-Day Prediction data is uploaded after the market close at 6 p.m., CST. Today’s data is based on market signals from the previous trading session.
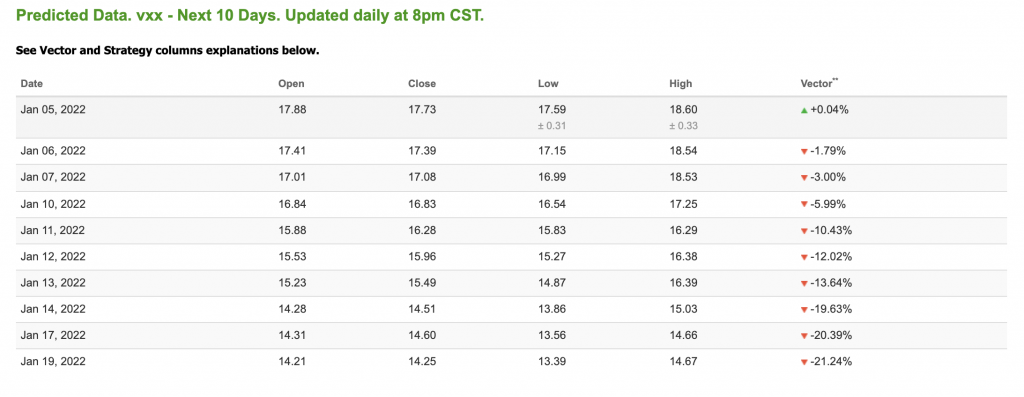
Note: The Vector column calculates the change of the Forecasted Average Price for the next trading session relative to the average of actual prices for the last trading session. The column shows the expected average price movement “Up or Down”, in percent. Trend traders should trade along the predicted direction of the Vector. The higher the value of the Vector the higher its momentum.
*Please note: At the time of publication Vlad Karpel does have a position in the featured symbol, vxx. Our featured symbol is part of your free subscription service. It is not included in any paid Tradespoon subscription service. Vlad Karpel only trades his money in paid subscription services. If you are a paid subscriber, please review your Premium Member Picks, ActiveTrader, or MonthlyTrader recommendations. If you are interested in receiving Vlad’s picks, please click here.
West Texas Intermediate for Crude Oil delivery (CL.1) is priced at $77.19 per barrel, up 0.26% at the time of publication.

Looking at USO, a crude oil tracker, our 10-day prediction model shows mixed signals. The fund is trading at $51.44 at the time of publication. Prediction data is uploaded after the market close at 6 p.m., CST. Today’s data is based on market signals from the previous trading session.
The price for the Gold Continuous Contract (GC00) is down 0.22% at $1810.60 at the time of publication.

Using SPDR GOLD TRUST (GLD) as a tracker in our Stock Forecast Tool, the 10-day prediction window shows mixed signals. The gold proxy is trading at $169.37 at the time of publication. Vector signals show -0.19% for today. Prediction data is uploaded after the market close at 6 p.m., CST. Today’s data is based on market signals from the previous trading session.
The yield on the 10-year Treasury note is up, at 1.706% at the time of publication.
The yield on the 30-year Treasury note is up, at 2.102% at the time of publication.

Using the iShares 20+ Year Treasury Bond ETF (TLT) as a proxy for bond prices in our Stock Forecast Tool, we see mixed signals in our 10-day prediction window. Prediction data is uploaded after the market close at 6 p.m., CST. Today’s data is based on market signals from the previous trading session.
The CBOE Volatility Index (^VIX) is $17.68 at the time of publication, and our 10-day prediction window shows mixed signals. Prediction data is uploaded after the market close at 6 p.m., CST. Today’s data is based on market signals from the previous trading session.

Please share this Tradespoon Market Commentary with your friends.
![]()

![]()
Comments Off on


Tradespoon Tools make finding winning trades in minute as easy as 1-2-3.
Our simple 3 step approach has resulted in an average return of almost 20% per trade!

