 Save Big on Commissions ($0.65 per Contract)
CLICK HERE TO LEARN MORE
Save Big on Commissions ($0.65 per Contract)
CLICK HERE TO LEARN MORE
All three major U.S. indices closed in the red, alongside gold and oil which also traded lower. The stock market had its worst day in two months on Monday as concern over the stock market had spiked and fear the Federal Reserve would start raising interest rates to fight inflation pressured markets. The Dow, S&P, and Nasdaq all finished last week in the red following mixed messages from the latest Federal Open Market Committee meeting minutes and July’s retail data. This week will feature key home sale reports, GDP data, and Fed Chair Jerome Powell’s speech at the annual Jackson Hole retreat. Market-wide fear has spread that the latest bull run is likely ending and the bear market is set to resume. This notion has recently been backed by the rally in the dollar, bond yields on the move higher, and several cyclical sectors showing strong performance over the last few weeks. Focus will remain on yields as well comments from the Fed as we close out the month of August. As it stands, we believe the market is overbought and the bear market is set to resume in the coming weeks.
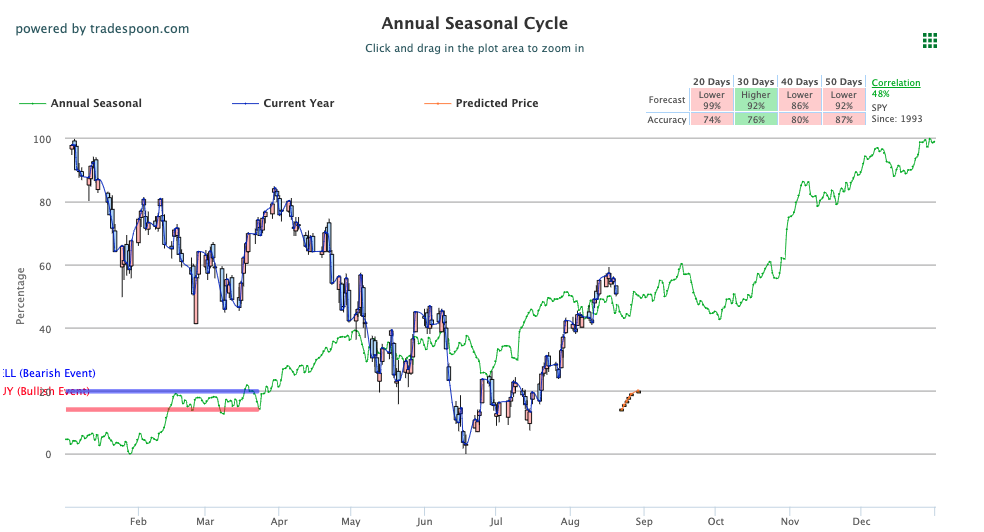
The $VIX is trading near the $230 level and the U.S. Dollar Index, $DXY, trading in the $108 range. This week, the $MRVL, $INTU, and $CRM earnings as well as GDP, PCE, and Fed Chair Powell’s interview on Friday can influence the next move in the market. We are watching the overhead resistance levels in the SPY, which are presently at $420 and then $430. The $SPY support is at $416 and then $406. We expect the market to continue the current pullback for the next 4-8 weeks. We would also be a seller into any further rallies and encourages subscribers not to chase the market at these levels. Globally, Asian markets traded to mixed results while European markets finished in the red. We encourage all market commentary readers to maintain clearly defined stop levels for all positions. For reference, the SPY Seasonal Chart is shown below:
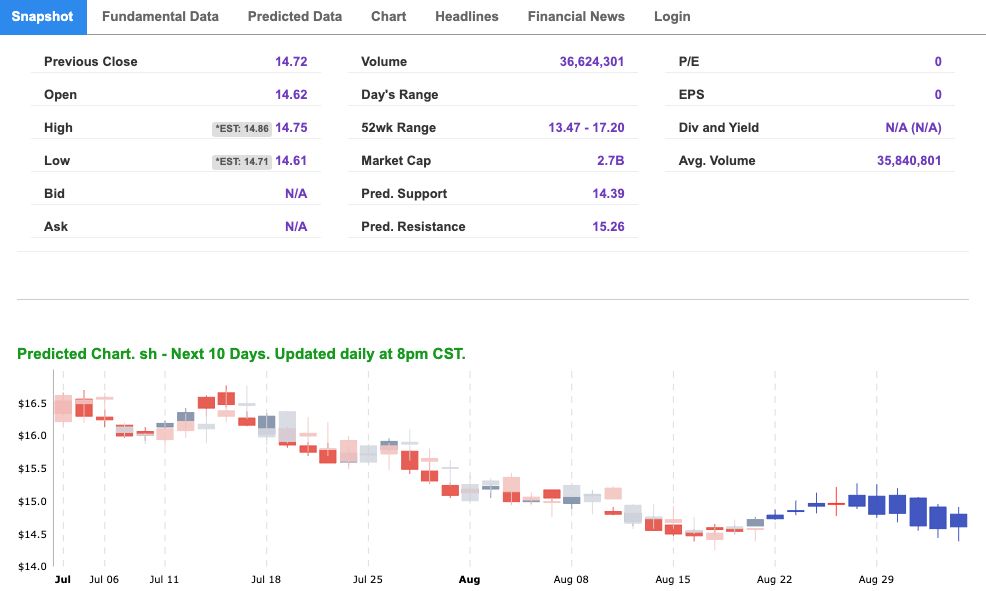
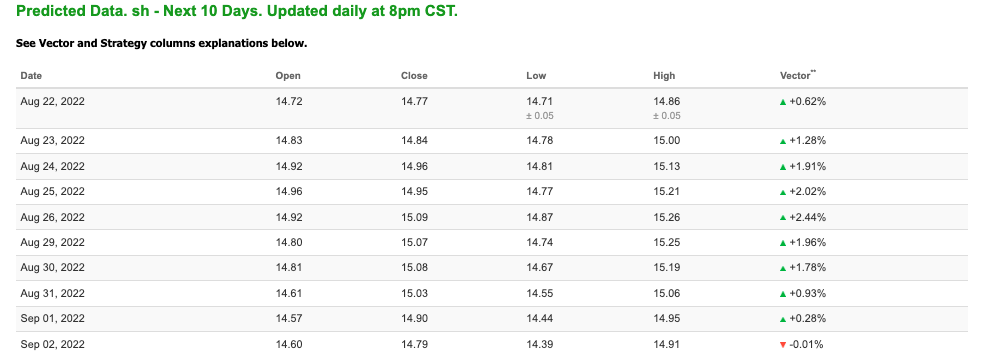
Note: The Vector column calculates the change of the Forecasted Average Price for the next trading session relative to the average of actual prices for the last trading session. The column shows the expected average price movement “Up or Down”, in percent. Trend traders should trade along the predicted direction of the Vector. The higher the value of the Vector the higher its momentum.
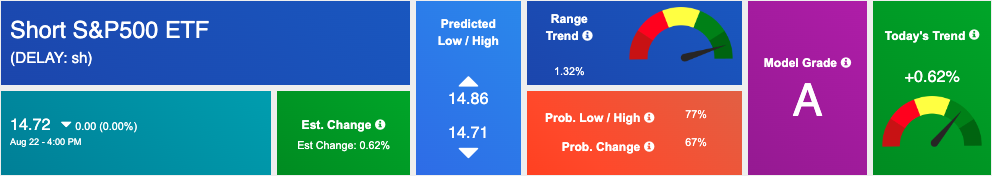
*Please note: At the time of publication Vlad Karpel does have a position in the featured symbol, SH. Our featured symbol is part of your free subscription service. It is not included in any paid Tradespoon subscription service. Vlad Karpel only trades his money in paid subscription services. If you are a paid subscriber, please review your Premium Member Picks, ActiveTrader, or MonthlyTrader recommendations. If you are interested in receiving Vlad’s picks, please click here.
West Texas Intermediate for Crude Oil delivery (CL.1) is priced at $90.67 per barrel, down 0.11%, at the time of publication.
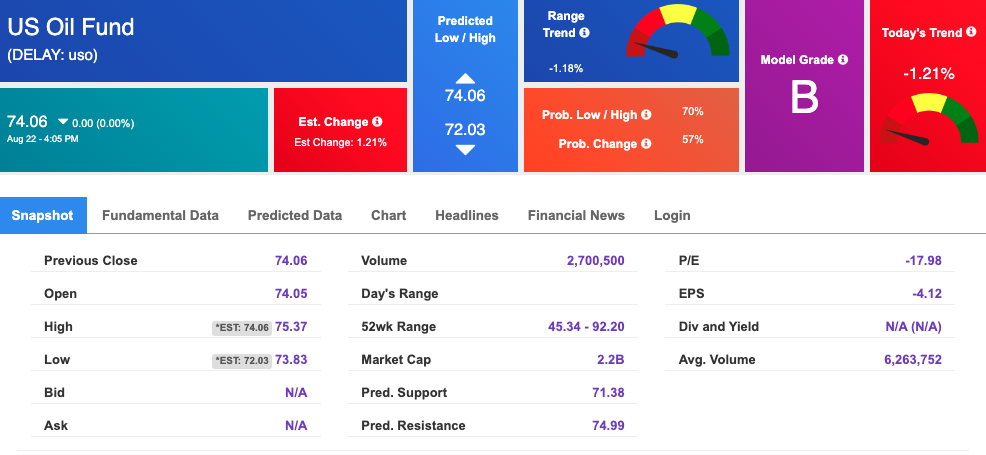
Looking at USO, a crude oil tracker, our 10-day prediction model shows mixed signals. The fund is trading at $74.06 at the time of publication. Prediction data is uploaded after the market close at 6 p.m., CST. Today’s data is based on market signals from the previous trading session.
The price for the Gold Continuous Contract (GC00) is down 0.77% at $1749.40 at the time of publication.
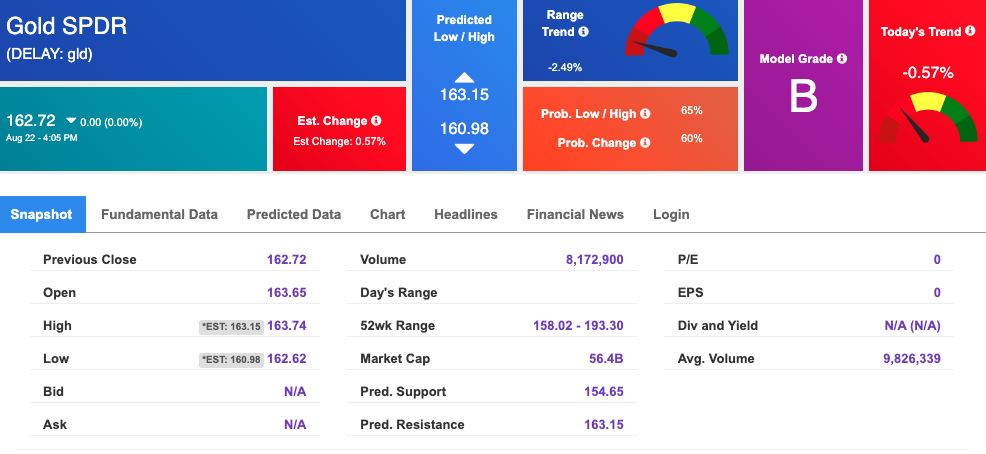
Using SPDR GOLD TRUST (GLD) as a tracker in our Stock Forecast Tool, the 10-day prediction window shows mixed signals. The gold proxy is trading at $162.72 at the time of publication. Vector signals show -0.57% for today. Prediction data is uploaded after the market close at 6 p.m., CST. Today’s data is based on market signals from the previous trading session.
The yield on the 10-year Treasury note is up, at 3.027% at the time of publication.
The yield on the 30-year Treasury note is up, at 3.232% at the time of publication.
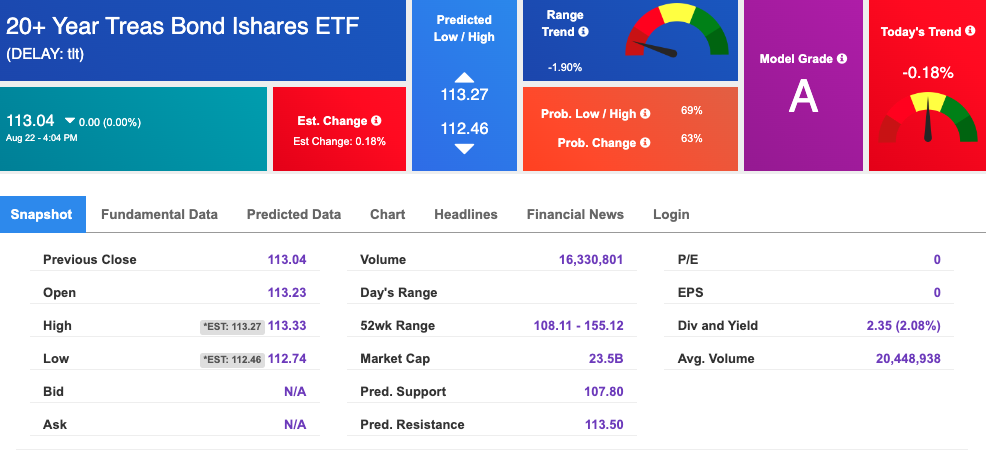
Using the iShares 20+ Year Treasury Bond ETF (TLT) as a proxy for bond prices in our Stock Forecast Tool, we see mixed signals in our 10-day prediction window. Prediction data is uploaded after the market close at 6 p.m., CST. Today’s data is based on market signals from the previous trading session.
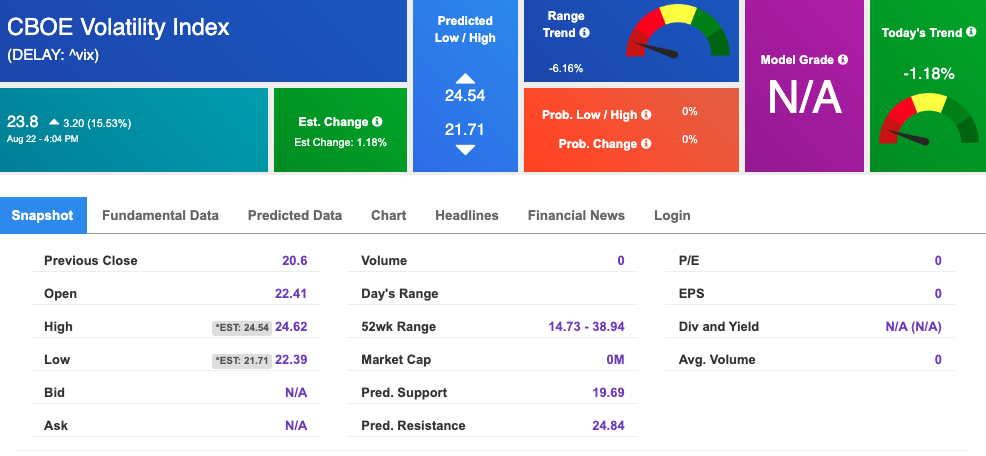
The CBOE Volatility Index (^VIX) is $23.8 at the time of publication, and our 10-day prediction window shows mixed signals. Prediction data is uploaded after the market close at 6 p.m., CST. Today’s data is based on market signals from the previous trading session.
Please share this Tradespoon Market Commentary with your friends.
![]()

![]()
Comments Off on


Tradespoon Tools make finding winning trades in minute as easy as 1-2-3.
Our simple 3 step approach has resulted in an average return of almost 20% per trade!

