 Are you a Long-Term Trader? Then take a look at our NEW RoboInvestor Service?
CLICK HERE TO LEARN MORE
Are you a Long-Term Trader? Then take a look at our NEW RoboInvestor Service?
CLICK HERE TO LEARN MORE
On Wednesday, the S&P 500 encountered its worst dip of 2023 and the Dow plummeted over 600 points in response to hawkish declarations from Federal Reserve representatives. The Dow Jones Industrial Average finished 1.8% down, while the S&P 500 experienced an impressive 1.6% drop-off. Additionally, Nasdaq Composite’s seven-day streak ended with it trailing behind by 1.2%. Just this week, numerous Fed members have indicated that the current inflation rate is still too high, necessitating a further increase in interest rates. Additionally, pressuring markets today was some of the latest economic data reported. Releasing on Wednesday, the Producer-Price Index had seen an unexpected drop in December, while retail sales decreased by 1.1% during the same month. This data provides insight into the current economic conditions and suggests an elongated potential for a downward trend.
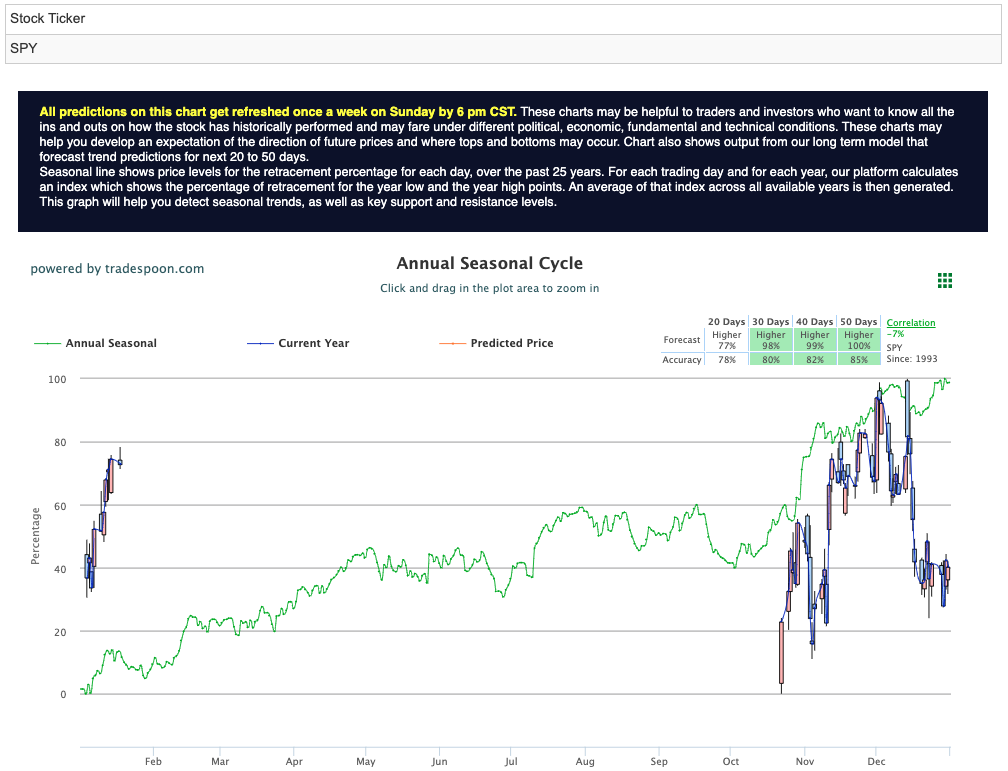
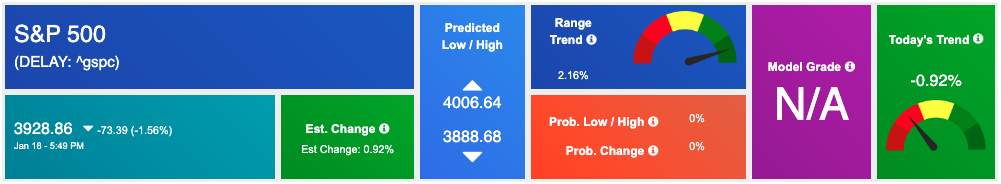
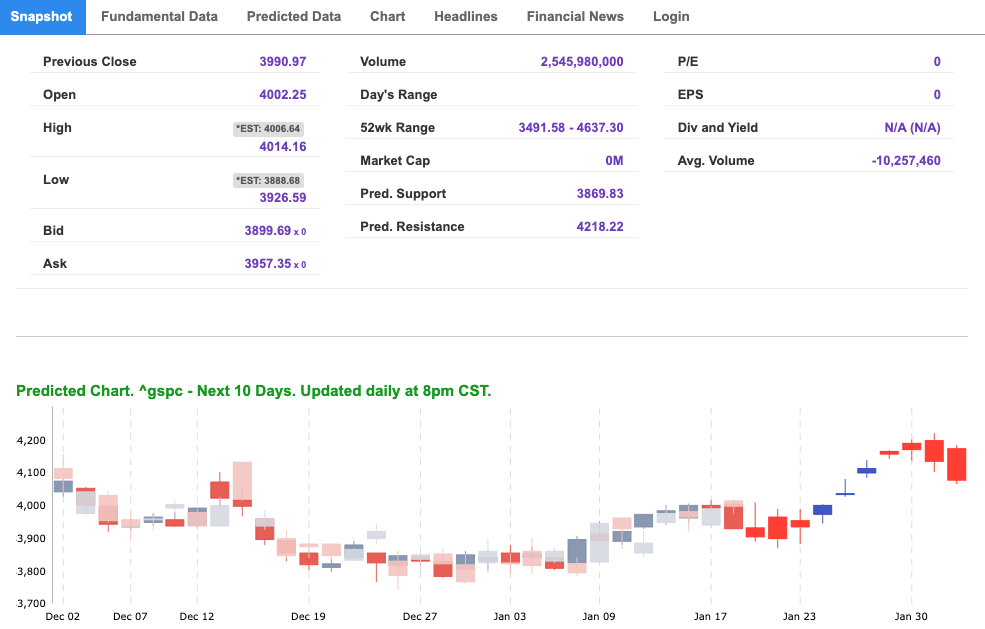
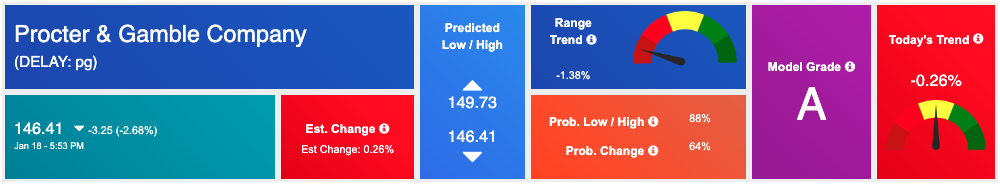
As we analyze the current market climate and forecast for the upcoming moves, $VIX is floating around $19. The $DFS, $NFLX, and $PG earnings this week – as well as PPI, Retail data – can influence the next move in the market. We are watching the overhead resistance levels in the SPY, which are presently at $402 and then $416. The $SPY support is at $391 and then $385. We expect the market to resume the bear market in the next 2-8 weeks. We would be BEARISH ON THE MARKET at this time and encourage subscribers to hedge their positions. Globally, Asian markets closed in the green while European markets were mixed, but saw a predominant downward trend. Market commentary readers should maintain clearly defined stop levels for all positions. For reference, the SPY Seasonal Chart is shown below:
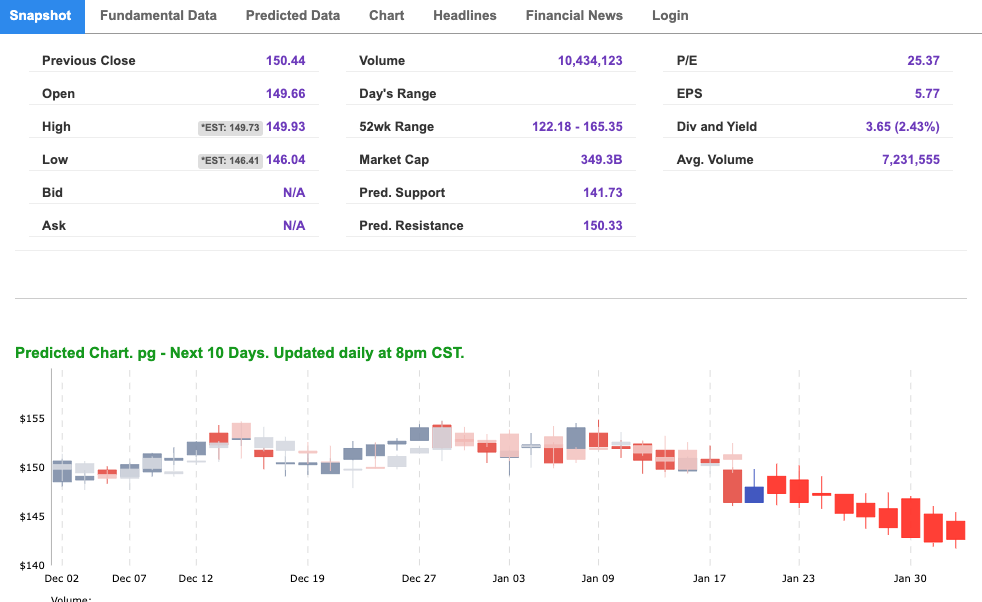
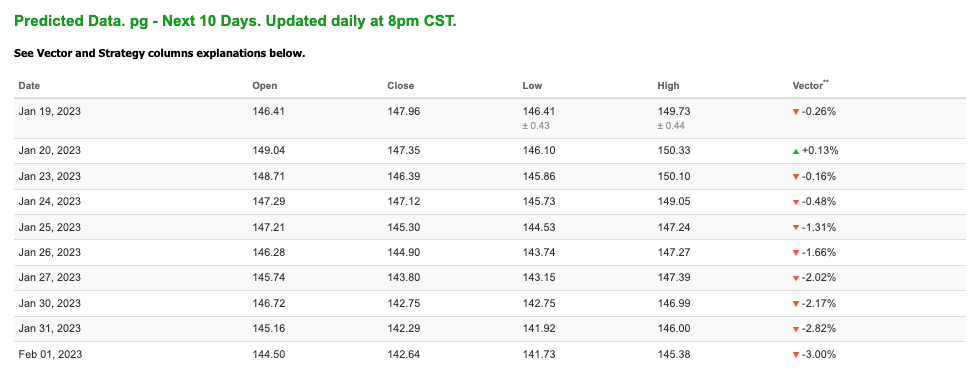
Note: The Vector column calculates the change of the Forecasted Average Price for the next trading session relative to the average of actual prices for the last trading session. The column shows the expected average price movement “Up or Down”, in percent. Trend traders should trade along the predicted direction of the Vector. The higher the value of the Vector the higher its momentum.
*Please note: At the time of publication Vlad Karpel does have a position in the featured symbol, PG. Our featured symbol is part of your free subscription service. It is not included in any paid Tradespoon subscription service. Vlad Karpel only trades his money in paid subscription services. If you are a paid subscriber, please review your Premium Member Picks, ActiveTrader, or MonthlyTrader recommendations. If you are interested in receiving Vlad’s picks, please click here.
West Texas Intermediate for Crude Oil delivery (CL.1) is priced at $146 per barrel, up 3.45%, at the time of publication.
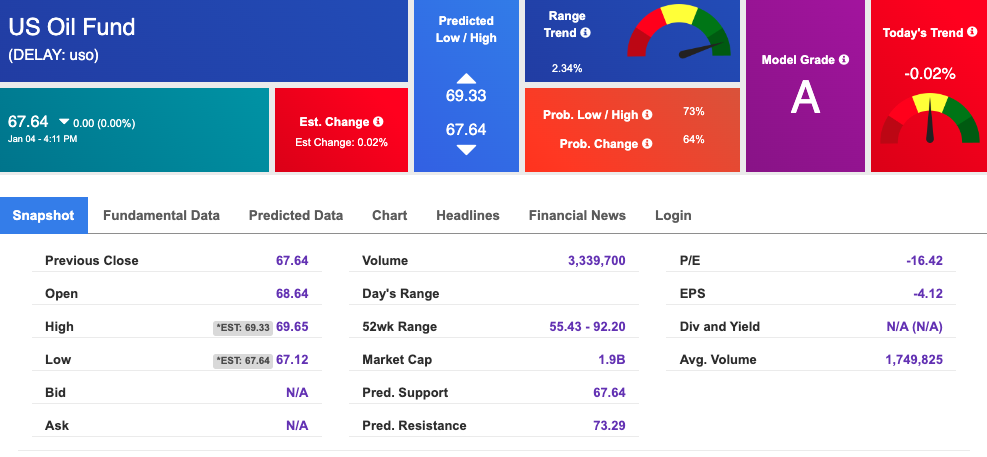
Looking at USO, a crude oil tracker, our 10-day prediction model shows mixed signals. The fund is trading at $67.64 at the time of publication. Prediction data is uploaded after the market close at 6 p.m., CST. Today’s data is based on market signals from the previous trading session.
The price for the Gold Continuous Contract (GC00) is up 0.17% at $1879.70 at the time of publication.
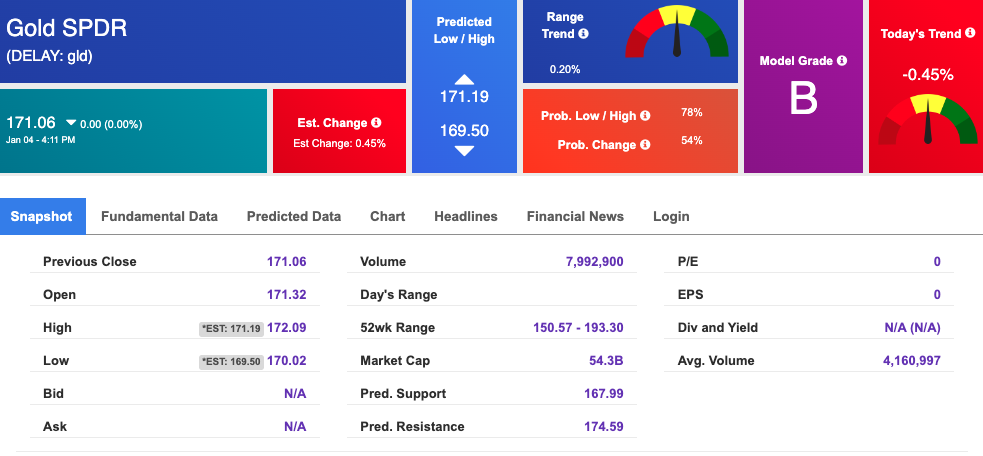
Using SPDR GOLD TRUST (GLD) as a tracker in our Stock Forecast Tool, the 10-day prediction window shows mixed signals. The gold proxy is trading at $171.06 at the time of publication. Vector signals show -0.45% for today. Prediction data is uploaded after the market close at 6 p.m., CST. Today’s data is based on market signals from the previous trading session.
The yield on the 10-year Treasury note is down at 3.539% at the time of publication.
The yield on the 30-year Treasury note is down at 3.659% at the time of publication.
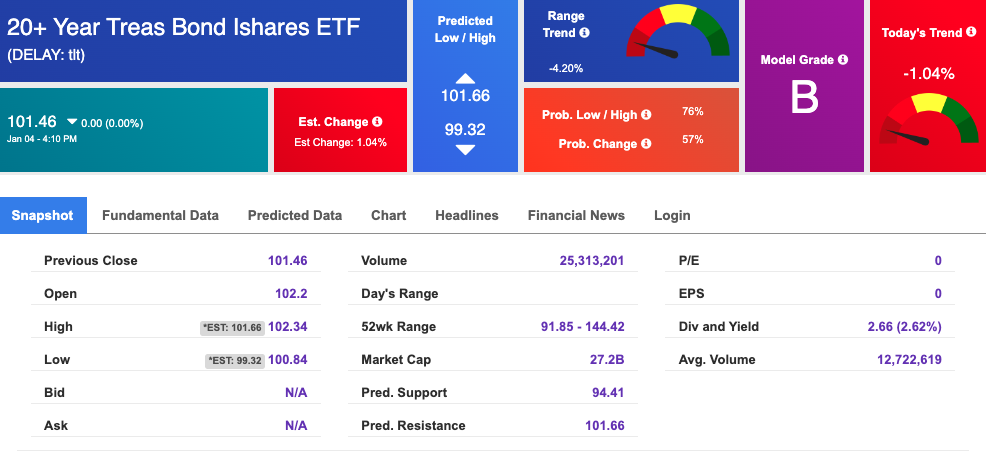
Using the iShares 20+ Year Treasury Bond ETF (TLT) as a proxy for bond prices in our Stock Forecast Tool, we see mixed signals in our 10-day prediction window. Prediction data is uploaded after the market close at 6 p.m., CST. Today’s data is based on market signals from the previous trading session.
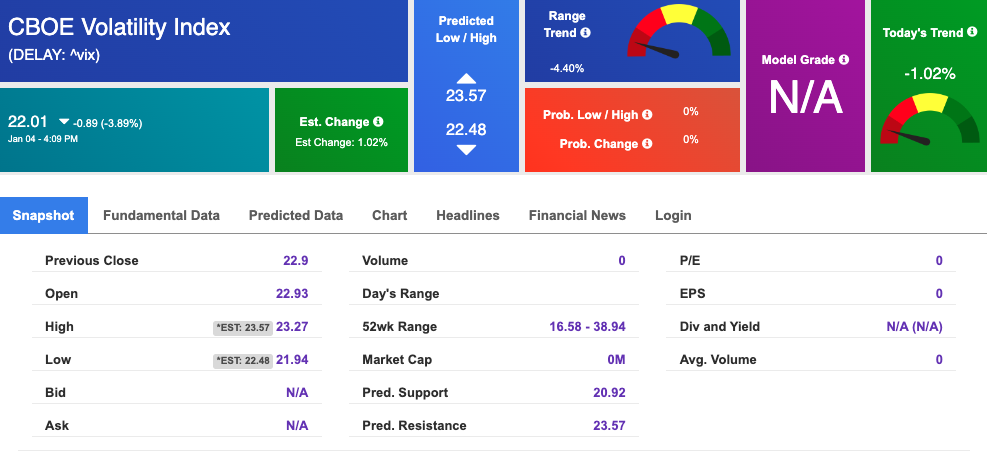
The CBOE Volatility Index (^VIX) is $22.14 at the time of publication, and our 10-day prediction window shows mixed signals. Prediction data is uploaded after the market close at 6 p.m., CST. Today’s data is based on market signals from the previous trading session.
Please share this Tradespoon Market Commentary with your friends.
![]()

![]()
Comments Off on


Tradespoon Tools make finding winning trades in minute as easy as 1-2-3.
Our simple 3 step approach has resulted in an average return of almost 20% per trade!

