 Special Offer: Try the 'Elite Trading Circle Membership' for ONLY $37!
CLICK HERE TO LEARN MORE
Special Offer: Try the 'Elite Trading Circle Membership' for ONLY $37!
CLICK HERE TO LEARN MORE
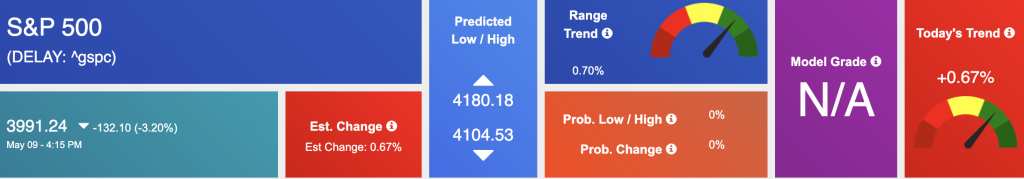
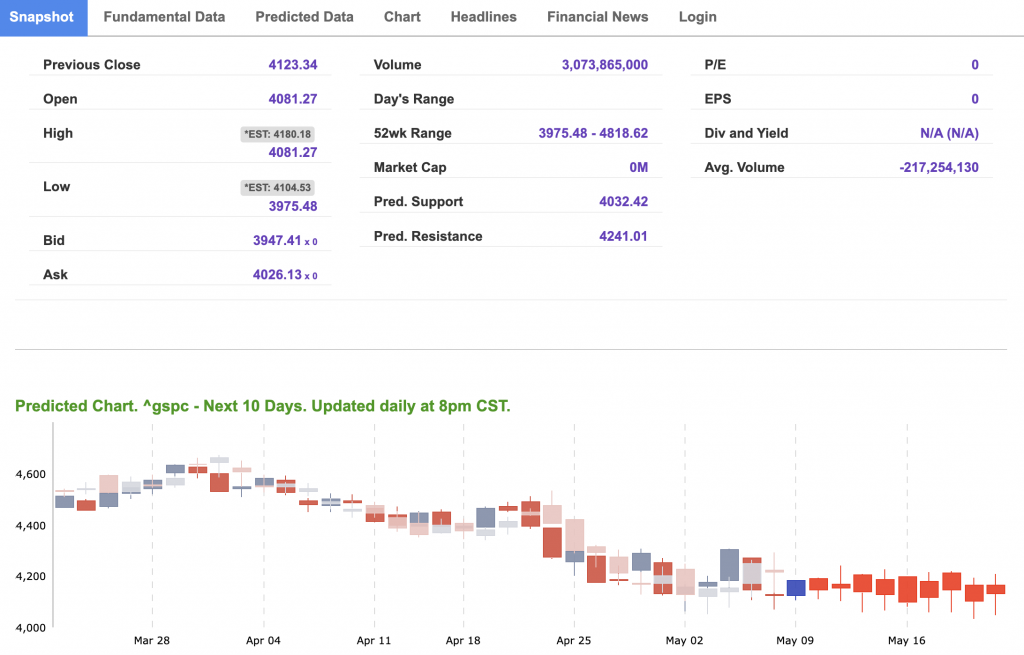
Major U.S. indices continued trading drastically lower to open the week today, dropping below key record and support levels. The Dow Jones Industrial Average lost 1.99%, the S&P 500 dropped 3.20%, and the Nasdaq down 4.22% as U.S. equities closed lower on Monday due to inflation worries continuing to plague the market. Along with U.S. indices, several other sectors and markets saw steep declines including gold and cryptocurrencies, as well as crude oil delivery prices, though they remain high. Last week’s April job report did not provide much support for markets while this week look out for Federal Budger, Consumer Price Index, and Core CPI data to release. Key earnings this week include Disney, Toyota, Duke Energy, Tyson Foods, Sysco, Electronic Arts, and Alibaba; while tomorrow watch for Occidental Petroleum, Hyatt Hotels, and Peloton Interactive to release quarterly data.
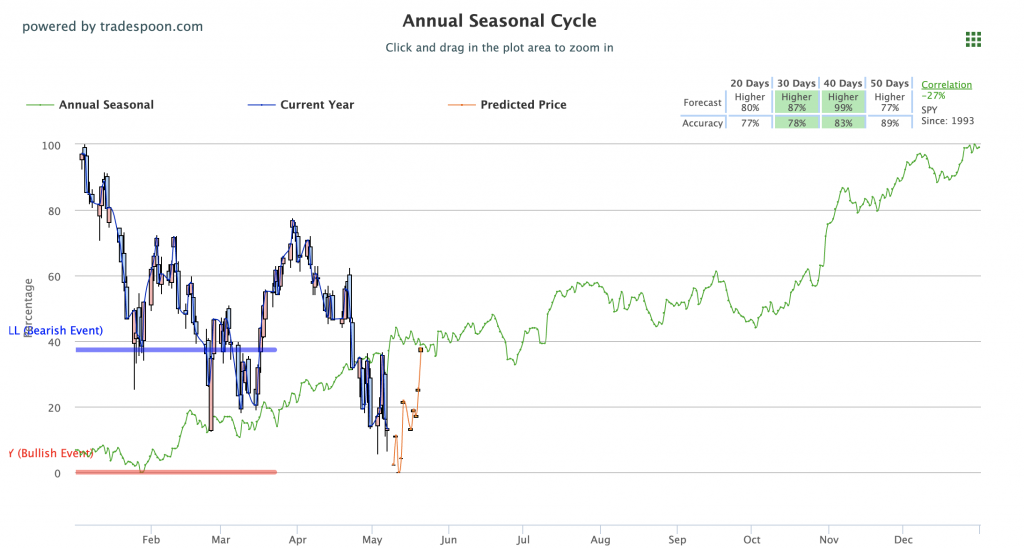
The $VIX jumped to $34 as the Geopolitical risks in Ukraine and inflation can impact the next move in the market. We are watching the overhead resistance levels in the SPY, which are presently at $405 and then $415. The $SPY support is at $395 and then $385. We expect the market to continue the pattern of lower highs and lower lows for the next 2-6 weeks. In the short term, the market is oversold. Globally, Asian markets closed to mixed results while European markets finished in the red. We encourage all market commentary readers to maintain clearly defined stop levels for all positions. For reference, the SPY Seasonal Chart is shown below:
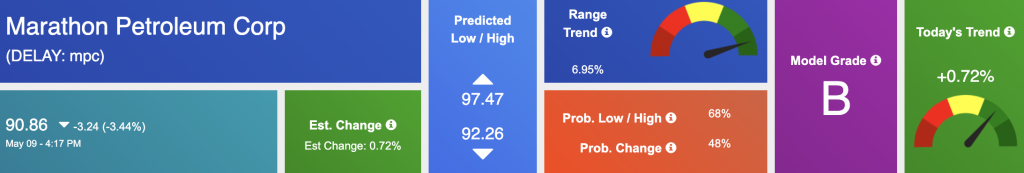
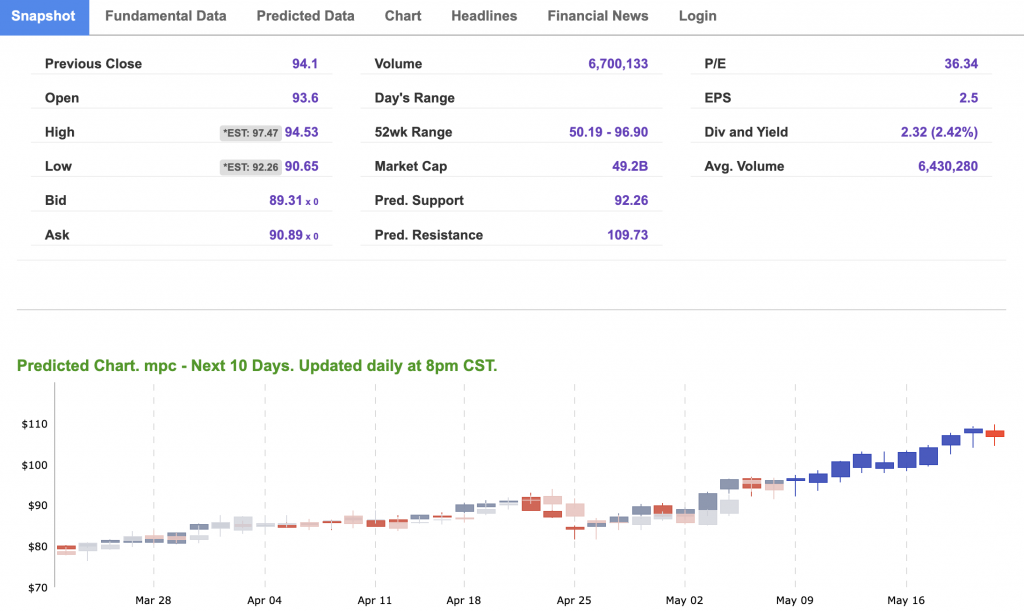
The symbol is trading at $90.86 with a vector of +0.72% at the time of publication.
10-Day Prediction data is uploaded after the market close at 6 p.m., CST. Today’s data is based on market signals from the previous trading session.
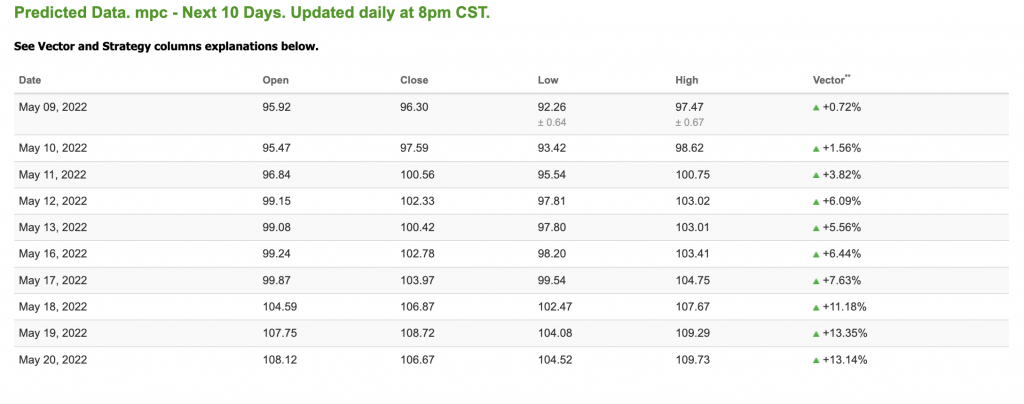
Note: The Vector column calculates the change of the Forecasted Average Price for the next trading session relative to the average of actual prices for the last trading session. The column shows the expected average price movement “Up or Down”, in percent. Trend traders should trade along the predicted direction of the Vector. The higher the value of the Vector the higher its momentum.
*Please note: At the time of publication Vlad Karpel does have a position in the featured symbol, sh. Our featured symbol is part of your free subscription service. It is not included in any paid Tradespoon subscription service. Vlad Karpel only trades his money in paid subscription services. If you are a paid subscriber, please review your Premium Member Picks, ActiveTrader, or MonthlyTrader recommendations. If you are interested in receiving Vlad’s picks, please click here.
West Texas Intermediate for Crude Oil delivery (CL.1) is priced at $102.35 per barrel, down 6.76%, at the time of publication.
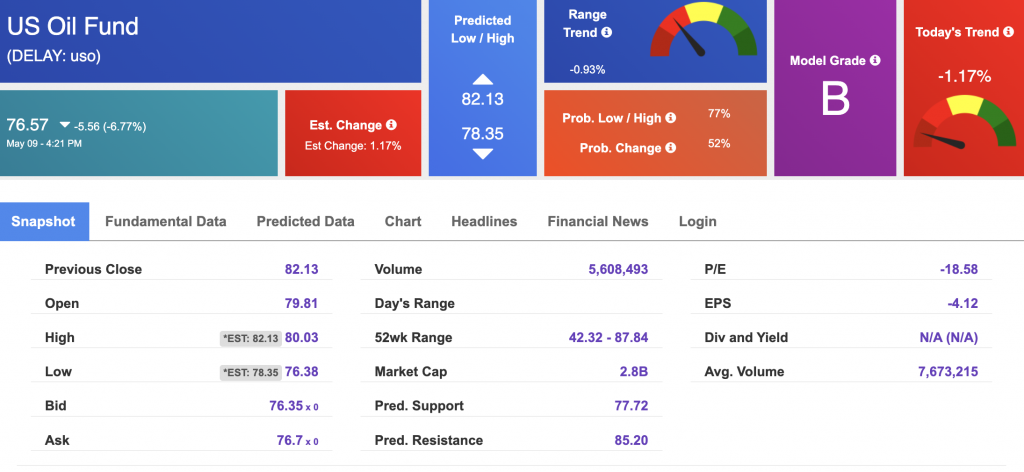
Looking at USO, a crude oil tracker, our 10-day prediction model shows mixed signals. The fund is trading at $76.57 at the time of publication. Prediction data is uploaded after the market close at 6 p.m., CST. Today’s data is based on market signals from the previous trading session.
The price for the Gold Continuous Contract (GC00) is down 1.55% at $1853.60 at the time of publication.
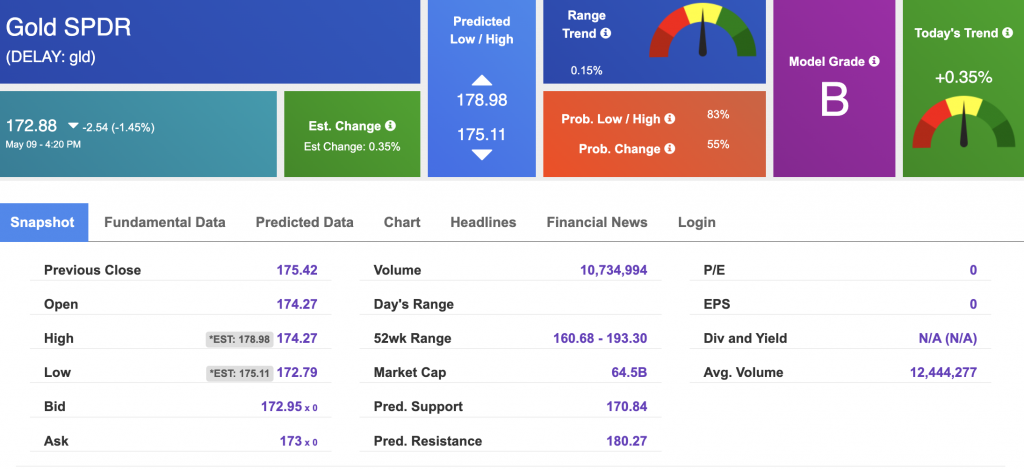
Using SPDR GOLD TRUST (GLD) as a tracker in our Stock Forecast Tool, the 10-day prediction window shows mixed signals. The gold proxy is trading at $172.88 at the time of publication. Vector signals show +0.35% for today. Prediction data is uploaded after the market close at 6 p.m., CST. Today’s data is based on market signals from the previous trading session.
The yield on the 10-year Treasury note is down, at 3.040% at the time of publication.
The yield on the 30-year Treasury note is down, at 3.157% at the time of publication.
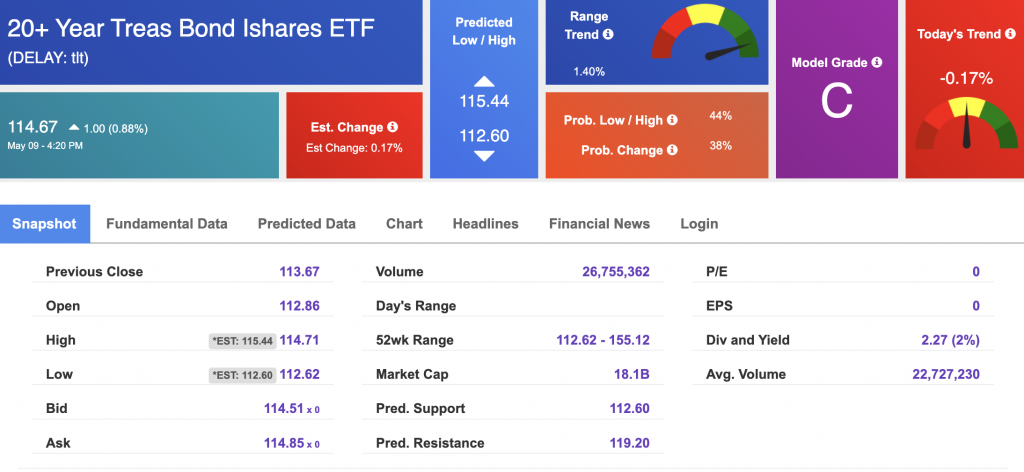
Using the iShares 20+ Year Treasury Bond ETF (TLT) as a proxy for bond prices in our Stock Forecast Tool, we see mixed signals in our 10-day prediction window. Prediction data is uploaded after the market close at 6 p.m., CST. Today’s data is based on market signals from the previous trading session.
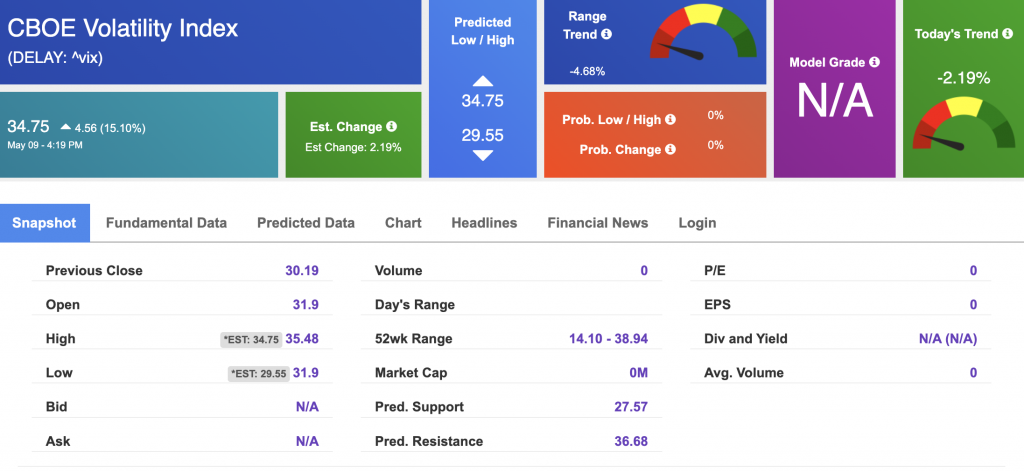
The CBOE Volatility Index (^VIX) is $34.75 at the time of publication, and our 10-day prediction window shows mixed signals. Prediction data is uploaded after the market close at 6 p.m., CST. Today’s data is based on market signals from the previous trading session.
Please share this Tradespoon Market Commentary with your friends.
![]()

![]()
Comments Off on


Tradespoon Tools make finding winning trades in minute as easy as 1-2-3.
Our simple 3 step approach has resulted in an average return of almost 20% per trade!

