 Sign Up for One-on-One Coaching and get our Premium Membership FREE for 1 Year!
CLICK HERE TO APPLY
Sign Up for One-on-One Coaching and get our Premium Membership FREE for 1 Year!
CLICK HERE TO APPLY
This week, investors are keeping a keen eye on the Federal Reserve’s policy as shifting expectations regarding future rate hikes threaten to impact the stock market and potentially slow down the U.S. economy. Despite these concerns, all three major U.S. stock indices traded higher today. The market also awaits crucial inflation data, with the latest Consumer Price Index report set to provide insight into the state of the economy. Meanwhile, oil prices dipped due to concerns that higher Fed rates will reduce demand, while Bitcoin saw a decline as regulatory fears came into focus. Look out for consumer credit data to be released on Tuesday, while Wednesday will feature several Fed official speeches; this week’s marquee economic report will then come on Friday with inflation reading via the Consumer Sentiment Index.
In our latest analysis, we are delving into the current market conditions and looking to provide insights on how to prepare for the next move. We want to highlight that the $VIX, a measure of market volatility, is trading close to the $20 level and that key earnings releases from companies such as $PLTR, $ABNB, and $AKAM, along with the crucial Consumer Price Index data, could play a significant role in determining the market’s next move.
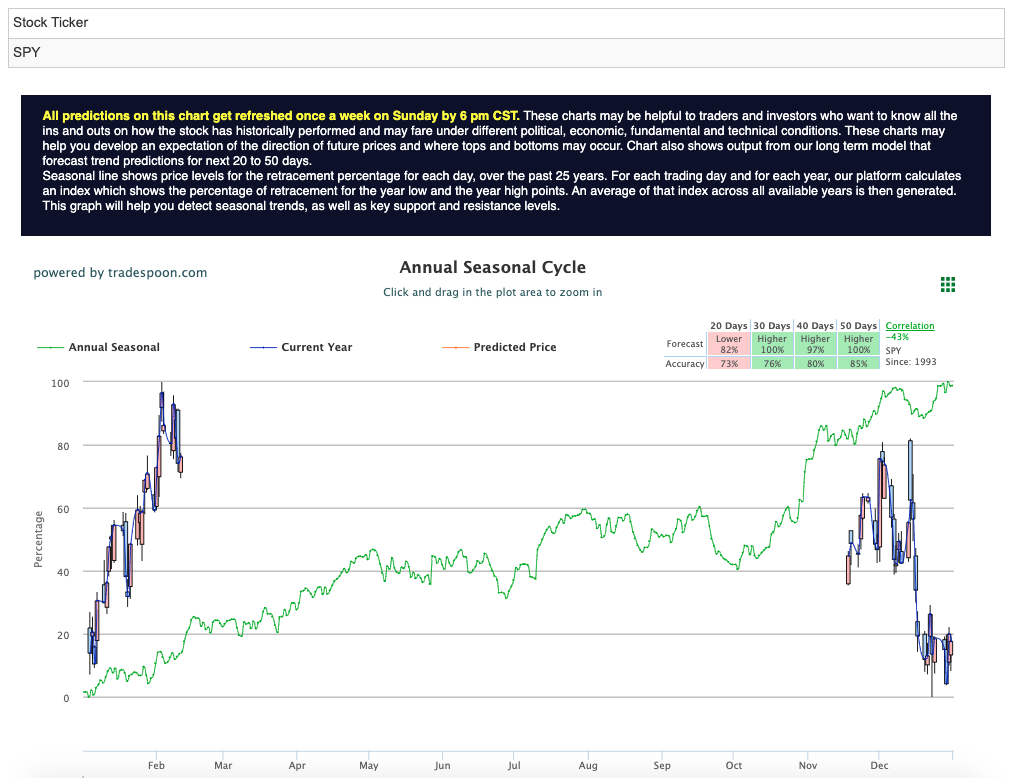
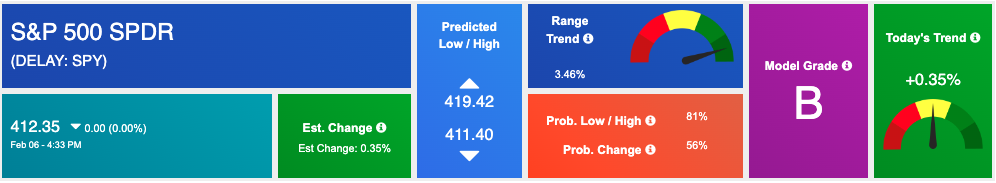
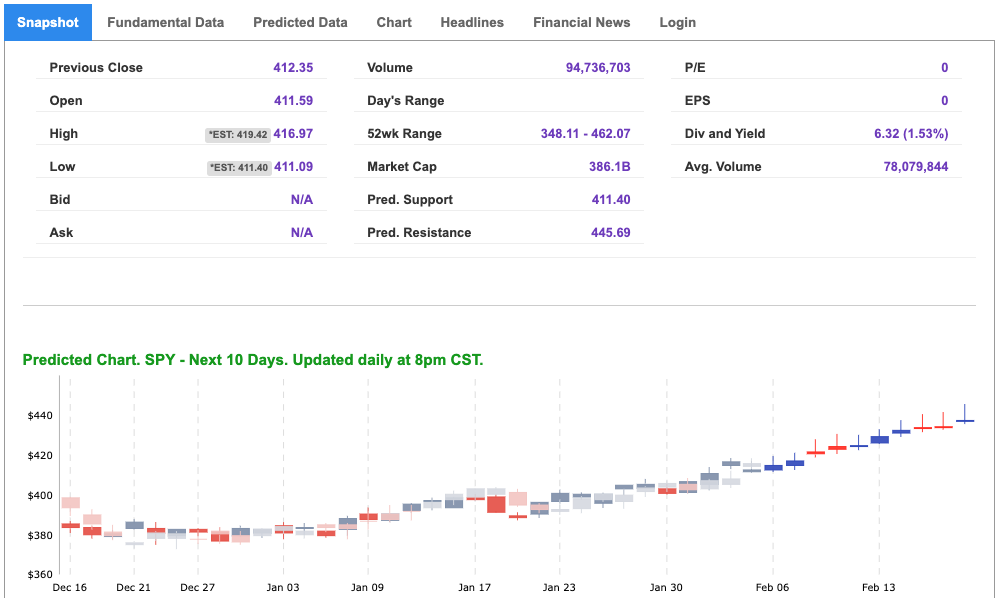
We are also closely watching the overhead resistance levels in the SPY, which currently stand at $420 and then $430, while the support levels are at $410 and then $402. Based on this analysis, we expect the market to trade sideways over the next two to eight weeks, leading us to maintain a market-neutral stance at this time. We advise subscribers to consider hedging their positions to manage risk. Globally, Asian markets traded with mixed results while European markets closed in the green. Market commentary readers should maintain clearly defined stop levels for all positions. For reference, the SPY Seasonal Chart is shown below:
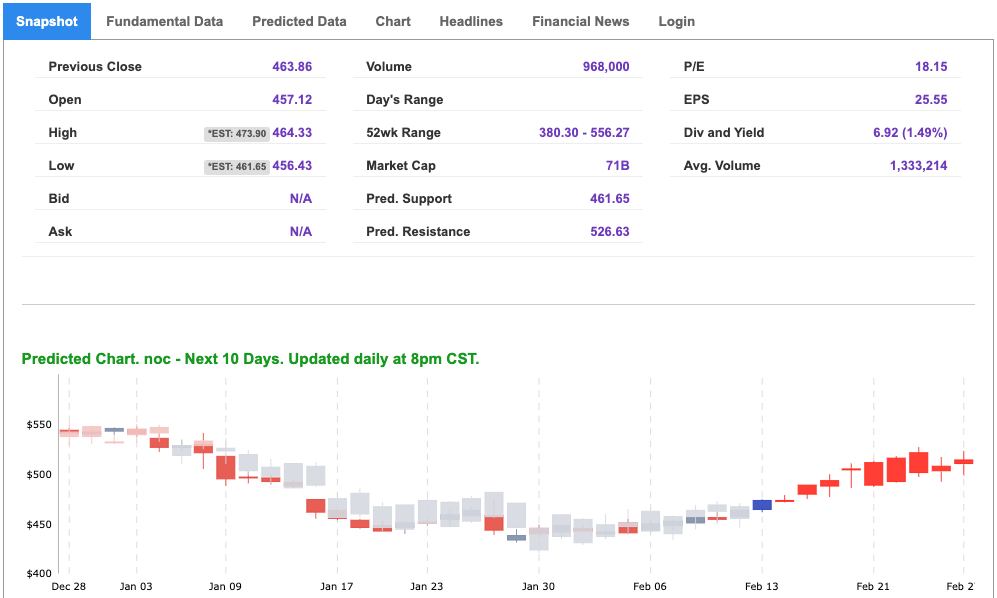
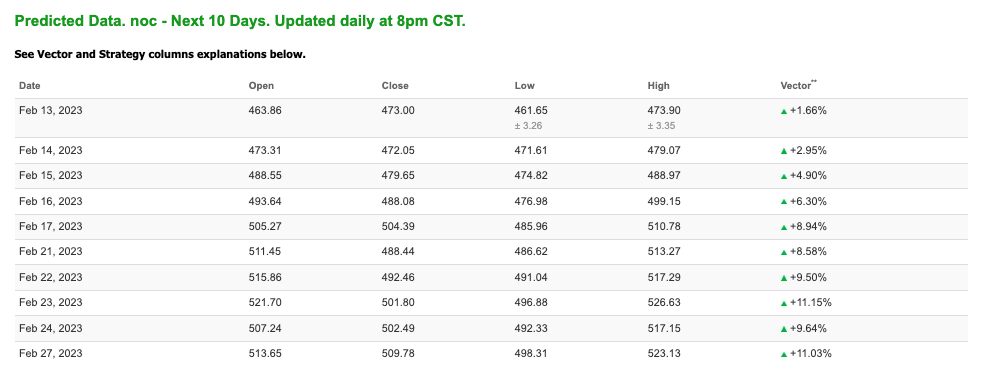
Note: The Vector column calculates the change of the Forecasted Average Price for the next trading session relative to the average of actual prices for the last trading session. The column shows the expected average price movement “Up or Down”, in percent. Trend traders should trade along the predicted direction of the Vector. The higher the value of the Vector the higher its momentum.
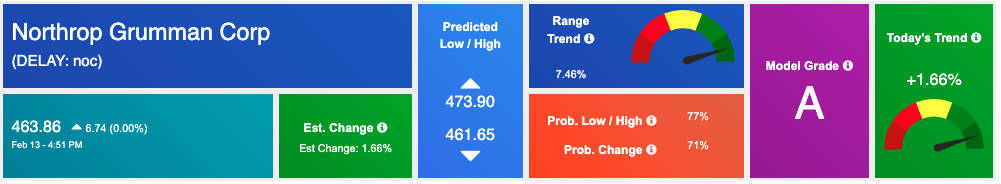
*Please note: At the time of publication Vlad Karpel does have a position in the featured symbol, noc. Our featured symbol is part of your free subscription service. It is not included in any paid Tradespoon subscription service. Vlad Karpel only trades his money in paid subscription services. If you are a paid subscriber, please review your Premium Member Picks, ActiveTrader, or MonthlyTrader recommendations. If you are interested in receiving Vlad’s picks, please click here.
West Texas Intermediate for Crude Oil delivery (CL.1) is priced at $79.16 per barrel, down 0.70%, at the time of publication.
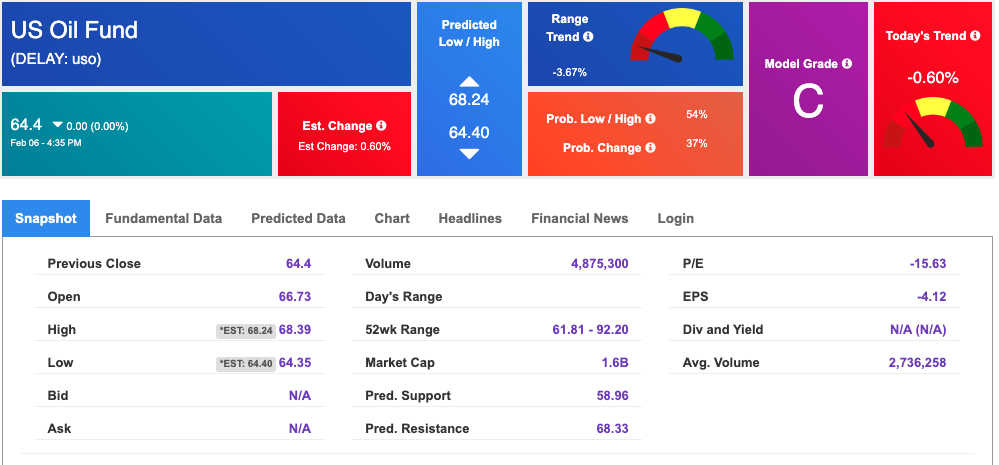
Looking at USO, a crude oil tracker, our 10-day prediction model shows mixed signals. The fund is trading at $64.4 at the time of publication. Prediction data is uploaded after the market close at 6 p.m., CST. Today’s data is based on market signals from the previous trading session.
The price for the Gold Continuous Contract (GC00) is up 0.05% at $1864.50 at the time of publication.
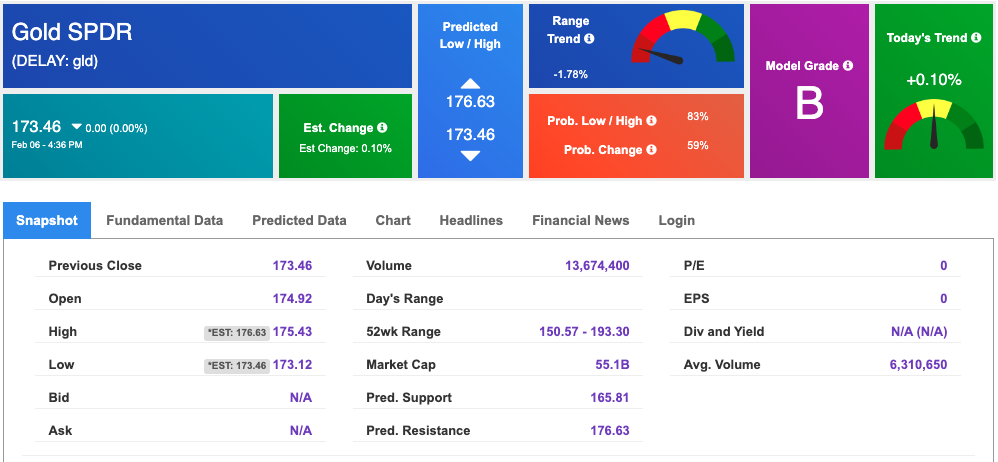
Using SPDR GOLD TRUST (GLD) as a tracker in our Stock Forecast Tool, the 10-day prediction window shows mixed signals. The gold proxy is trading at $173.46 at the time of publication. Vector signals show +0.10% for today. Prediction data is uploaded after the market close at 6 p.m., CST. Today’s data is based on market signals from the previous trading session.
The yield on the 10-year Treasury note is down at 3.705% at the time of publication.
The yield on the 30-year Treasury note is down at 3.779% at the time of publication.
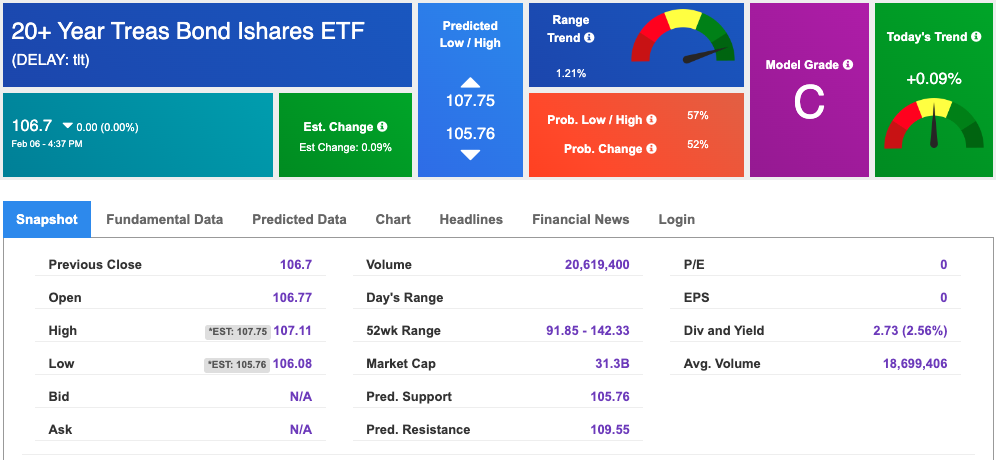
Using the iShares 20+ Year Treasury Bond ETF (TLT) as a proxy for bond prices in our Stock Forecast Tool, we see mixed signals in our 10-day prediction window. Prediction data is uploaded after the market close at 6 p.m., CST. Today’s data is based on market signals from the previous trading session.
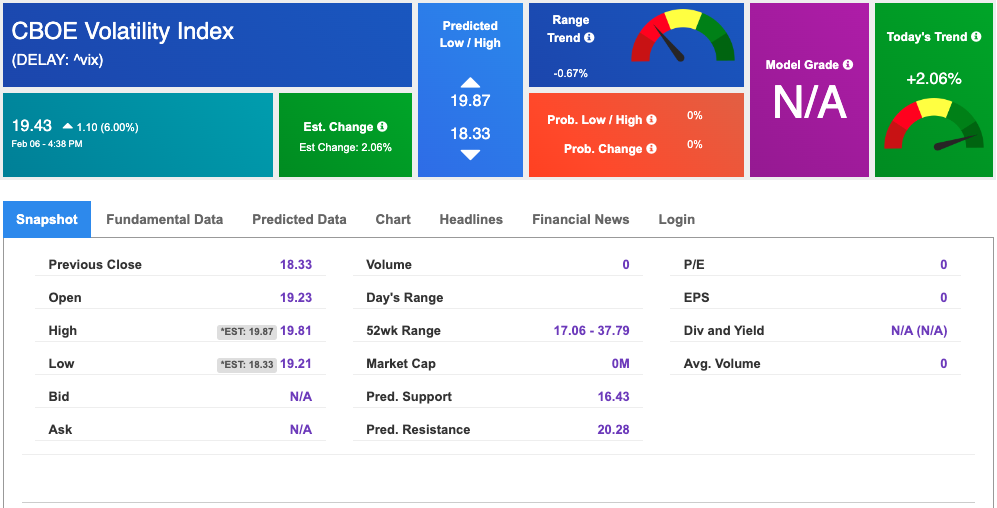
The CBOE Volatility Index (^VIX) is $19.43 at the time of publication, and our 10-day prediction window shows mixed signals. Prediction data is uploaded after the market close at 6 p.m., CST. Today’s data is based on market signals from the previous trading session.
Please share this Tradespoon Market Commentary with your friends.
![]()

![]()
Comments Off on


Tradespoon Tools make finding winning trades in minute as easy as 1-2-3.
Our simple 3 step approach has resulted in an average return of almost 20% per trade!

