 Sign Up for One-on-One Coaching and get our Premium Membership FREE for 1 Year!
CLICK HERE TO APPLY
Sign Up for One-on-One Coaching and get our Premium Membership FREE for 1 Year!
CLICK HERE TO APPLY
The stock market saw a hesitant climb on Monday as investors held their breath, anxiously awaiting the outcome of this week’s Federal Reserve meeting. Despite starting the day on a positive note, stocks struggled to maintain their upward trajectory as market participants braced for a week filled with central bank decisions. Nonetheless, amidst this cautious atmosphere, the S&P 500’s information-technology sector managed to stand out, closing the day with a modest 0.5% gain, outshining its peers.
This cautious sentiment follows a tumble in the S&P 500 on Friday, triggered by a perfect storm of stronger-than-expected economic data and soaring oil prices. These factors stoked concerns that inflation might linger above the Federal Reserve’s 2% target.
The week’s prevailing theme revolves around monetary policy, as the Federal Reserve, alongside other major central banks, prepares to unveil their interest-rate decisions. On Monday, the yield on 10-year Treasury notes continued its ascent, while the US dollar maintained its robust position, reflecting investors’ anticipation of sustained higher US interest rates.
The 10-year note yield hovered at 4.336% on Monday, a stone’s throw away from its recent peak at 4.37%—a level last seen in 2007. The US Dollar Index held firm at 105.25, remaining within striking distance of its 2023 pinnacle of 105.66, attained back in March.
Meanwhile, the stocks of major automakers, including General Motors, Ford, and Stellantis, faced downward pressure on Monday. A labor strike initiated on Friday by workers demanding higher pay and enhanced benefits continued to take its toll after negotiations with the United Auto Workers union faltered. Interestingly, even Tesla Inc. couldn’t escape the turmoil, witnessing a 3.3% decline as it failed to garner the anticipated support from the labor strike.
While the broader market grappled with uncertainty, the energy sector emerged as the day’s standout performer during midday trading. Seven out of the 11 S&P sectors, including Industrials and Communication Services, posted gains, with the energy sector surging by an impressive 1.13%. This remarkable performance was underpinned by supply cuts from Saudi Arabia, which bolstered oil prices.
Tech stocks witnessed a mixed bag of results on Monday. Chip design firm Arm Holdings saw its shares fall by 4.5% to $58 following its recent trading debut. Other chip makers displayed a spectrum of outcomes: Nvidia inched up by 0.15%, Intel advanced by 0.3%, and US-listed shares of Taiwan Semiconductor Manufacturing slid by 0.5%. In contrast, Micron Technology rose by 0.9% after receiving an upgrade to Buy from Hold at Deutsche Bank.
In another sign of economic unease, homebuilder confidence dipped in September to its lowest level in five months. Persistent high mortgage rates eroded buyer demand, leading to a 5-point drop in the National Association of Home Builders’ monthly confidence index, which now stands at 45. This decline surpassed economists’ expectations, who had forecasted only a marginal dip to 49.5.
Several prominent companies experienced mixed fortunes on Monday. Lyft slipped by 4% after the Securities and Exchange Commission announced a $10 million penalty due to the ride-hailing company’s failure to disclose a significant stock transaction before its initial public offering. DoorDash, a food delivery service, held steady after receiving an upgrade to Buy from Neutral at Mizuho. Conversely, PayPal Holdings fell by 2% as MoffettNathanson downgraded the payments company to Market Perform from Outperform. Additionally, Clorox experienced a 2.4% decline as the cleaning products manufacturer revealed that a cyberattack, confirmed in mid-August, would weigh on its first-quarter financial results.
Recent market movements have raised red flags about potential turbulence in the latter part of this year. The central focus of last week had been on the Consumer Price Index (CPI) data, which delivered an unexpected shock. When we consider this surprise in conjunction with the Producer Price Index (PPI) data and the European Central Bank’s (ECB) decision, it becomes apparent that market volatility may be on the horizon.
In light of these developments, I have opted to pivot toward a market-neutral stance, influenced by economic indicators that point to a low likelihood of a recession. While I maintain a watchful eye, it’s important to note that the SPY rally could encounter resistance within the $450 to $470 range. Furthermore, there are robust support levels to be found between $400 and $430 in the coming months, indicating a prevailing inclination for potential downward movement. The ongoing retest of August lows serves as a stark reminder of the current mood in the market. For reference, the SPY Seasonal Chart is shown below:
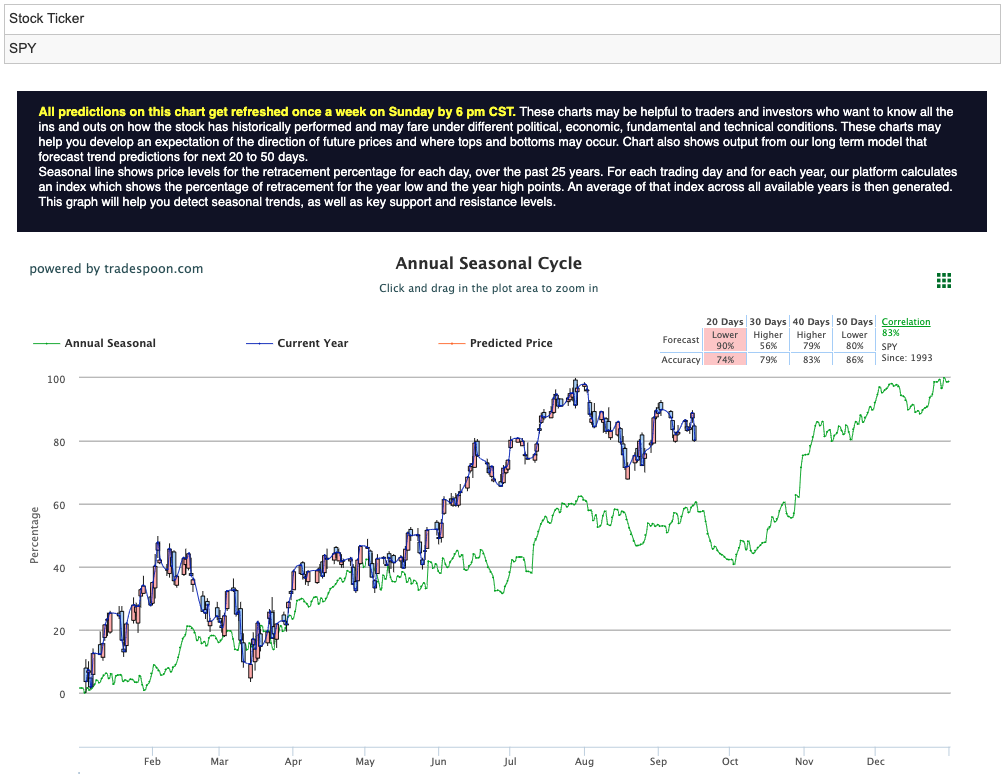
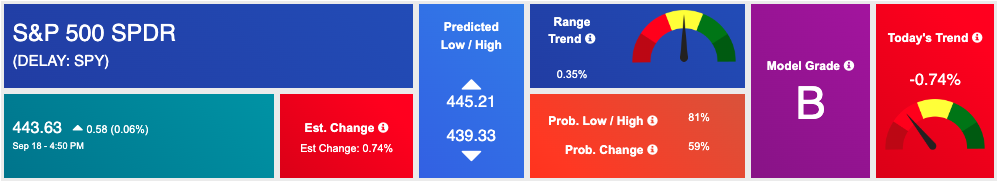
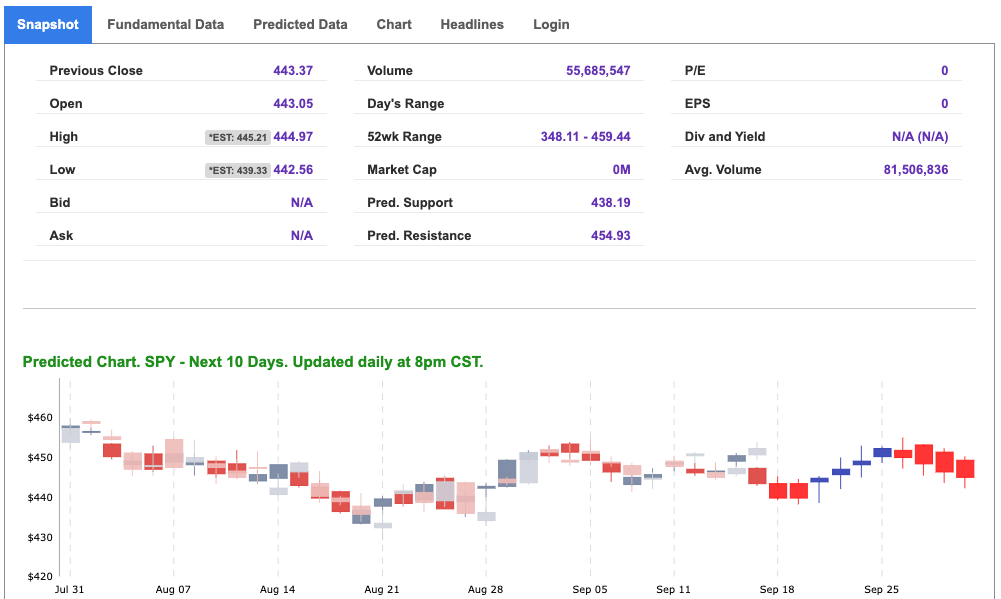
Using the “SPY” symbol to analyze the S&P 500 our 10-day prediction window shows a near-term positive outlook. Prediction data is uploaded after the market closes at 6 p.m. CST. Today’s data is based on market signals from the previous trading session.
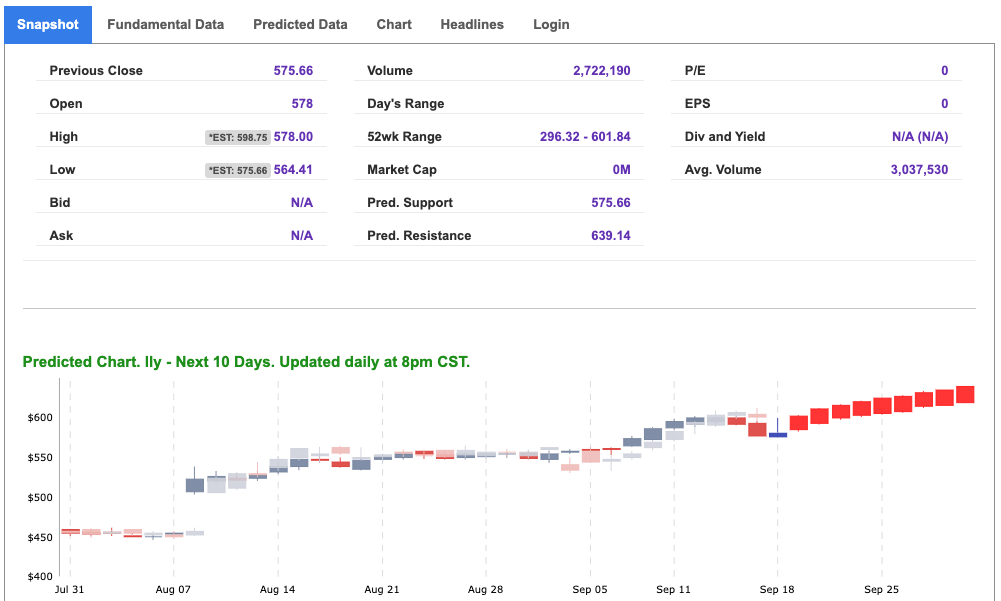
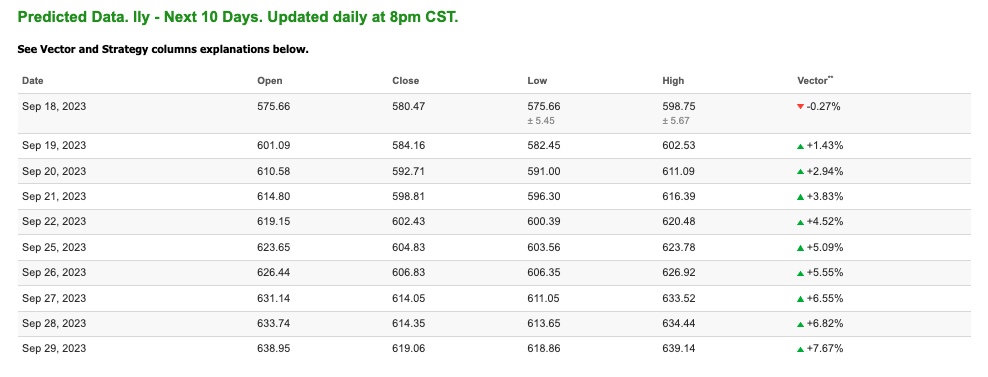
Note: The Vector column calculates the change of the Forecasted Average Price for the next trading session relative to the average of actual prices for the last trading session. The column shows the expected average price movement “Up or Down”, in percent. Trend traders should trade along the predicted direction of the Vector. The higher the value of the Vector the higher its momentum.
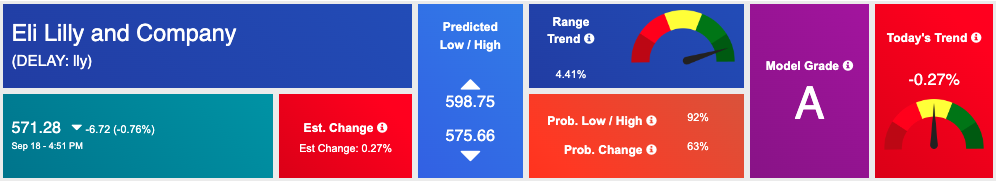
*Please note: At the time of publication Vlad Karpel does NOT have a position in the featured symbol, lly. Our featured symbol is part of your free subscription service. It is not included in any paid Tradespoon subscription service. Vlad Karpel only trades his money in paid subscription services. If you are a paid subscriber, please review your Premium Member Picks, ActiveTrader, or MonthlyTrader recommendations. If you are interested in receiving Vlad’s picks, please click here.
West Texas Intermediate for Crude Oil delivery (CL.1) is priced at $92.31 per barrel, up 0.91%, at the time of publication.
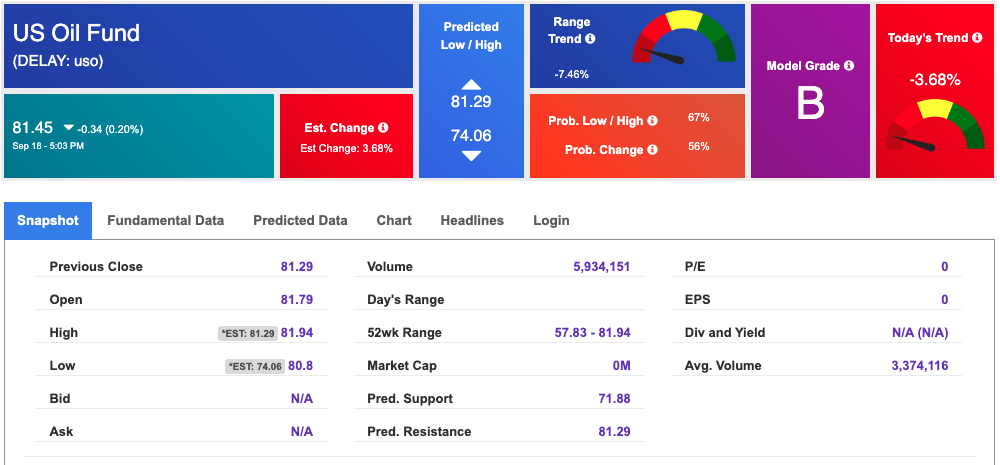
Looking at USO, a crude oil tracker, our 10-day prediction model shows mixed signals. The fund is trading at $81.45 at the time of publication. Prediction data is uploaded after the market close at 6 p.m., CST. Today’s data is based on market signals from the previous trading session.
The price for the Gold Continuous Contract (GC00) is up 0.09% at $1955.10 at the time of publication.

Using SPDR GOLD TRUST (GLD) as a tracker in our Stock Forecast Tool, the 10-day prediction window shows mixed signals. The gold proxy is trading at $179.39 at the time of publication. Vector signals show -0.04% for today. Prediction data is uploaded after the market close at 6 p.m., CST. Today’s data is based on market signals from the previous trading session.
The yield on the 10-year Treasury note is up at 4.303% at the time of publication.
The yield on the 30-year Treasury note is up at 4.383% at the time of publication.
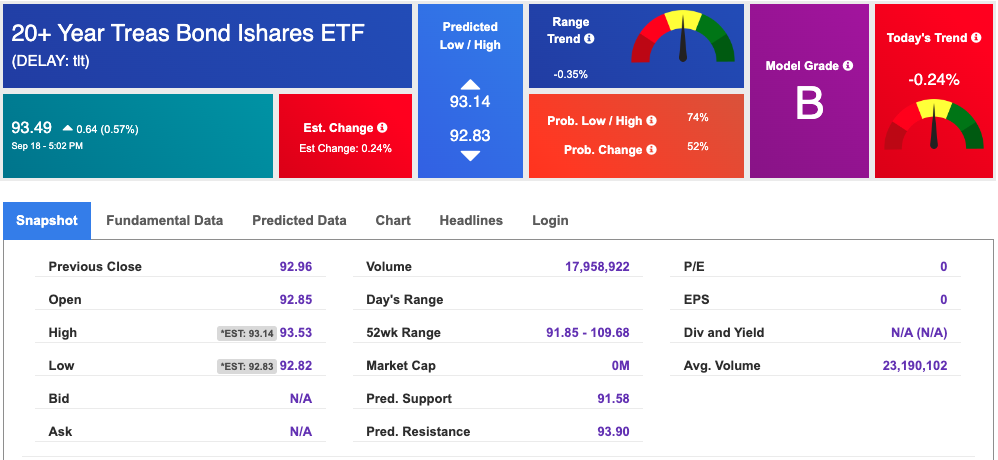
Using the iShares 20+ Year Treasury Bond ETF (TLT) as a proxy for bond prices in our Stock Forecast Tool, we see mixed signals in our 10-day prediction window. Prediction data is uploaded after the market close at 6 p.m., CST. Today’s data is based on market signals from the previous trading session.
The CBOE Volatility Index (^VIX) is priced at $14.00, up 1.52% at the time of publication, and our 10-day prediction window shows mixed signals. Prediction data is uploaded after the market close at 6 p.m., CST. Today’s data is based on market signals from the previous trading session.
Please share this Tradespoon Market Commentary with your friends.
![]()

![]()
Comments Off on


Tradespoon Tools make finding winning trades in minute as easy as 1-2-3.
Our simple 3 step approach has resulted in an average return of almost 20% per trade!

