 Sign Up for One-on-One Coaching and get our Premium Membership FREE for 1 Year!
CLICK HERE TO APPLY
Sign Up for One-on-One Coaching and get our Premium Membership FREE for 1 Year!
CLICK HERE TO APPLY
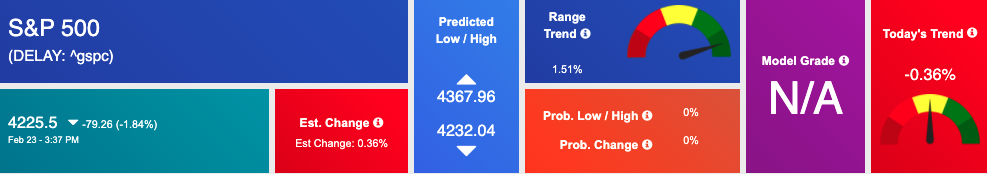
The VIX is trading higher today, near the 30 mark as all three major U.S. indices closed in the red. The geopolitical risks in Ukraine, as well as this week’s earnings, could influence the market’s next move. The SPY’s crucial support levels are currently at $420 and then $400, which we’re keeping an eye on. The $SPY Overhead resistance is at $460. We expect the market to pull back further and restart the rebound in the next 1-2 months. The Dow dropped 465 points, narrowly avoiding a correction, as the Ukraine crisis escalates. According to the Associated Press, Russian forces stationed along Ukraine’s borders are “as prepared as they can be,” should they be ordered to begin an attack. A senior U.S. defense official in Washington stated that Russian troops have positioned themselves along Ukraine’s eastern frontier with Russia and Belarus with over 150,000 troops.
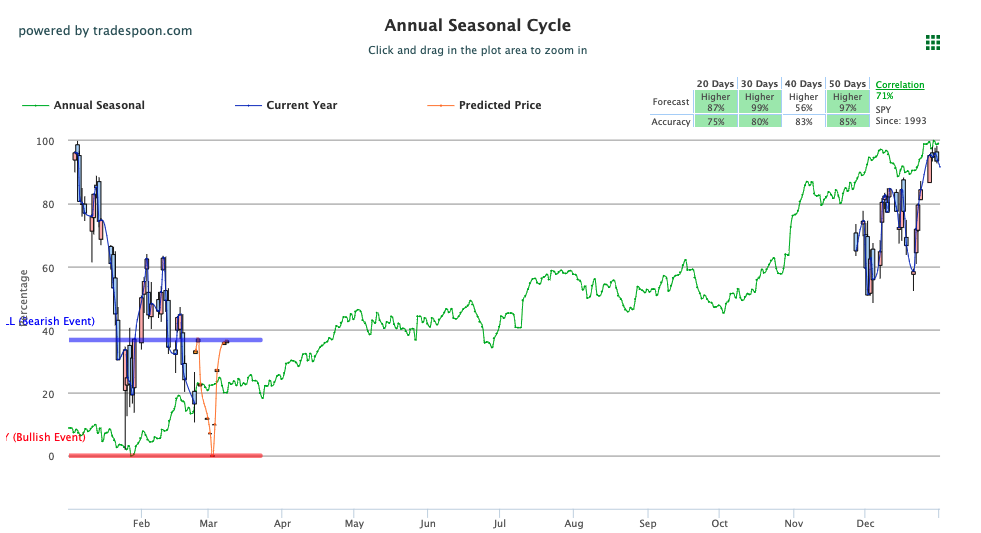
This week’s key economic reports include Q4 GDP and January new home sales, due tomorrow, as well as monthly income, inflation, and consumer spending. TJX saw shares drop following their earnings release while Overstock shares soared. Earnings were primarily retail-oriented with Macy’s, Home Depot, and Lowe’s releasing Q4 data while tomorrow look for Alibaba, Block, and Keurig Dr Pepper. Globally, Asian markets closed in the green while European markets finished lower. We encourage all market commentary readers to maintain clearly defined stop levels for all positions. For reference, the SPY Seasonal Chart is shown below:
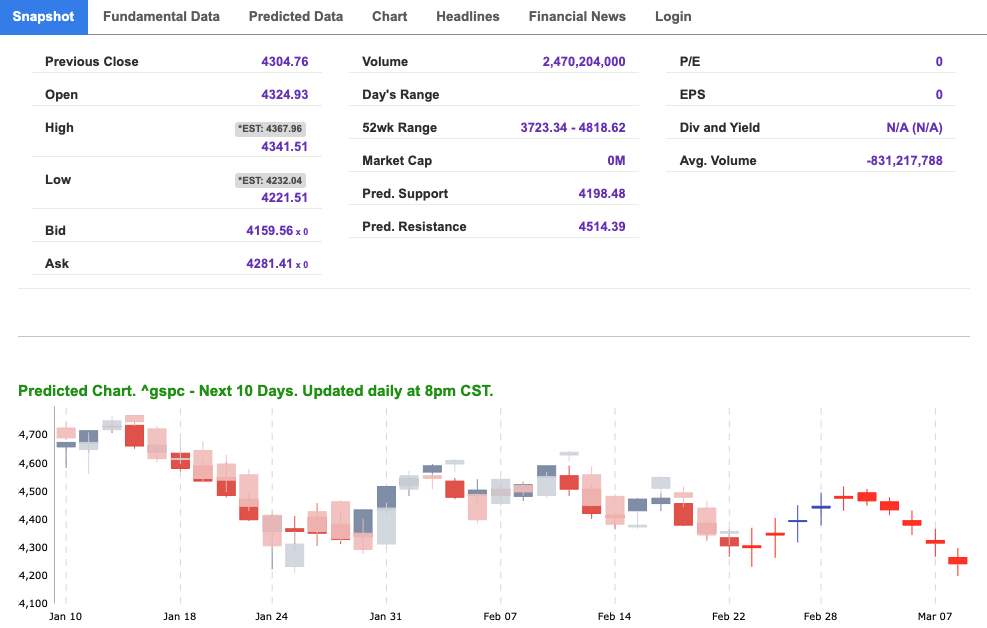
Using the “^GSPC” symbol to analyze the S&P 500 our 10-day prediction window shows a near-term mixed outlook. Prediction data is uploaded after the market closes at 6 p.m. CST. Today’s data is based on market signals from the previous trading session.
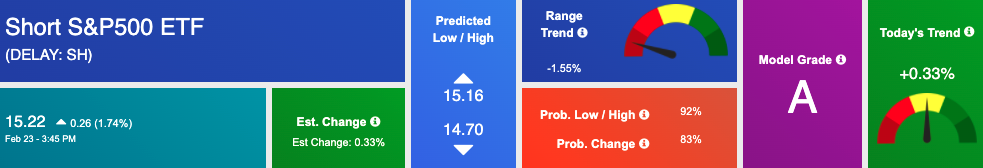
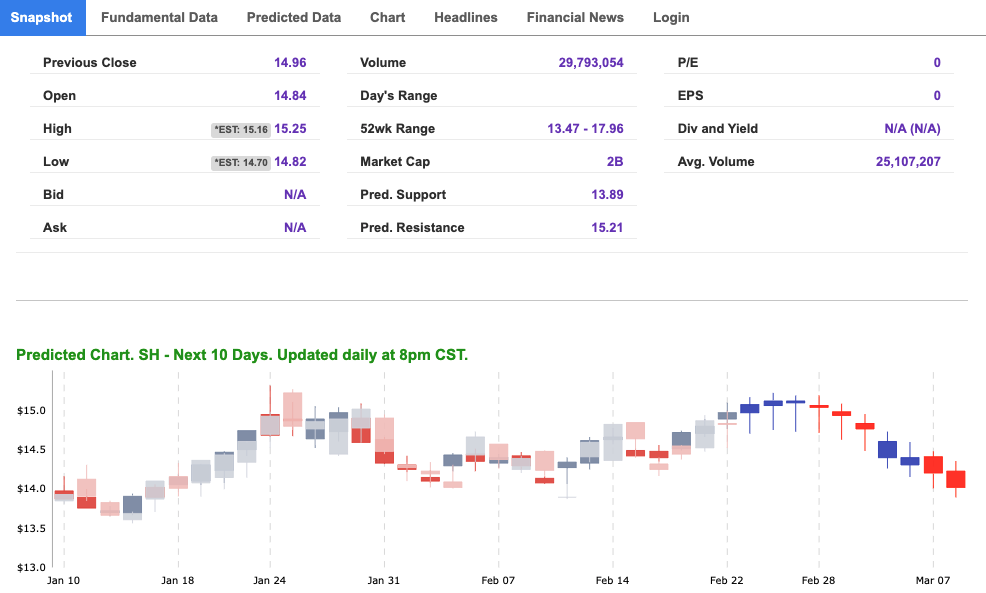
The symbol is trading at $15.22 with a vector of +0.33% at the time of publication.
10-Day Prediction data is uploaded after the market close at 6 p.m., CST. Today’s data is based on market signals from the previous trading session.
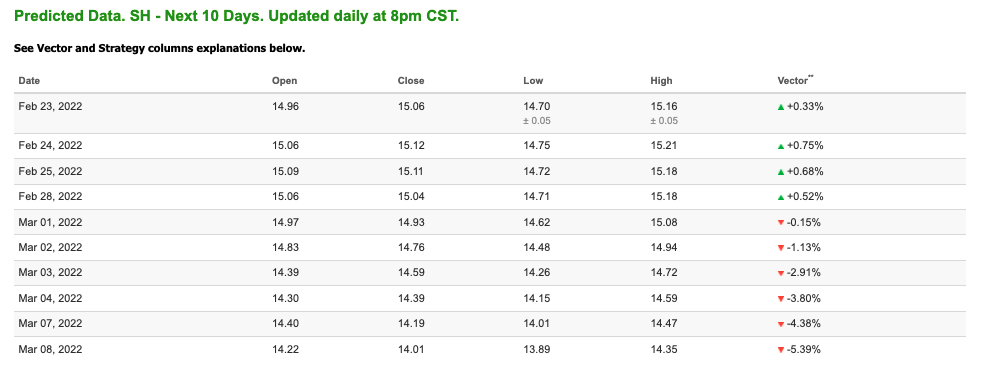
Note: The Vector column calculates the change of the Forecasted Average Price for the next trading session relative to the average of actual prices for the last trading session. The column shows the expected average price movement “Up or Down”, in percent. Trend traders should trade along the predicted direction of the Vector. The higher the value of the Vector the higher its momentum.
*Please note: At the time of publication Vlad Karpel does have a position in the featured symbol, SH. Our featured symbol is part of your free subscription service. It is not included in any paid Tradespoon subscription service. Vlad Karpel only trades his money in paid subscription services. If you are a paid subscriber, please review your Premium Member Picks, ActiveTrader, or MonthlyTrader recommendations. If you are interested in receiving Vlad’s picks, please click here.
West Texas Intermediate for Crude Oil delivery (CL.1) is priced at $92.24 per barrel, down 0.12% at the time of publication.
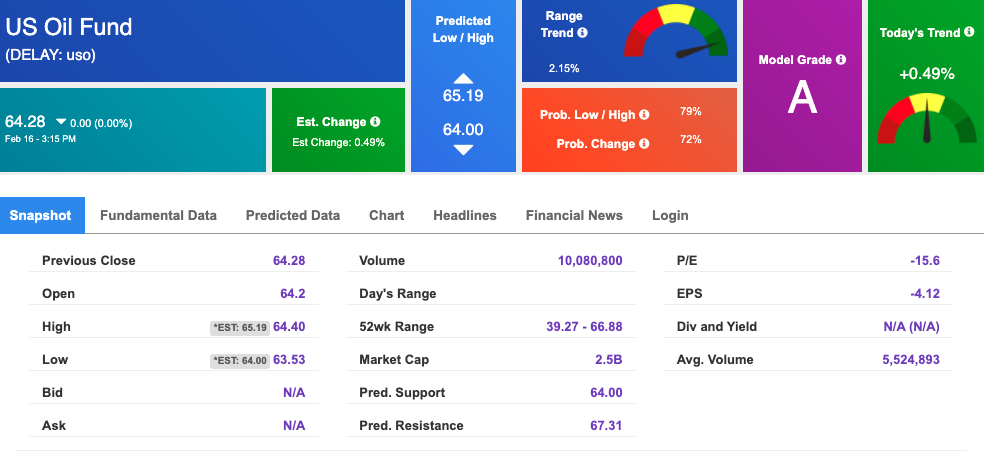
Looking at USO, a crude oil tracker, our 10-day prediction model shows mixed signals. The fund is trading at $64.28 at the time of publication. Prediction data is uploaded after the market close at 6 p.m., CST. Today’s data is based on market signals from the previous trading session.
The price for the Gold Continuous Contract (GC00) is up 0.18% at $1910.90 at the time of publication.
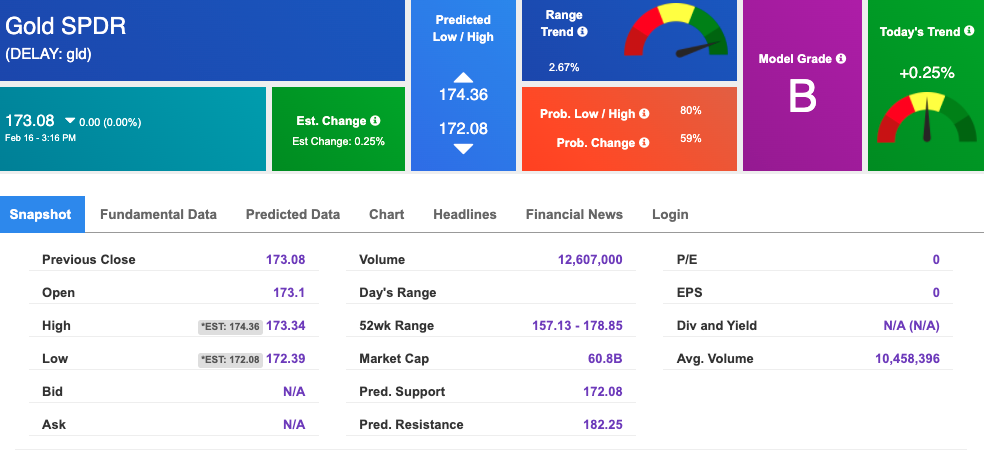
Using SPDR GOLD TRUST (GLD) as a tracker in our Stock Forecast Tool, the 10-day prediction window shows mixed signals. The gold proxy is trading at $173.08 at the time of publication. Vector signals show +0.25% for today. Prediction data is uploaded after the market close at 6 p.m., CST. Today’s data is based on market signals from the previous trading session.
The yield on the 10-year Treasury note is up, at 1.997% at the time of publication.
The yield on the 30-year Treasury note is up, at 2.299% at the time of publication.
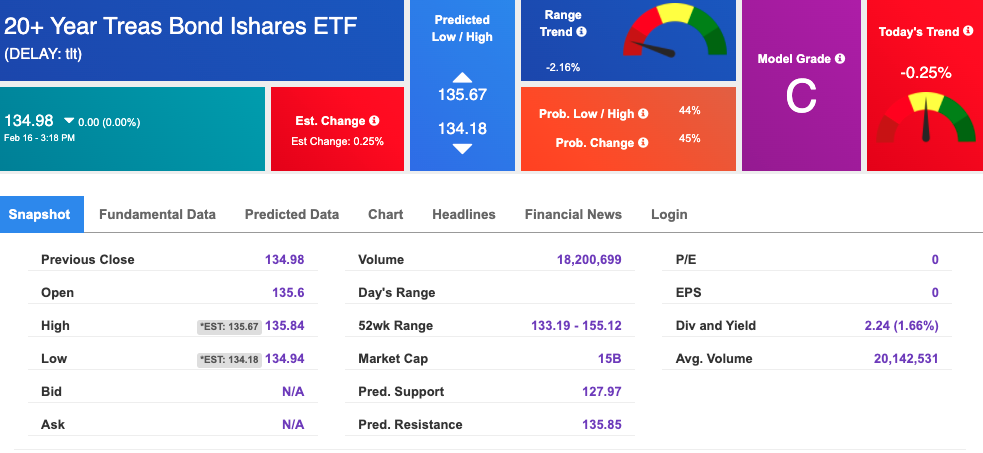
Using the iShares 20+ Year Treasury Bond ETF (TLT) as a proxy for bond prices in our Stock Forecast Tool, we see mixed signals in our 10-day prediction window. Prediction data is uploaded after the market close at 6 p.m., CST. Today’s data is based on market signals from the previous trading session.
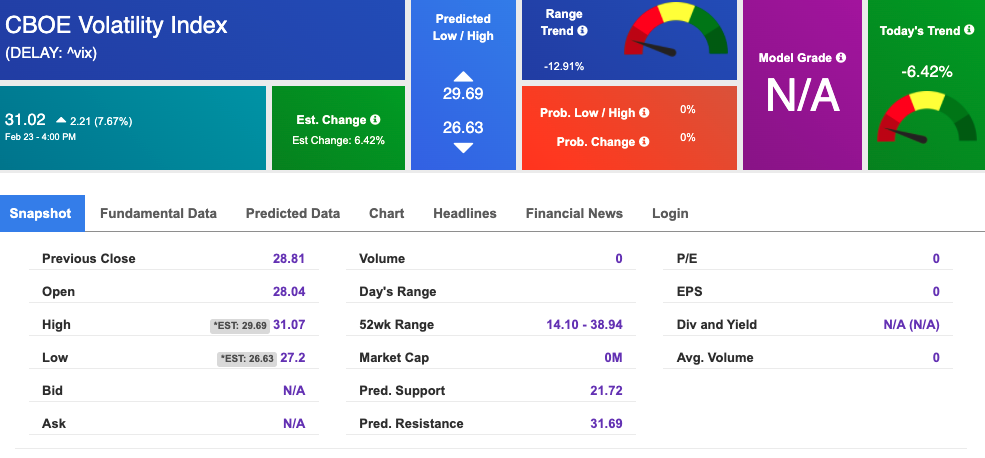
The CBOE Volatility Index (^VIX) is $31.02 at the time of publication, and our 10-day prediction window shows mixed signals. Prediction data is uploaded after the market close at 6 p.m., CST. Today’s data is based on market signals from the previous trading session.
Please share this Tradespoon Market Commentary with your friends.
![]()

![]()
Comments Off on


Tradespoon Tools make finding winning trades in minute as easy as 1-2-3.
Our simple 3 step approach has resulted in an average return of almost 20% per trade!

