 Special Offer: Try the 'Elite Trading Circle Membership' for ONLY $37!
CLICK HERE TO LEARN MORE
Special Offer: Try the 'Elite Trading Circle Membership' for ONLY $37!
CLICK HERE TO LEARN MORE
Stocks had a slow start but managed to gain ground as investors analyzed the latest retail sales data on Wednesday. While the market’s focus remains on finding indications that inflation is cooling down enough for the Federal Reserve to halt interest rate hikes, fears of recession have temporarily cooled. Retail sales showed an impressive surge in January, which could be concerning for the Fed’s plans. Additionally, the stock and bond markets are seeing increased, reactive action; however, neither has broken in either direction yet. Roku and Cisco stocks saw their shares rally after better-than-expected earnings data were released. On the other hand, the oil market continues to decline due to concerns that the Federal Reserve will maintain higher interest rates. Meanwhile, cryptocurrencies are rallying even as stocks slide.
Today’s marquee data point was the latest retail report. In January, retail sales surpassed expectations, indicating that, despite a tough macroeconomic climate, consumer demand remains robust. Retail sales increased by 3% from the previous month, reaching a total of $697 billion; this exceeded the anticipated 1.7% growth. Excluding the volatile spending categories of vehicles and gas, sales still showed a significant increase of 2.6%, surpassing the predicted rise of 0.45%. Following yesterday’s highly-anticipated release of the CPI data, it has been observed that consumer price growth is decreasing. However, the report suggested that progress in curbing inflation is slower than expected and that the path ahead may be uneven. This indicates that the Federal Reserve will need to continue its efforts to alleviate inflationary pressures.
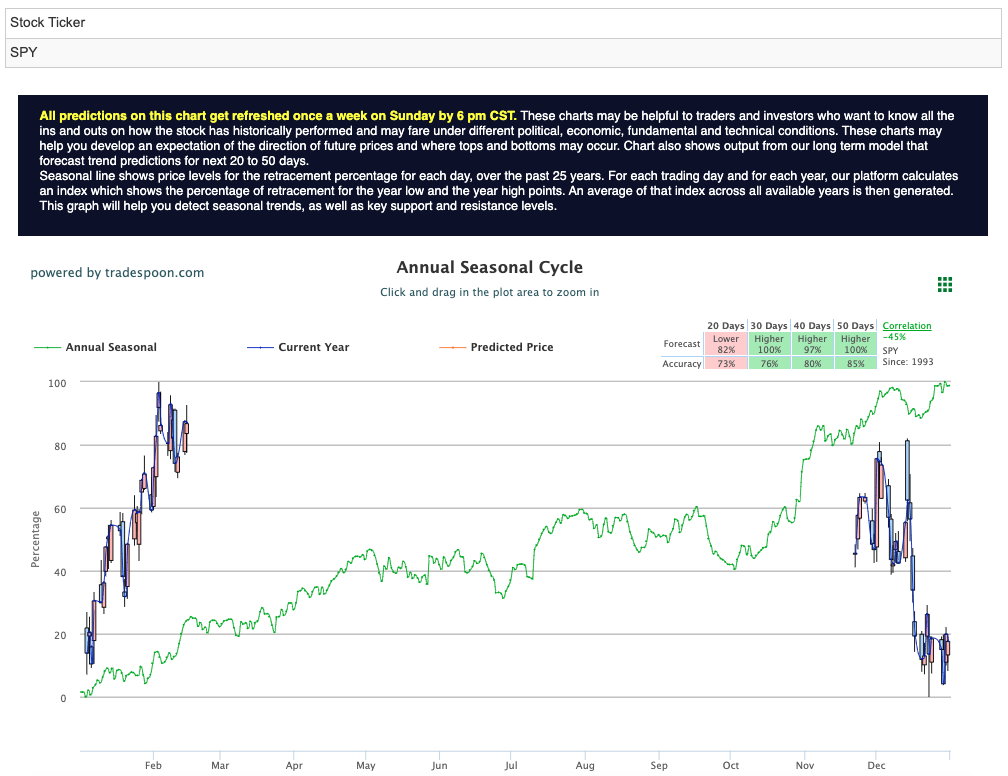
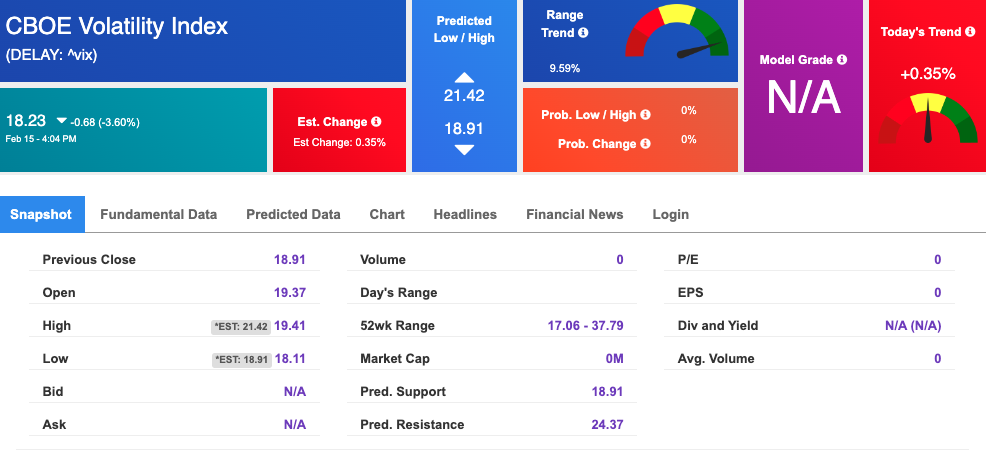
Moreover, the Consumer Price Index data for January revealed a smaller-than-anticipated decline in the annual rate of price growth, along with the most significant monthly increase in prices since June. This finding highlights the challenge of containing inflationary forces in the current economic environment. With this in mind, the current trading level for the $VIX is approximately $18. The upcoming earnings reports for $TTD, $ABNB, and $DVN, as well as the retail data, are expected to impact the market’s next move. We are closely monitoring the SPY’s overhead resistance levels, which are currently at $420 and $430, respectively. On the other hand, the $SPY support levels are at $410 and $402.
For the next two to eight weeks, we anticipate the market to trade sideways. Therefore, we recommend taking a market-neutral position and advise our readers to hedge their positions accordingly. Globally, European markets finished in the green while Asian markets finished unanimously in the red. Market commentary readers should maintain clearly defined stop levels for all positions. For reference, the SPY Seasonal Chart is shown below:
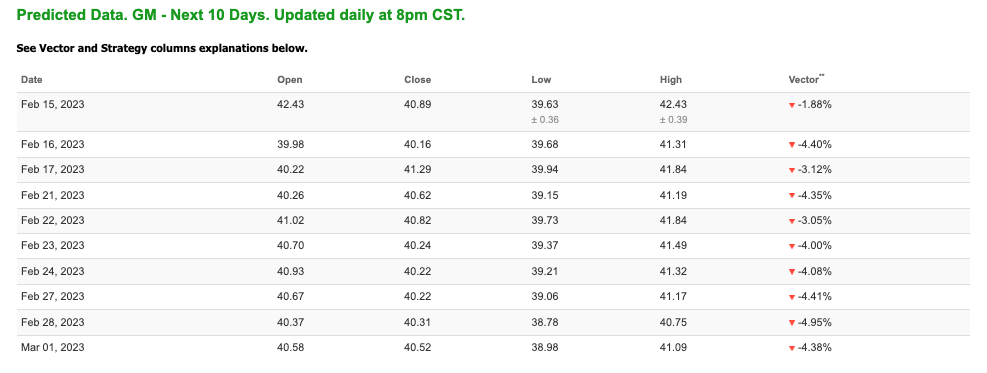
Note: The Vector column calculates the change of the Forecasted Average Price for the next trading session relative to the average of actual prices for the last trading session. The column shows the expected average price movement “Up or Down”, in percent. Trend traders should trade along the predicted direction of the Vector. The higher the value of the Vector the higher its momentum.
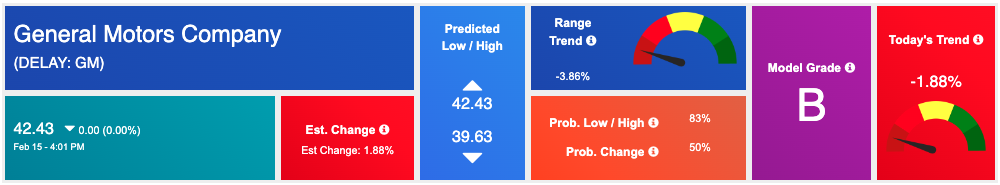
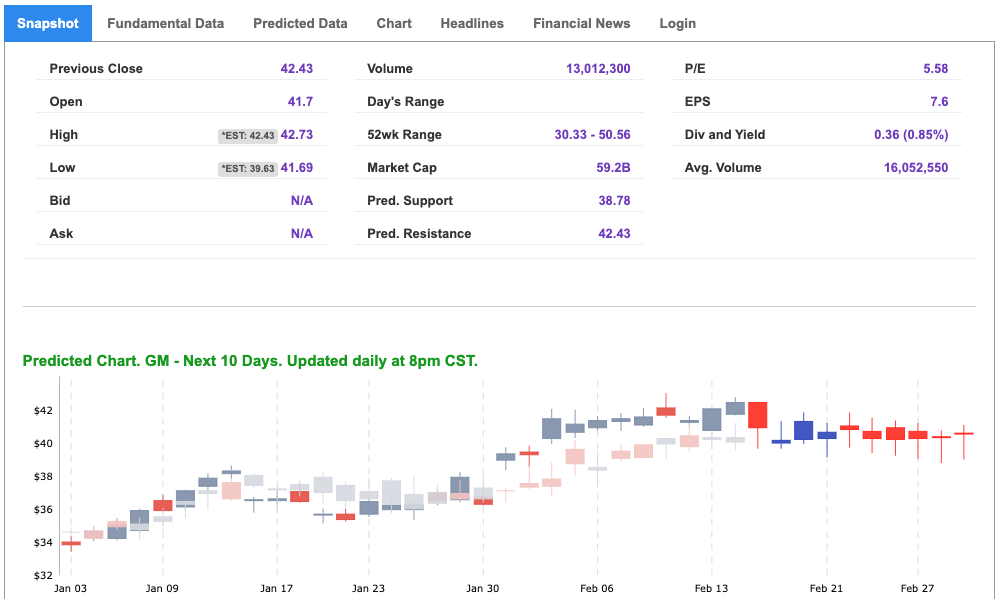
*Please note: At the time of publication Vlad Karpel does have a position in the featured symbol, gm. Our featured symbol is part of your free subscription service. It is not included in any paid Tradespoon subscription service. Vlad Karpel only trades his money in paid subscription services. If you are a paid subscriber, please review your Premium Member Picks, ActiveTrader, or MonthlyTrader recommendations. If you are interested in receiving Vlad’s picks, please click here.
West Texas Intermediate for Crude Oil delivery (CL.1) is priced at $78.51 per barrel, down 0.70%, at the time of publication.
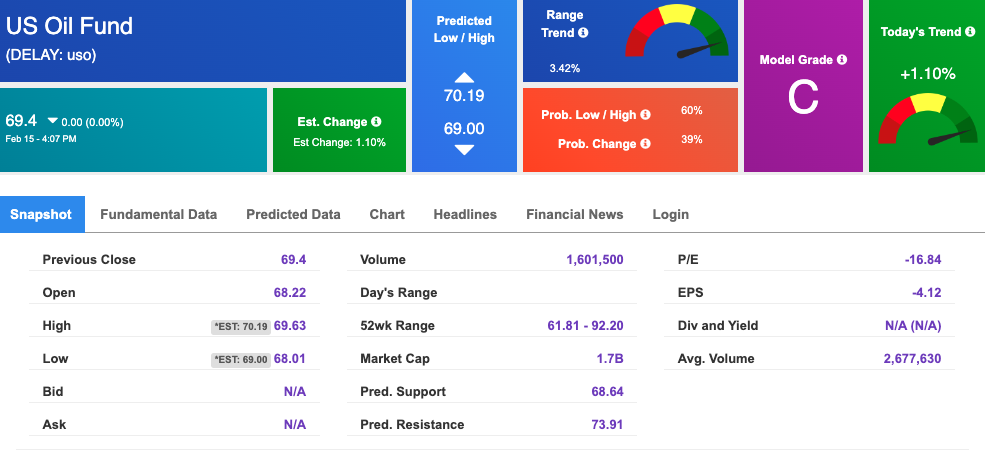
Looking at USO, a crude oil tracker, our 10-day prediction model shows mixed signals. The fund is trading at $69.4 at the time of publication. Prediction data is uploaded after the market close at 6 p.m., CST. Today’s data is based on market signals from the previous trading session.
The price for the Gold Continuous Contract (GC00) is down 1.01% at $1846.50 at the time of publication.
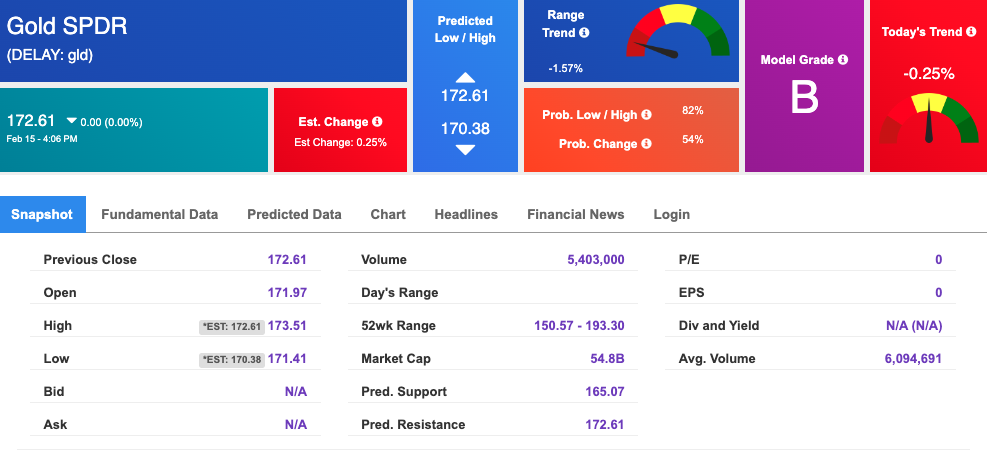
Using SPDR GOLD TRUST (GLD) as a tracker in our Stock Forecast Tool, the 10-day prediction window shows mixed signals. The gold proxy is trading at $172.61 at the time of publication. Vector signals show -0.25% for today. Prediction data is uploaded after the market close at 6 p.m., CST. Today’s data is based on market signals from the previous trading session.
The yield on the 10-year Treasury note is up at 3.807% at the time of publication.
The yield on the 30-year Treasury note is up at 3.841% at the time of publication.
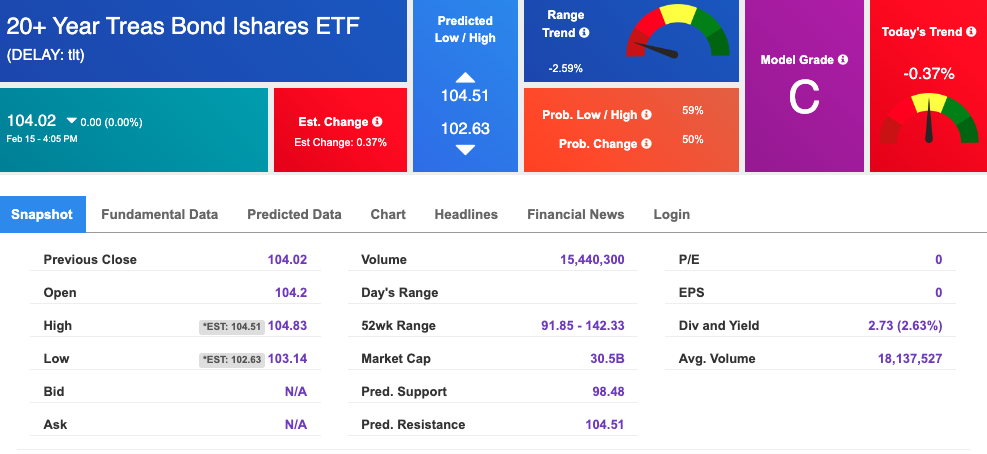
Using the iShares 20+ Year Treasury Bond ETF (TLT) as a proxy for bond prices in our Stock Forecast Tool, we see mixed signals in our 10-day prediction window. Prediction data is uploaded after the market close at 6 p.m., CST. Today’s data is based on market signals from the previous trading session.
The CBOE Volatility Index (^VIX) is $18.23 at the time of publication, and our 10-day prediction window shows mixed signals. Prediction data is uploaded after the market close at 6 p.m., CST. Today’s data is based on market signals from the previous trading session.
Please share this Tradespoon Market Commentary with your friends.
![]()

![]()
Comments Off on


Tradespoon Tools make finding winning trades in minute as easy as 1-2-3.
Our simple 3 step approach has resulted in an average return of almost 20% per trade!