 Sign Up for One-on-One Coaching and get our Premium Membership FREE for 1 Year!
CLICK HERE TO APPLY
Sign Up for One-on-One Coaching and get our Premium Membership FREE for 1 Year!
CLICK HERE TO APPLY
With China in the midst of protests pressuring global markets, U.S. shares lowered today as Federal officials see the necessity for more rate hikes. All three major U.S. indices closed in the red with the Dow dropping 500 points as Nasdaq and S&P lower 1.5% today. Last week, for the second time in three weeks, U.S. stocks booked weekly gains while on Monday stocks reversed course. Overseas, Asian markets were pressured by the latest COVID-related shutdowns and protests. Additionally, U.S. oil prices bounced back from their recent lows. Gold and the dollar, which traditionally trade inversely, were also up today.
This week is set to be a big one for U.S. economic data, with several key reports and announcements coming out. On Wednesday, we’ll get revised data on the third-quarter gross domestic product, along with the Fed’s Beige Book report. Federal Reserve chair Jerome Powell will also give a speech that day. Then on Thursday, we’ll get the closely watched inflation gauge PCE reports, with November employment data set for Friday.
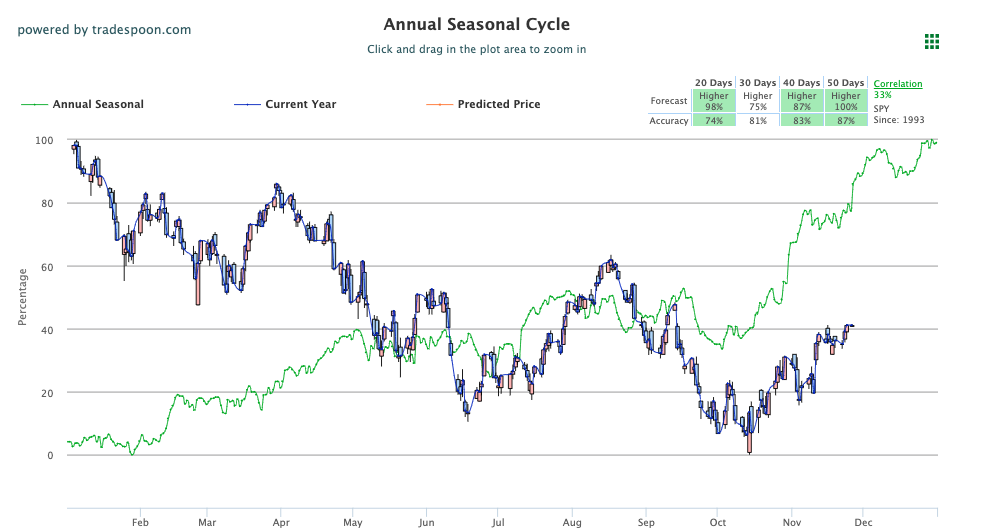
This week’s earnings from $CRWD, $NTAP, and $INTU – as well as GDP and unemployment numbers – can help shape the market’s next move. With the VIX currently trading near the $23 level, we are watching the overhead resistance levels in the SPY – at $400 and then $416. The $SPY support is at $390 and then $380. We expect the market to continue the current rally for the next 2-4 weeks. The short-term market is trading in the well-defined range. We advise subscribers to stay market neutral at this time and not attempt to profit from downward or upward swings. Market commentary readers should maintain clearly defined stop levels for all positions. For reference, the SPY Seasonal Chart is shown below:
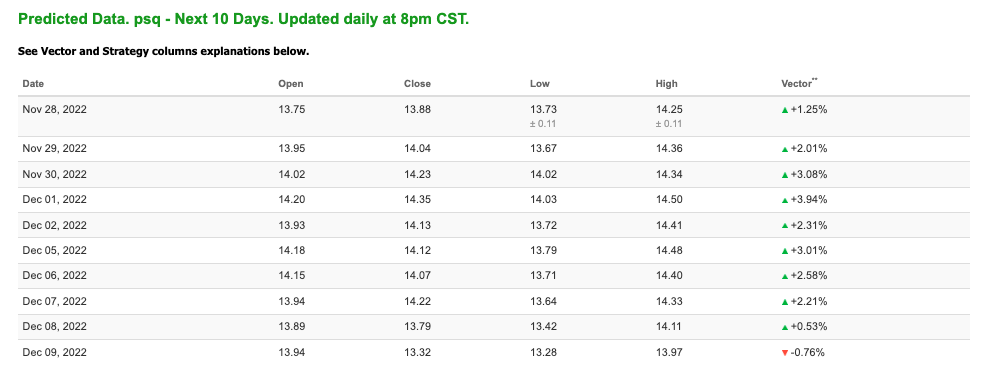
Note: The Vector column calculates the change of the Forecasted Average Price for the next trading session relative to the average of actual prices for the last trading session. The column shows the expected average price movement “Up or Down”, in percent. Trend traders should trade along the predicted direction of the Vector. The higher the value of the Vector the higher its momentum.
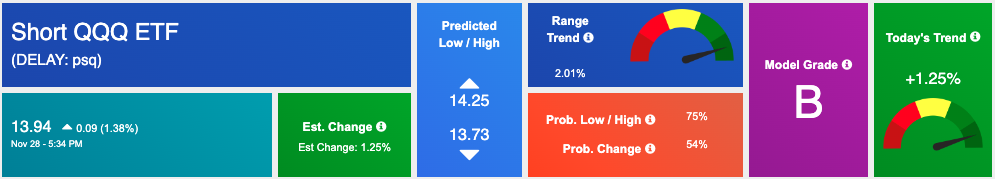
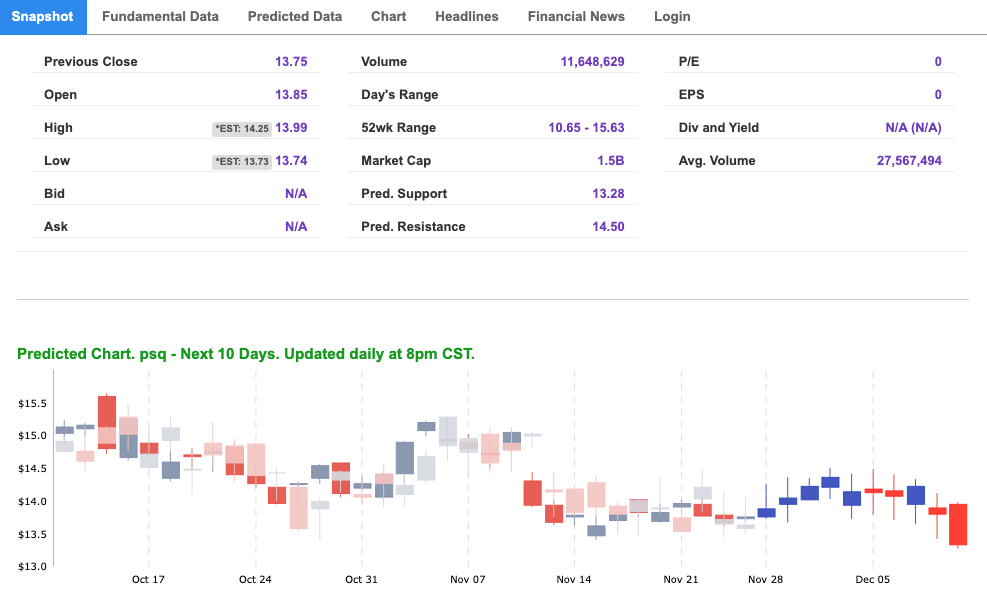
*Please note: At the time of publication Vlad Karpel does have a position in the featured symbol, PSQ. Our featured symbol is part of your free subscription service. It is not included in any paid Tradespoon subscription service. Vlad Karpel only trades his money in paid subscription services. If you are a paid subscriber, please review your Premium Member Picks, ActiveTrader, or MonthlyTrader recommendations. If you are interested in receiving Vlad’s picks, please click here.
West Texas Intermediate for Crude Oil delivery (CL.1) is priced at $76.62 per barrel, down 0.80%, at the time of publication.
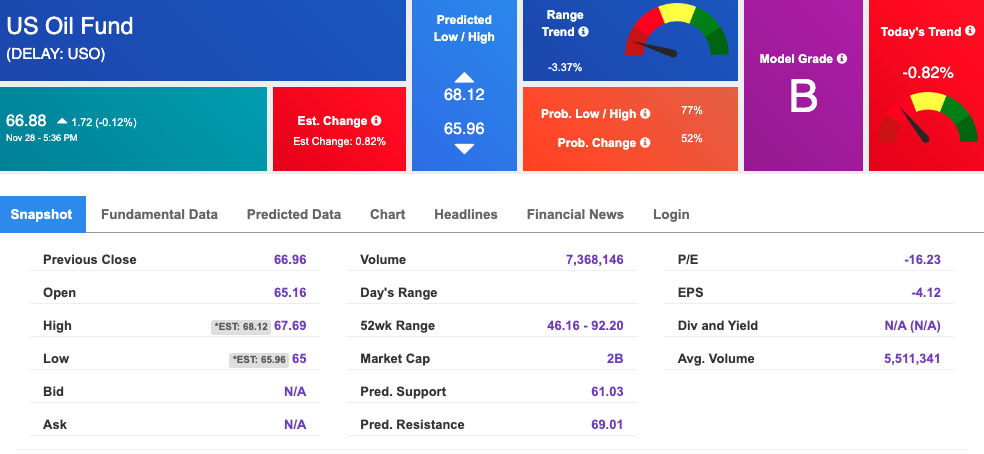
Looking at USO, a crude oil tracker, our 10-day prediction model shows mixed signals. The fund is trading at $66.88 at the time of publication. Prediction data is uploaded after the market close at 6 p.m., CST. Today’s data is based on market signals from the previous trading session.
The price for the Gold Continuous Contract (GC00) is up 0.03% at $1739.70 at the time of publication.
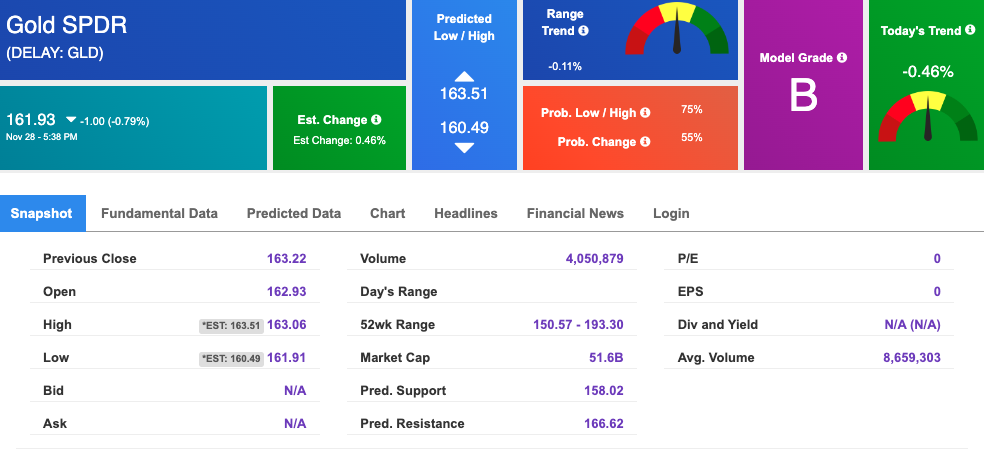
Using SPDR GOLD TRUST (GLD) as a tracker in our Stock Forecast Tool, the 10-day prediction window shows mixed signals. The gold proxy is trading at $161.93 at the time of publication. Vector signals show +0.46% for today. Prediction data is uploaded after the market close at 6 p.m., CST. Today’s data is based on market signals from the previous trading session.
The yield on the 10-year Treasury note is UP at 3.685% at the time of publication.
The yield on the 30-year Treasury note is DOWN at 3.725% at the time of publication.
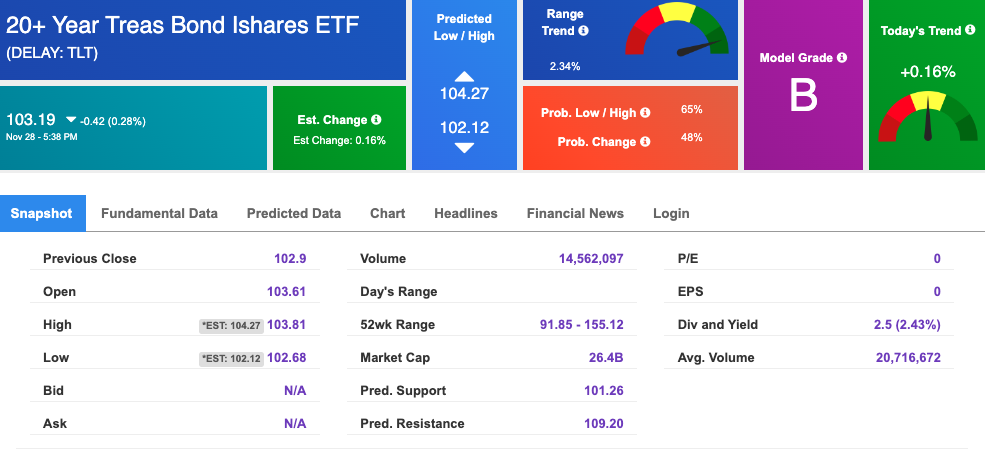
Using the iShares 20+ Year Treasury Bond ETF (TLT) as a proxy for bond prices in our Stock Forecast Tool, we see mixed signals in our 10-day prediction window. Prediction data is uploaded after the market close at 6 p.m., CST. Today’s data is based on market signals from the previous trading session.
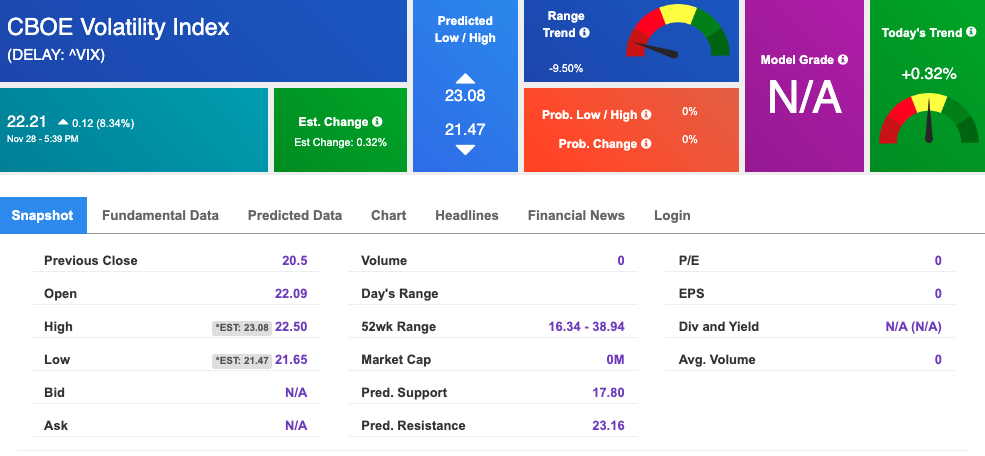
The CBOE Volatility Index (^VIX) is $22.21 at the time of publication, and our 10-day prediction window shows mixed signals. Prediction data is uploaded after the market close at 6 p.m., CST. Today’s data is based on market signals from the previous trading session.
Please share this Tradespoon Market Commentary with your friends.
![]()

![]()
Comments Off on


Tradespoon Tools make finding winning trades in minute as easy as 1-2-3.
Our simple 3 step approach has resulted in an average return of almost 20% per trade!