 Save Big on Commissions ($0.65 per Contract)
CLICK HERE TO LEARN MORE
Save Big on Commissions ($0.65 per Contract)
CLICK HERE TO LEARN MORE
On Wednesday, after Target announced disappointing profits for the holiday season and October retail sales indicated a pickup in activity, stocks in the U.S. slid as traders worried that this might lead to more interest rate hikes from the Federal Reserve. This week’s earnings reports from $NVDA, $BABA, and $CSCO – as well as Retail data – can influence the next move in the market. Although shares had an up-and-down start to the week, U.S. indices were able to book gains on Tuesday. Long-term yields also saw a decline today, which was a welcomed retreat after trading impossibly high.
Although the Federal Reserve is working to decelerate economic growth, consumer spending remains high after retail sales increased 1.3% last month. This, although a positive report, caused U.S. stocks to retreat as concern over a more active Fed began to mount. Apart from retail data, today’s biggest impact came from Target’s earnings report which saw shares drop over 13% following its Q3 data. In the report, the key figure which set the selloff was the abundance of inventory reported by the retail giant. This impacted similar-retail brands and will be a point of focus going into the holiday season.
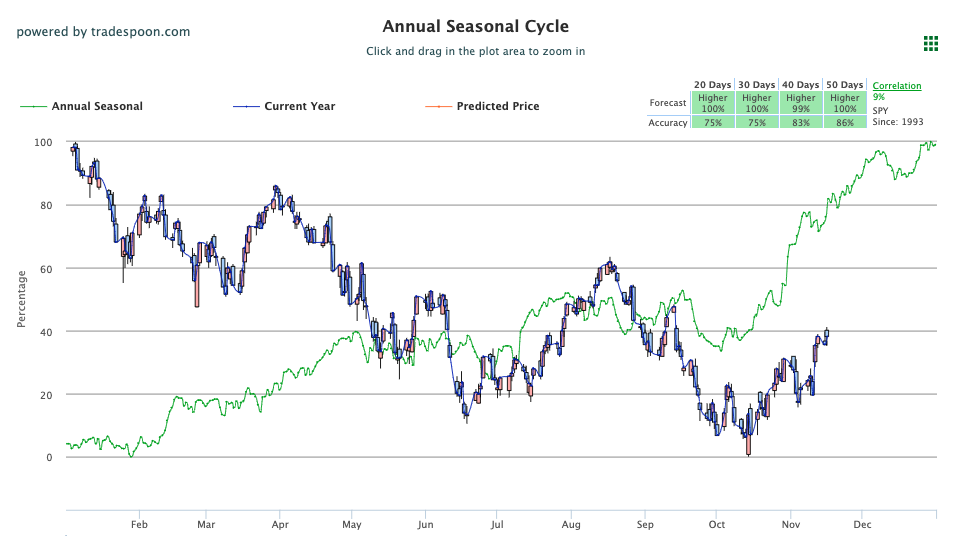
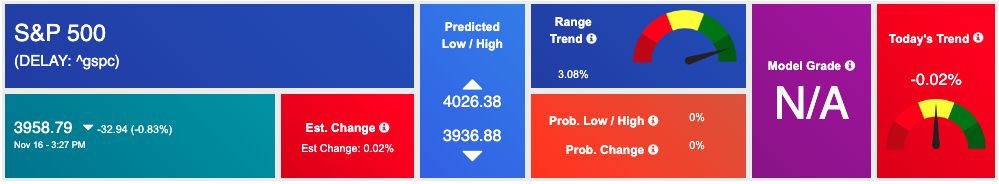
Looking at the lowest levels in the market, the volatility index, $VIX, sold off today trading near the $24-$25. We need to keep an eye on the SPY’s overhead resistance levels, which are currently at $400 and then $416. The support for the SPY is $390 and then $380. The market, while overbought, is predicted to remain stable for the next few weeks, but it could experience a small dip. We recommend staying neutral and not chasing the market either upwards or downwards during this time. Globally, Asian markets closed to mixed results while European markets finished in the red. Market commentary readers should maintain clearly defined stop levels for all positions. For reference, the SPY Seasonal Chart is shown below:
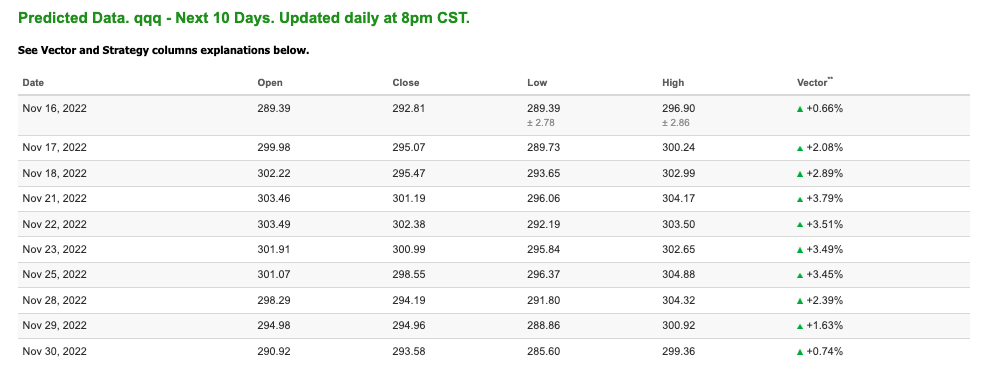
Note: The Vector column calculates the change of the Forecasted Average Price for the next trading session relative to the average of actual prices for the last trading session. The column shows the expected average price movement “Up or Down”, in percent. Trend traders should trade along the predicted direction of the Vector. The higher the value of the Vector the higher its momentum.
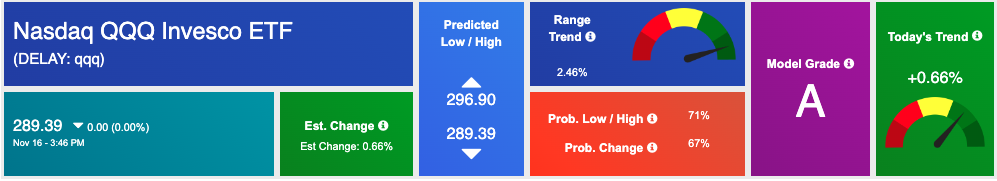
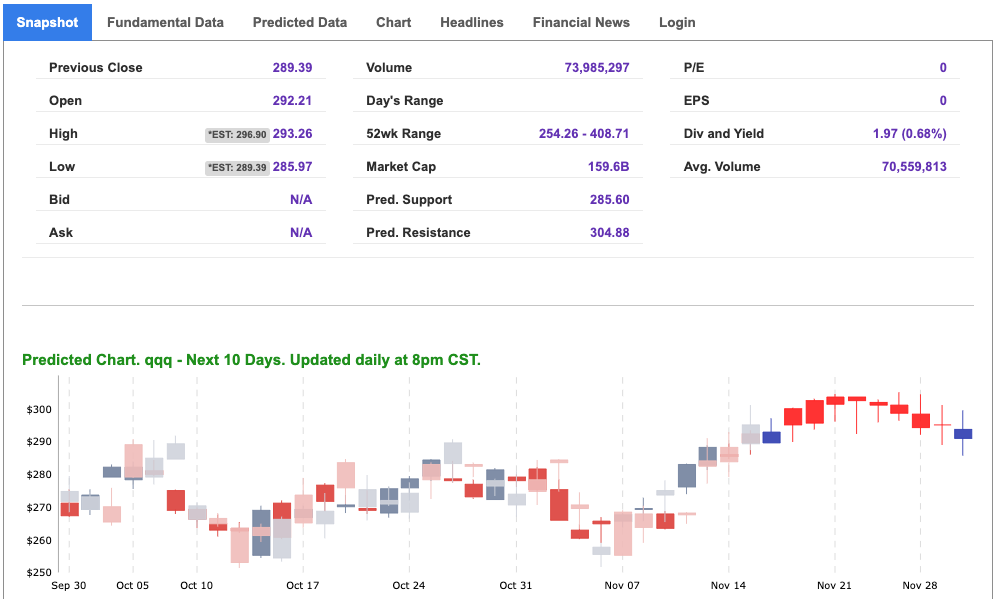
*Please note: At the time of publication Vlad Karpel does have a position in the featured symbol, QQQ. Our featured symbol is part of your free subscription service. It is not included in any paid Tradespoon subscription service. Vlad Karpel only trades his money in paid subscription services. If you are a paid subscriber, please review your Premium Member Picks, ActiveTrader, or MonthlyTrader recommendations. If you are interested in receiving Vlad’s picks, please click here.
West Texas Intermediate for Crude Oil delivery (CL.1) is priced at $85.26 per barrel, down 1.91%, at the time of publication.
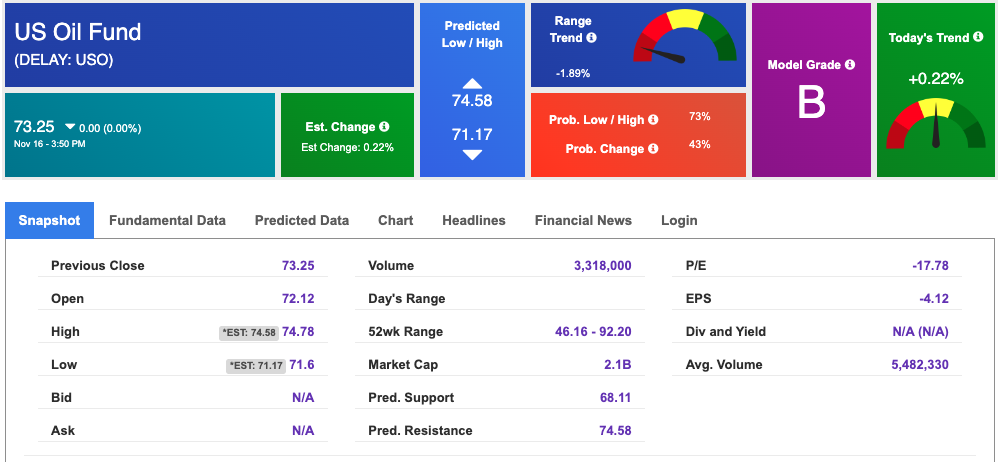
Looking at USO, a crude oil tracker, our 10-day prediction model shows mixed signals. The fund is trading at $73.25 at the time of publication. Prediction data is uploaded after the market close at 6 p.m., CST. Today’s data is based on market signals from the previous trading session.
The price for the Gold Continuous Contract (GC00) is up 0.01% at $1776.80 at the time of publication.
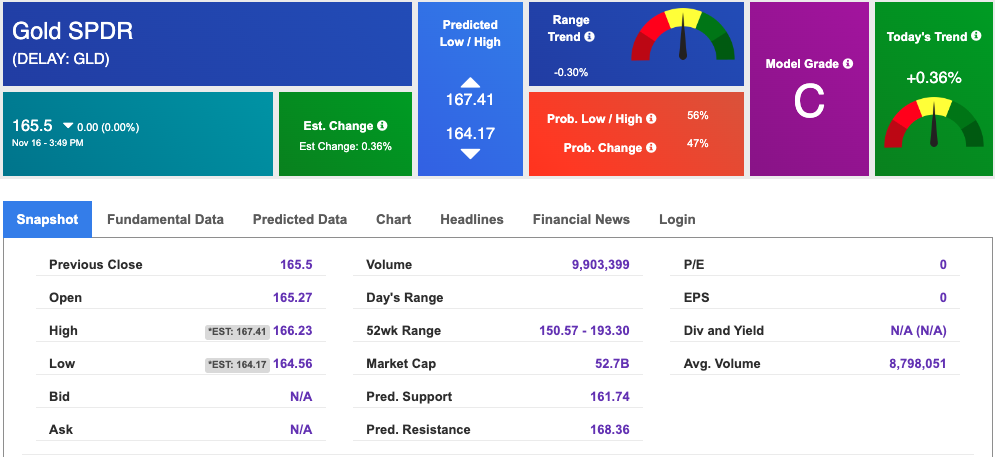
Using SPDR GOLD TRUST (GLD) as a tracker in our Stock Forecast Tool, the 10-day prediction window shows mixed signals. The gold proxy is trading at $165.5 at the time of publication. Vector signals show +0.36% for today. Prediction data is uploaded after the market close at 6 p.m., CST. Today’s data is based on market signals from the previous trading session.
The yield on the 10-year Treasury note is DOWN at 3.693% at the time of publication.
The yield on the 30-year Treasury note is DOWN at 3.846% at the time of publication.
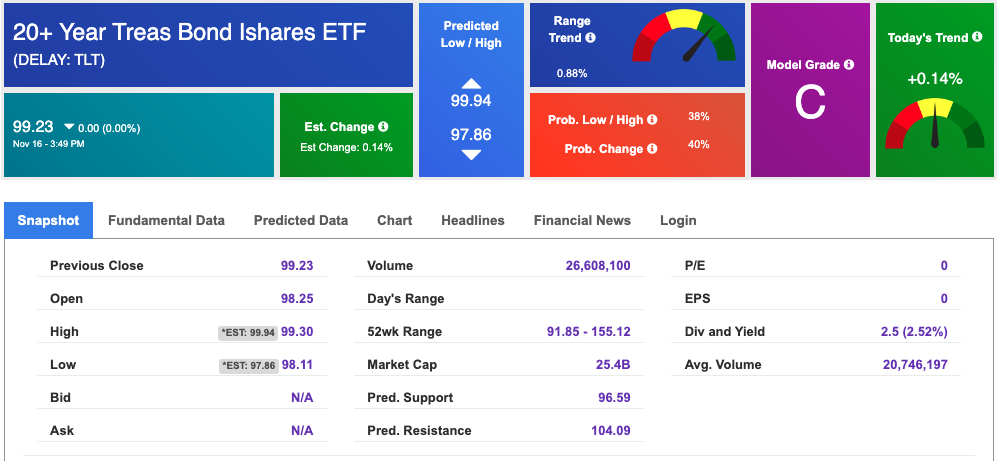
Using the iShares 20+ Year Treasury Bond ETF (TLT) as a proxy for bond prices in our Stock Forecast Tool, we see mixed signals in our 10-day prediction window. Prediction data is uploaded after the market close at 6 p.m., CST. Today’s data is based on market signals from the previous trading session.
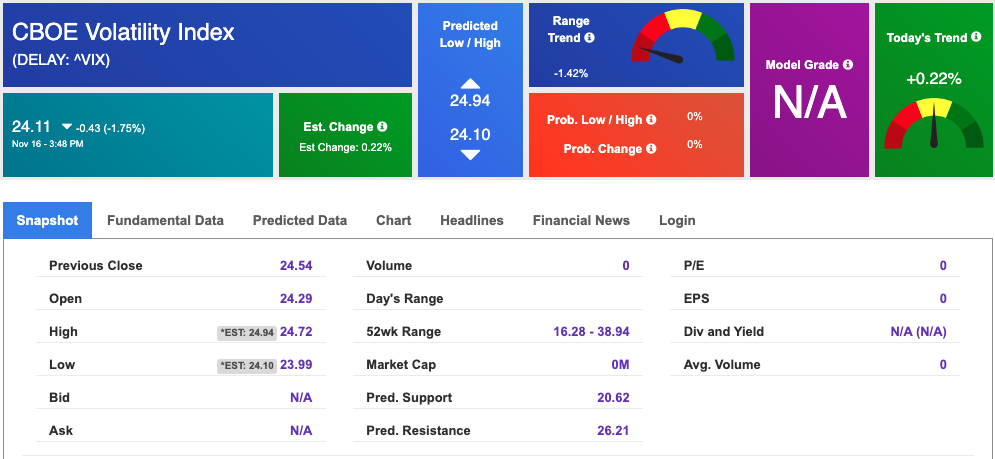
The CBOE Volatility Index (^VIX) is $24.11 at the time of publication, and our 10-day prediction window shows mixed signals. Prediction data is uploaded after the market close at 6 p.m., CST. Today’s data is based on market signals from the previous trading session.
Please share this Tradespoon Market Commentary with your friends.
![]()

![]()
Comments Off on


Tradespoon Tools make finding winning trades in minute as easy as 1-2-3.
Our simple 3 step approach has resulted in an average return of almost 20% per trade!

