 Save Big on Commissions ($0.65 per Contract)
CLICK HERE TO LEARN MORE
Save Big on Commissions ($0.65 per Contract)
CLICK HERE TO LEARN MORE
On Monday, the Dow Jones Industrial Average and the S&P 500 remained close to their 2022 lows set at the end of last month while the Nasdaq gave up nearly 3.5%. Shares felt added pressure after they failed to bounce back following worries about future Federal Reserve rate hikes. This week markets will see major banks kick off the latest earnings season as well as key inflation data in the September CPI reports. Also this week, FOMC minutes are due on Wednesday while Friday will feature retail sales and import price index.
Last week, markets sold off to end the week following major oil news and the latest employment data. In September, the United States added only 263,000 jobs, which was the smallest increase in nearly two years. As talk of a recession spread, it’s possible that minimal labor shortages and decreased demand for employees were behind the modest rise in new employment. The Fed will most likely continue raising rates because employment is still too robust. The unemployment rate has now rebounded to its pre-pandemic average of 3.5%. Also last week, OPEC announced it would cut its oil production by 2 million barrels per day. The news sent a shock through the market and caused oil rates to spike higher. Although not as high as in mid-summer, oil shares are facing difficulty from both OPEC and the unrest in Ukraine.
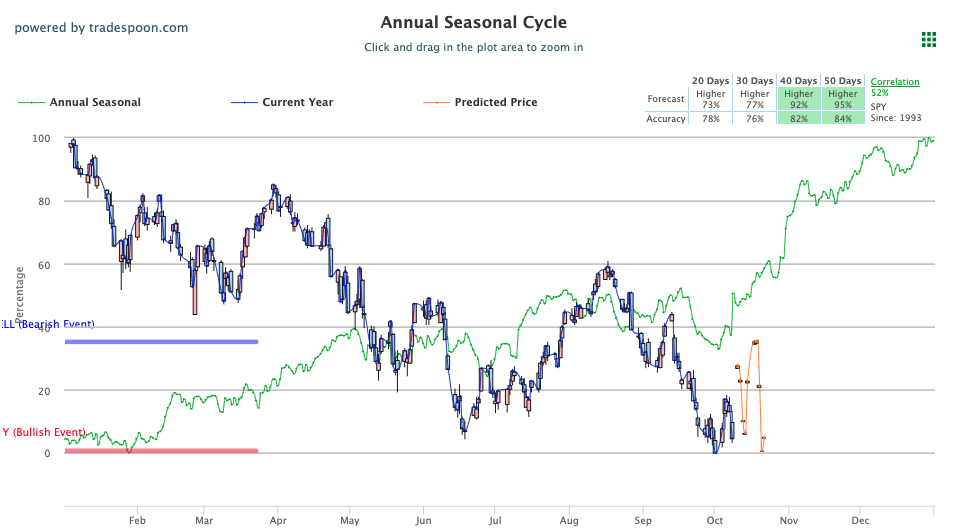
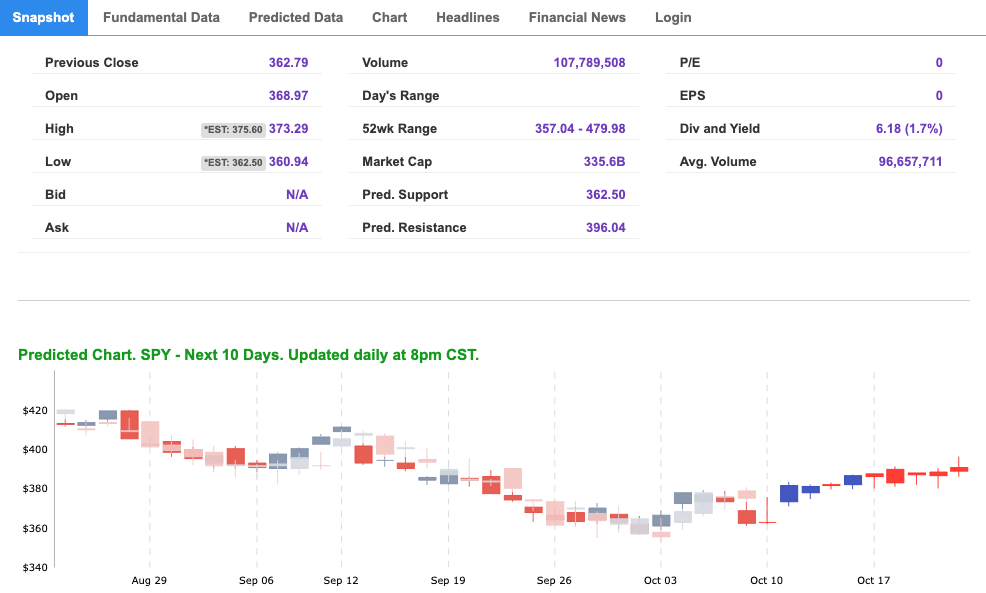
This week, watch out for $JPM, $STM, and $DAL earnings, as well as CPI/PPI data which can influence markets this week. We are watching the overhead resistance levels in the SPY, which are presently at $376 and then $390. The $SPY support is at $355 and then $340. Vlad expects the market to continue the bottoming process for the next 2-8 weeks. The short-term market is oversold and can stage a multiple sessions rally. We would be a buyer into any further sell-offs and encourage subscribers not to chase the market to the downside. Globally, both Asian and European markets finished in the red. We encourage all market commentary readers to maintain clearly defined stop levels for all positions. For reference, the SPY Seasonal Chart is shown below:
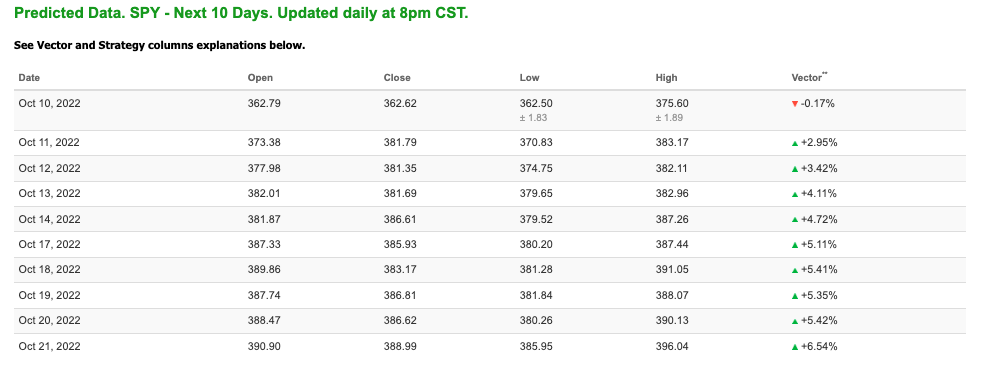
Note: The Vector column calculates the change of the Forecasted Average Price for the next trading session relative to the average of actual prices for the last trading session. The column shows the expected average price movement “Up or Down”, in percent. Trend traders should trade along the predicted direction of the Vector. The higher the value of the Vector the higher its momentum.
*Please note: At the time of publication Vlad Karpel does have a position in the featured symbol, spy. Our featured symbol is part of your free subscription service. It is not included in any paid Tradespoon subscription service. Vlad Karpel only trades his money in paid subscription services. If you are a paid subscriber, please review your Premium Member Picks, ActiveTrader, or MonthlyTrader recommendations. If you are interested in receiving Vlad’s picks, please click here.
West Texas Intermediate for Crude Oil delivery (CL.1) is priced at $90.85 per barrel, down 1.93%, at the time of publication.
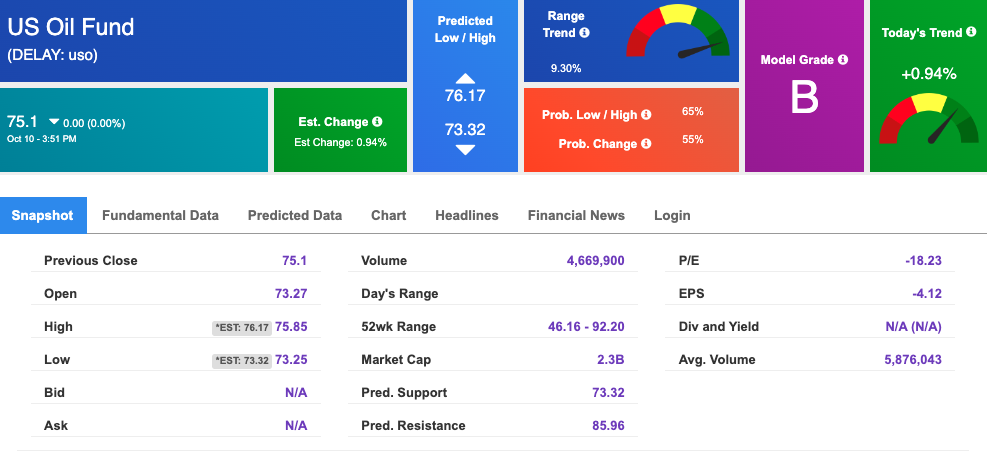
Looking at USO, a crude oil tracker, our 10-day prediction model shows mixed signals. The fund is trading at $75.1 at the time of publication. Prediction data is uploaded after the market close at 6 p.m., CST. Today’s data is based on market signals from the previous trading session.
The price for the Gold Continuous Contract (GC00) is down 1.98% at $1675.40 at the time of publication.
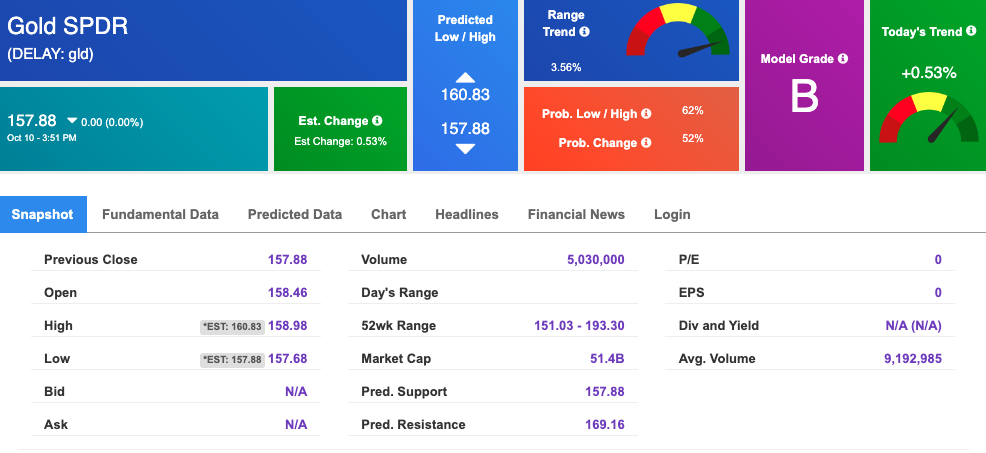
Using SPDR GOLD TRUST (GLD) as a tracker in our Stock Forecast Tool, the 10-day prediction window shows mixed signals. The gold proxy is trading at $157.88 at the time of publication. Vector signals show 0.53% for today. Prediction data is uploaded after the market close at 6 p.m., CST. Today’s data is based on market signals from the previous trading session.
The yield on the 10-year Treasury note is flat at 3.890% at the time of publication.
The yield on the 30-year Treasury note is flat at 3.846% at the time of publication.
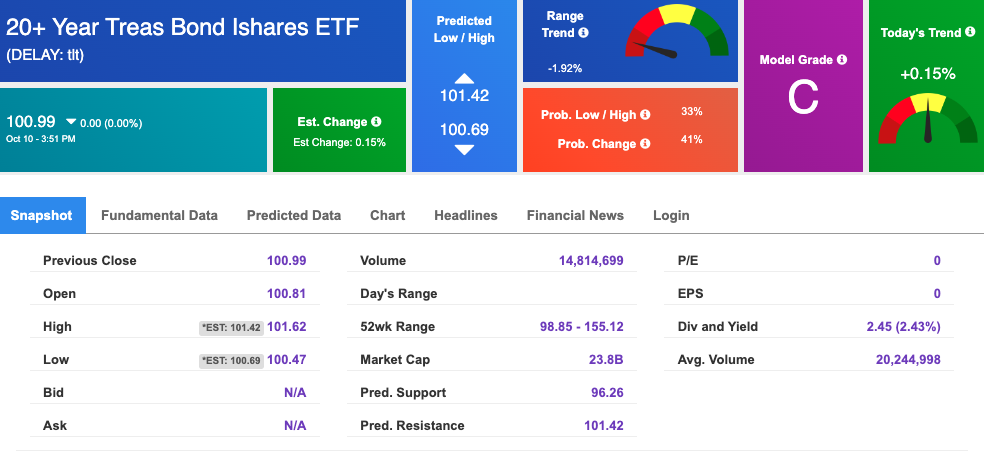
Using the iShares 20+ Year Treasury Bond ETF (TLT) as a proxy for bond prices in our Stock Forecast Tool, we see mixed signals in our 10-day prediction window. Prediction data is uploaded after the market close at 6 p.m., CST. Today’s data is based on market signals from the previous trading session.
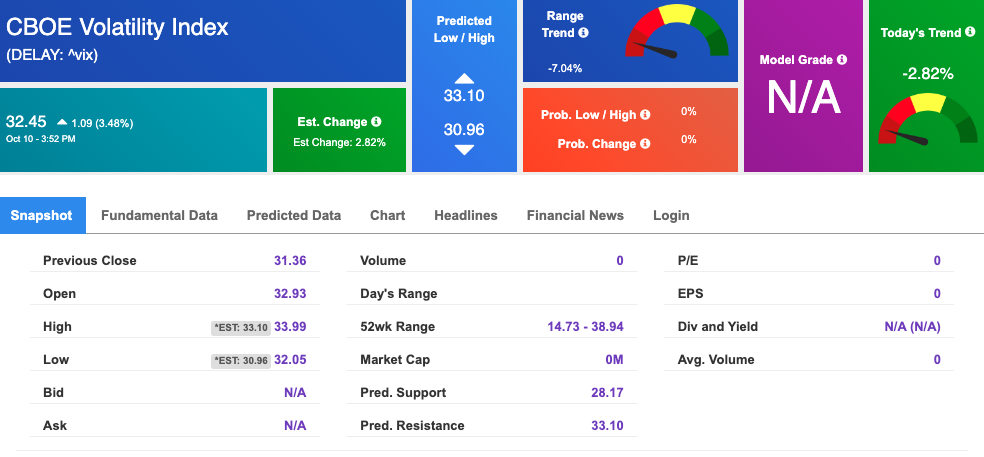
The CBOE Volatility Index (^VIX) is $32.45 at the time of publication, and our 10-day prediction window shows mixed signals. Prediction data is uploaded after the market close at 6 p.m., CST. Today’s data is based on market signals from the previous trading session.
Please share this Tradespoon Market Commentary with your friends.
![]()

![]()
Comments Off on


Tradespoon Tools make finding winning trades in minute as easy as 1-2-3.
Our simple 3 step approach has resulted in an average return of almost 20% per trade!

