 Special Offer: Try the 'Elite Trading Circle Membership' for ONLY $37!
CLICK HERE TO LEARN MORE
Special Offer: Try the 'Elite Trading Circle Membership' for ONLY $37!
CLICK HERE TO LEARN MORE
On Monday, stocks in the U.S tumbled, even nearing a bear market close as investors continue to worry about the economy in regards to the latest interest rates and currency levels. Although there was an initial boost behind tech in the market today, U.S. stocks were not able to hold on to gains with all three major U.S. indices closing in the red. Stocks fell hard last week, with the Dow dropping 4% and ending Friday at its lowest point in almost a year while the S&P 500 and Nasdaq Composite both plummeted nearly 5%. The dollar has been in the midst of a strong rally following the latest FOMC decision to hike rates, nearing a 20-year high. This also sent long term treasury yields higher, with the 10-year note nearing 4%. Elsewhere, gold and oil sold off to open the week while the volatility index, the VIX, traded higher near the $31 range. Globally, Asian markets traded lower while European markets closed to mixed results.
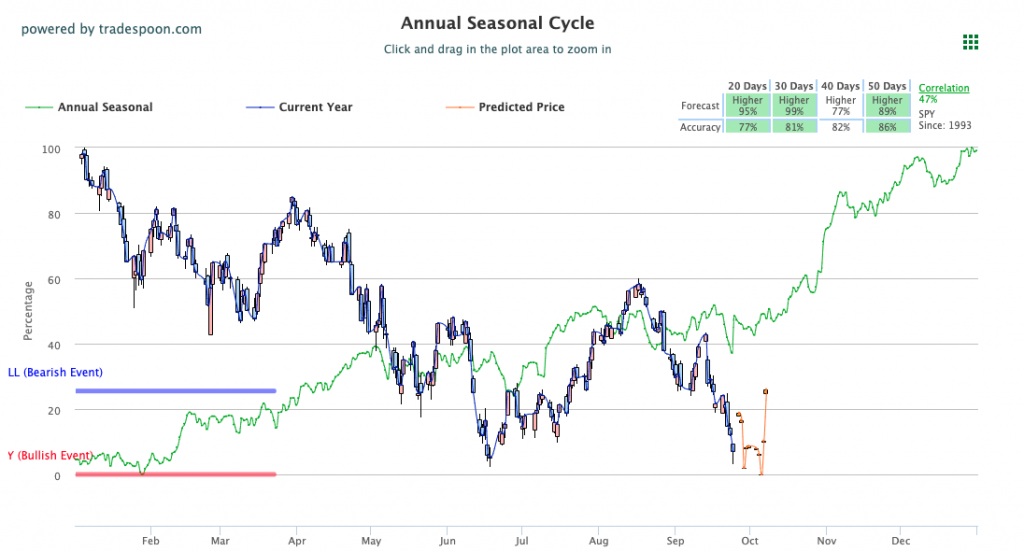
Earnings season is right around the corner with a few big names reporting to end this week, and more to come in the next few weeks. CarMax, Rite Aid, and Micron Tech are due to report on Thursday, while Carnival will report on Friday. Several key Federal Reserve members spoke today while several additional speeches from Fed members, including Powell on Tuesday, are due this week as well. Look out for key inflation data to also release this week with PCE info on Friday. GDP revisions for Q2 will be released on Thursday. We’re keeping an eye on the SPY’s overhead resistance levels, which are presently at $380 and $390. The $SPY support level is $360 and then $350. We expect the market to continue the current pullback for the next 2-8 weeks. Short term market is oversold and can stage a multiple-week rally. We encourage all market commentary readers to maintain clearly defined stop levels for all positions. For reference, the SPY Seasonal Chart is shown below:
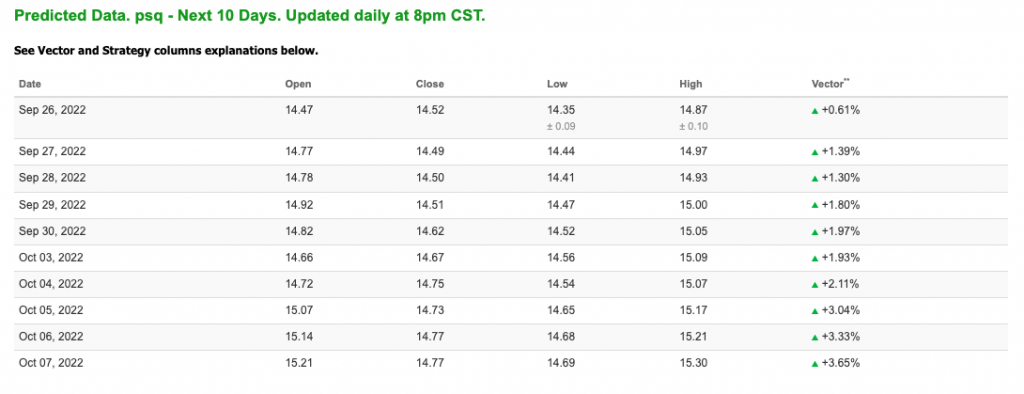
Note: The Vector column calculates the change of the Forecasted Average Price for the next trading session relative to the average of actual prices for the last trading session. The column shows the expected average price movement “Up or Down”, in percent. Trend traders should trade along the predicted direction of the Vector. The higher the value of the Vector the higher its momentum.
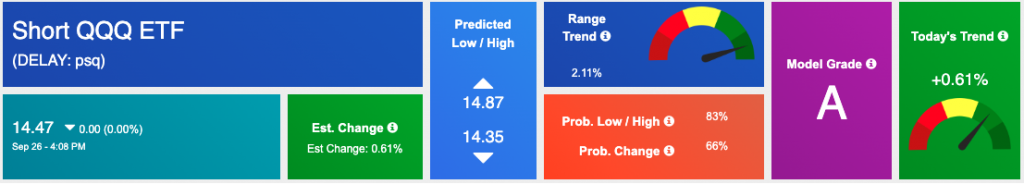
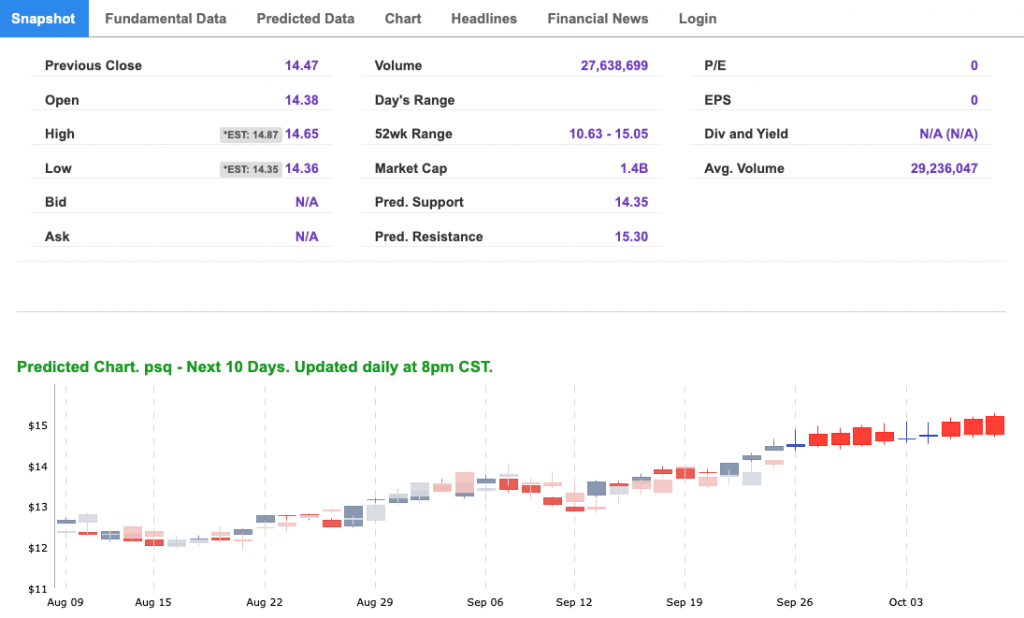
*Please note: At the time of publication Vlad Karpel does have a position in the featured symbol, PSQ. Our featured symbol is part of your free subscription service. It is not included in any paid Tradespoon subscription service. Vlad Karpel only trades his money in paid subscription services. If you are a paid subscriber, please review your Premium Member Picks, ActiveTrader, or MonthlyTrader recommendations. If you are interested in receiving Vlad’s picks, please click here.
West Texas Intermediate for Crude Oil delivery (CL.1) is priced at $76.34 per barrel, down 3.05%, at the time of publication.
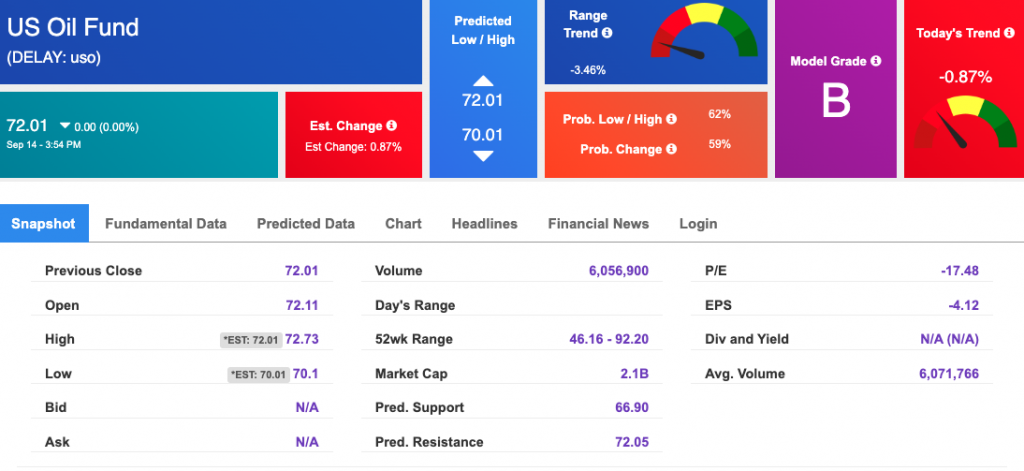
Looking at USO, a crude oil tracker, our 10-day prediction model shows mixed signals. The fund is trading at $72.01 at the time of publication. Prediction data is uploaded after the market close at 6 p.m., CST. Today’s data is based on market signals from the previous trading session.
The price for the Gold Continuous Contract (GC00) is down 1.59% at $1629.30 at the time of publication.
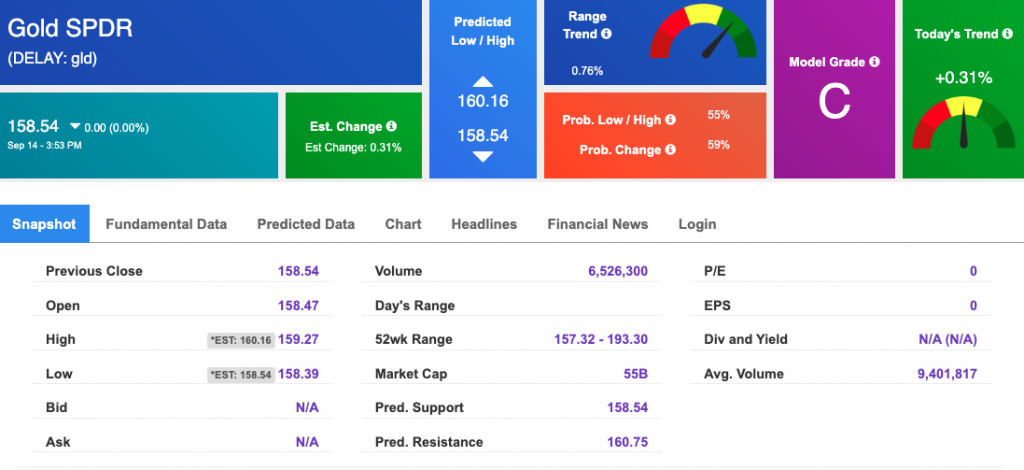
Using SPDR GOLD TRUST (GLD) as a tracker in our Stock Forecast Tool, the 10-day prediction window shows mixed signals. The gold proxy is trading at $158.54 at the time of publication. Vector signals show +0.31% for today. Prediction data is uploaded after the market close at 6 p.m., CST. Today’s data is based on market signals from the previous trading session.
The yield on the 10-year Treasury note is up, at 3.919% at the time of publication.
The yield on the 30-year Treasury note is up, at 3.740% at the time of publication.
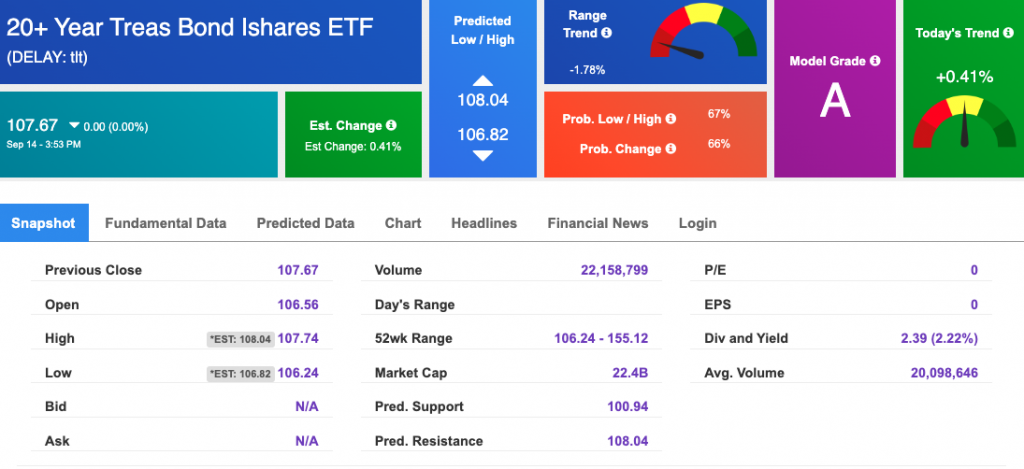
Using the iShares 20+ Year Treasury Bond ETF (TLT) as a proxy for bond prices in our Stock Forecast Tool, we see mixed signals in our 10-day prediction window. Prediction data is uploaded after the market close at 6 p.m., CST. Today’s data is based on market signals from the previous trading session.
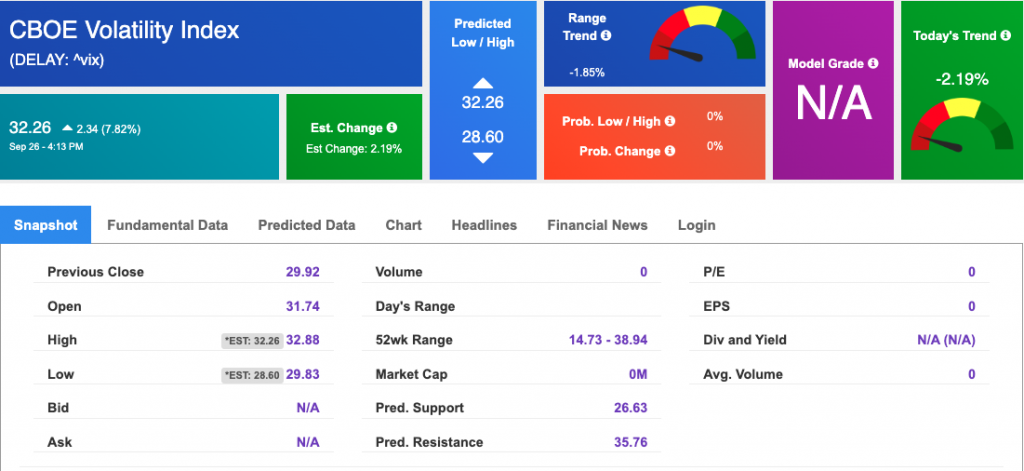
The CBOE Volatility Index (^VIX) is $32.26 at the time of publication, and our 10-day prediction window shows mixed signals. Prediction data is uploaded after the market close at 6 p.m., CST. Today’s data is based on market signals from the previous trading session.
Please share this Tradespoon Market Commentary with your friends.
![]()

![]()
Comments Off on


Tradespoon Tools make finding winning trades in minute as easy as 1-2-3.
Our simple 3 step approach has resulted in an average return of almost 20% per trade!

