 Save Big on Commissions ($0.65 per Contract)
CLICK HERE TO LEARN MORE
Save Big on Commissions ($0.65 per Contract)
CLICK HERE TO LEARN MORE
The U.S. stock market kicked off the week on a positive note, with all three major indices posting gains on Monday. Investors’ attention is now firmly fixed on a series of upcoming economic data releases, poised to influence the Federal Reserve’s interest-rate policy decisions.
Consumer-discretionary, communication services, and several technology companies stole the spotlight on Monday, propelling the broader market higher. Leading this charge was electric vehicle giant Tesla, which surged by a remarkable 10% after receiving a bullish upgrade from Morgan Stanley raising the stock’s price target to a Wall Street high of $400 per share.
Investor enthusiasm was buoyed by optimism surrounding luxury goods and services producers like Tesla, ahead of critical economic data releases later in the week. The August U.S. consumer-price index, due for release on Wednesday, is expected to reveal a 3.6% year-over-year increase in the headline index, with the core Consumer Price Index (CPI), excluding food and energy components, projected to rise by 4.4%.
This week’s main event is undoubtedly the inflation reading, as it will significantly impact the Federal Reserve’s upcoming policy meeting in September. The market is abuzz with speculation about whether the central bank will make further adjustments to interest rates.
Apple, a tech behemoth, is set to host a product event on Tuesday, with the highly anticipated announcement of the iPhone 15 and other hardware. Shares in Apple rebounded after a 6% dip last week, sparked by reports of Chinese government restrictions on iPhone usage among government workers. Semiconductor company Qualcomm surged higher after extending its agreement to manufacture modem chips for Apple’s iPhones through 2026, solidifying its presence in a competitive market.
Disney and Charter Communications put an end to a blackout that lasted over a week, reaching an agreement that will restore popular channels like ESPN and ABC to nearly 15 million cable subscribers. Disney shares rose by 1.2%, while Charter’s stock jumped by an impressive 3.2%.
A dynamic shift is unfolding in the markets as investors grapple with a complex economic landscape. The Dollar Index (DXY) is experiencing a relentless rally, and long-term Treasury bond yields are revisiting October highs. Meanwhile, China is implementing stimulus measures, including mortgage interest rate cuts and tax reductions, in response to its own economic pressures.
The evolving sequence of events has ignited a critical debate: Can inflation rise to the coveted 2% level without the ominous shadow of a recession and increased unemployment? History suggests that such an outcome is rare, underscoring the intricacies of our current economic situation.
As we navigate these uncertain waters, notable shifts in market sentiment are emerging. A transition toward a market-neutral stance is underway, driven by economic data indicating a low likelihood of recession. This shift prompts reflection on the SPY rally, with potential resistance around the $450-470 range and short-term support within the 400-430 range in the coming months. For reference, the SPY Seasonal Chart is shown below:
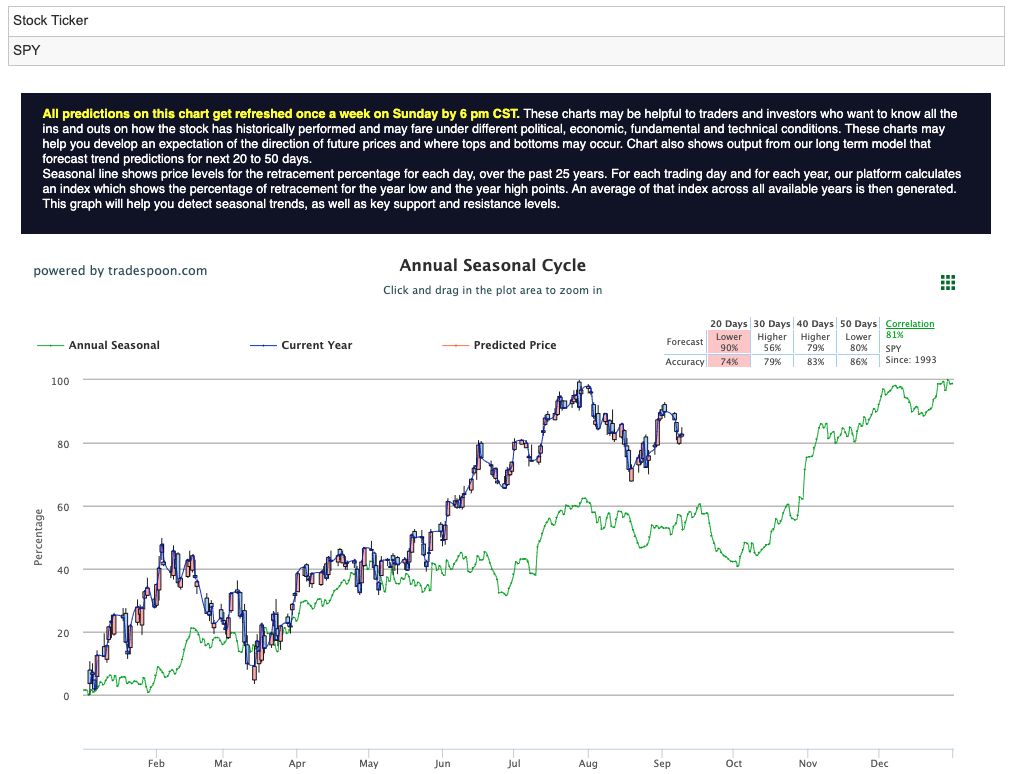
As the week unfolds, all eyes remain fixed on the economic data releases and their implications for the future trajectory of the market.
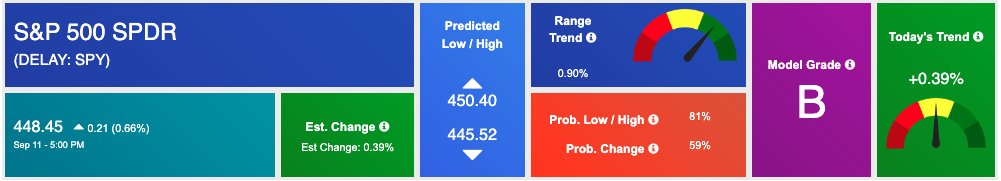
Using the “SPY” symbol to analyze the S&P 500 our 10-day prediction window shows a near-term positive outlook. Prediction data is uploaded after the market closes at 6 p.m. CST. Today’s data is based on market signals from the previous trading session.
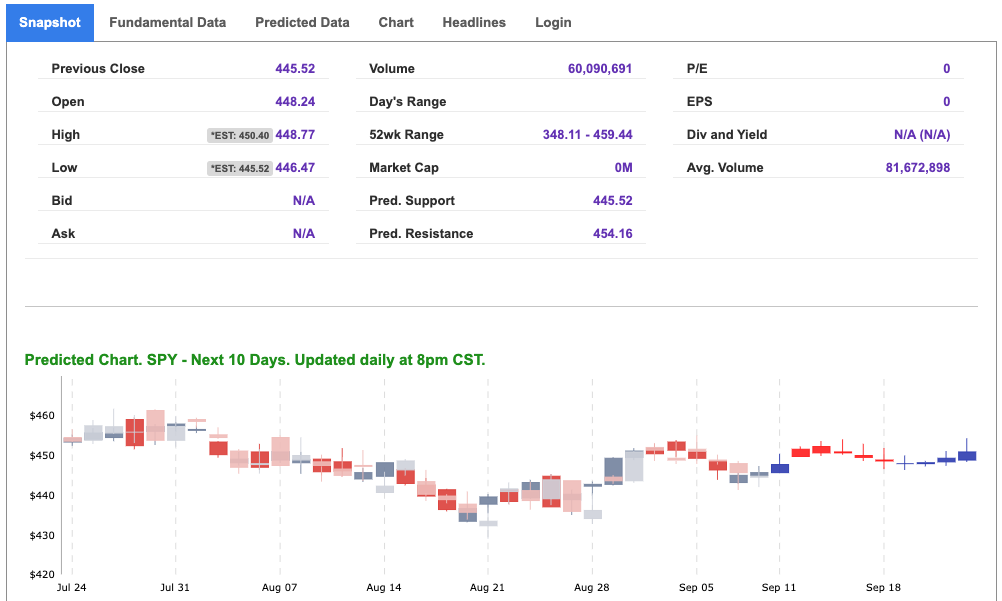
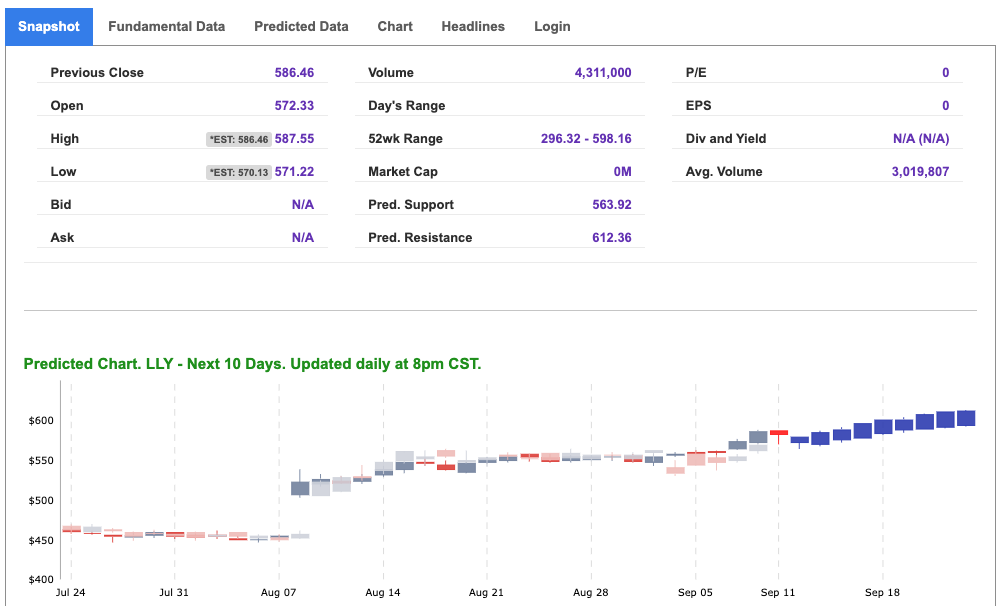
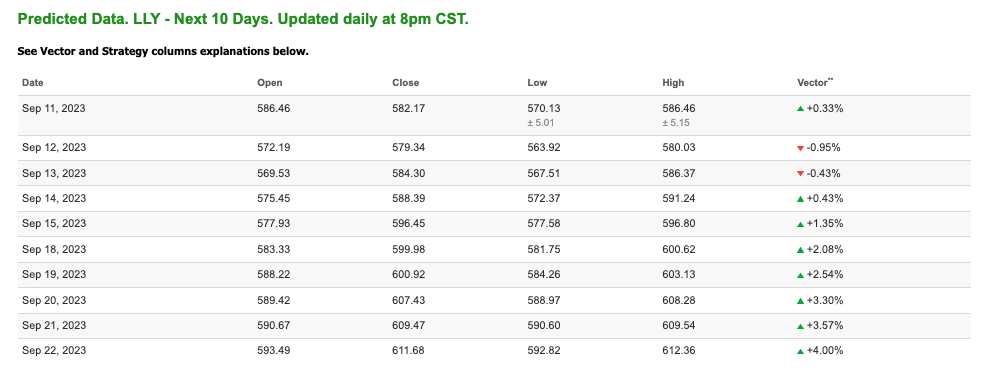
Note: The Vector column calculates the change of the Forecasted Average Price for the next trading session relative to the average of actual prices for the last trading session. The column shows the expected average price movement “Up or Down”, in percent. Trend traders should trade along the predicted direction of the Vector. The higher the value of the Vector the higher its momentum.
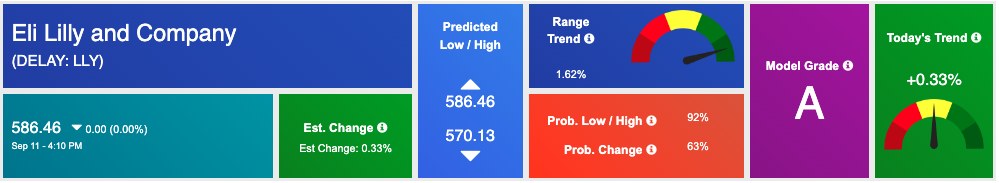
*Please note: At the time of publication Vlad Karpel does NOT have a position in the featured symbol, lly. Our featured symbol is part of your free subscription service. It is not included in any paid Tradespoon subscription service. Vlad Karpel only trades his money in paid subscription services. If you are a paid subscriber, please review your Premium Member Picks, ActiveTrader, or MonthlyTrader recommendations. If you are interested in receiving Vlad’s picks, please click here.
West Texas Intermediate for Crude Oil delivery (CL.1) is priced at $87.27 per barrel, down 0.02%, at the time of publication.
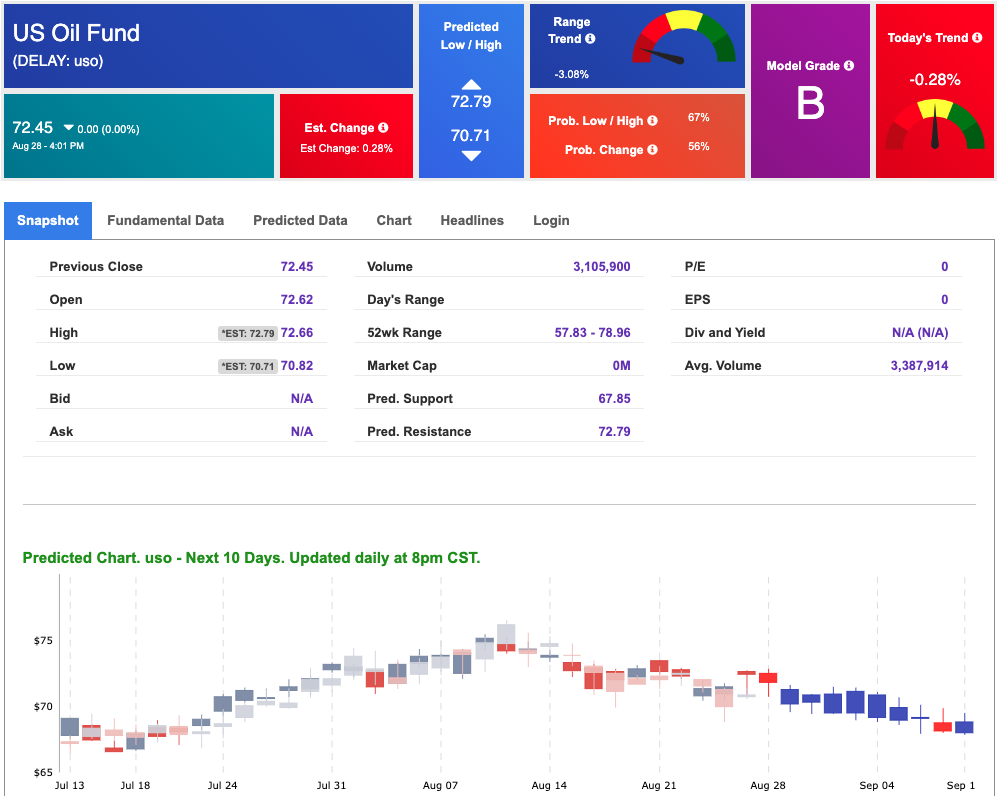
Looking at USO, a crude oil tracker, our 10-day prediction model shows mixed signals. The fund is trading at $72.45 at the time of publication. Prediction data is uploaded after the market close at 6 p.m., CST. Today’s data is based on market signals from the previous trading session.
The price for the Gold Continuous Contract (GC00) is down 0.08% at $1945.60 at the time of publication.
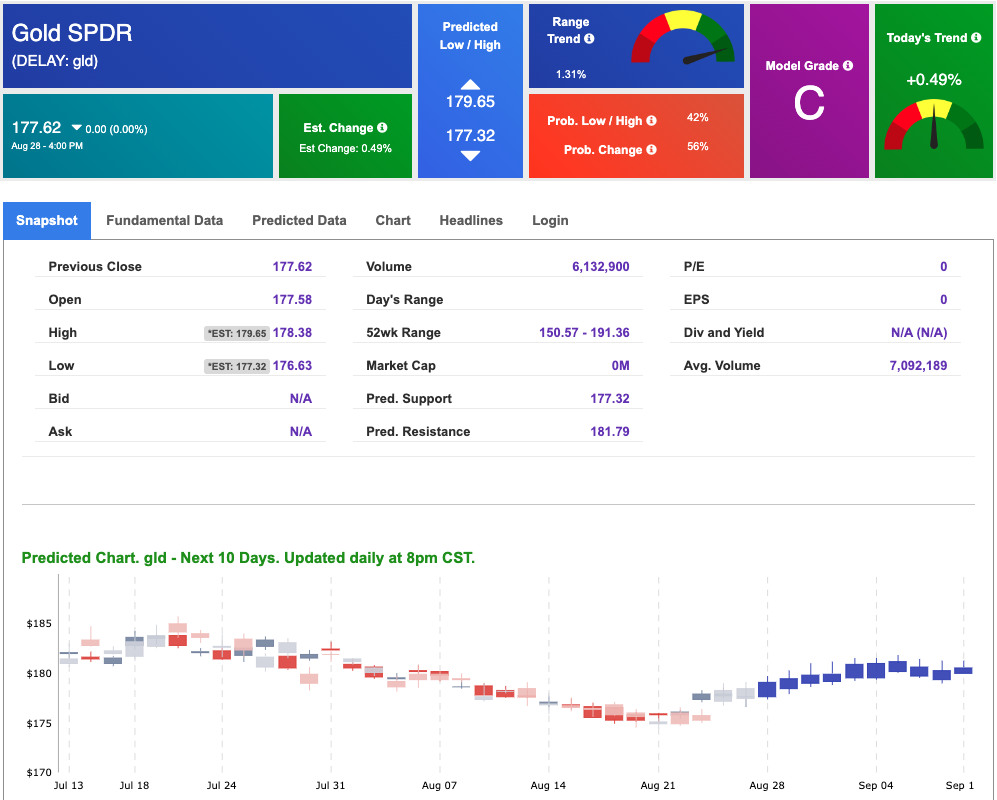
Using SPDR GOLD TRUST (GLD) as a tracker in our Stock Forecast Tool, the 10-day prediction window shows mixed signals. The gold proxy is trading at $177.62 at the time of publication. Vector signals show +0.49% for today. Prediction data is uploaded after the market close at 6 p.m., CST. Today’s data is based on market signals from the previous trading session.
The yield on the 10-year Treasury note is up at 4.290% at the time of publication.
The yield on the 30-year Treasury note is up at 4.376% at the time of publication.
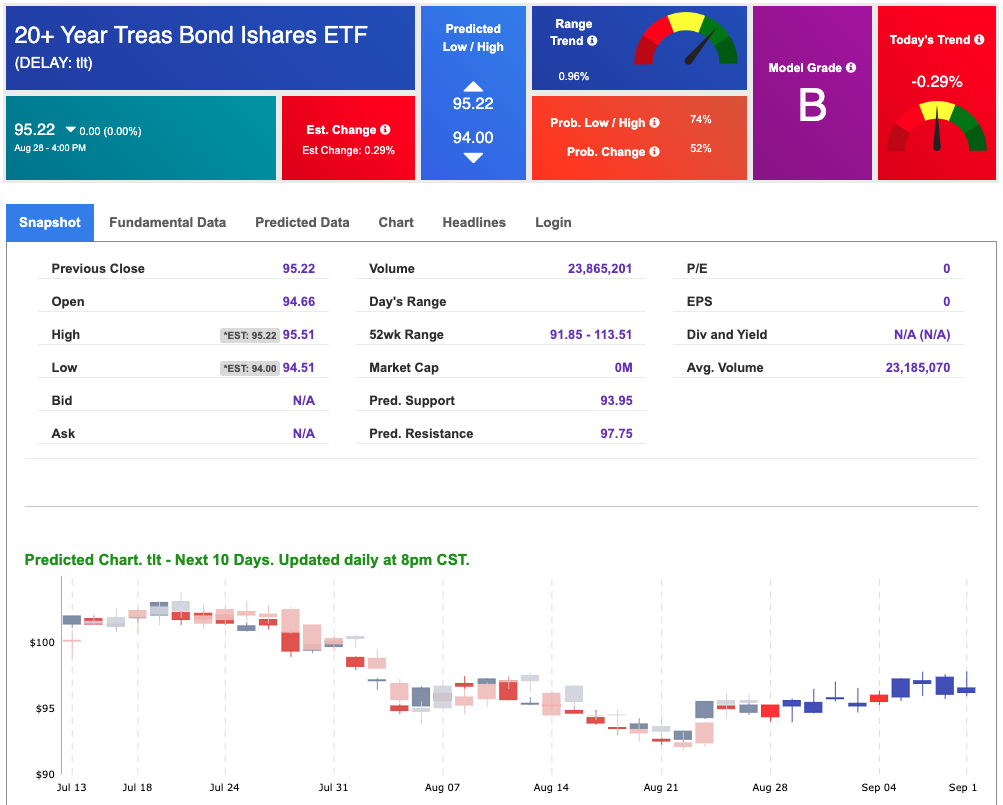
Using the iShares 20+ Year Treasury Bond ETF (TLT) as a proxy for bond prices in our Stock Forecast Tool, we see mixed signals in our 10-day prediction window. Prediction data is uploaded after the market close at 6 p.m., CST. Today’s data is based on market signals from the previous trading session.
The CBOE Volatility Index (^VIX) is priced at $13.80, down 0.29% at the time of publication, and our 10-day prediction window shows mixed signals. Prediction data is uploaded after the market close at 6 p.m., CST. Today’s data is based on market signals from the previous trading session.
Please share this Tradespoon Market Commentary with your friends.
![]()

![]()
Comments Off on


Tradespoon Tools make finding winning trades in minute as easy as 1-2-3.
Our simple 3 step approach has resulted in an average return of almost 20% per trade!

