 Are you a Long-Term Trader? Then take a look at our NEW RoboInvestor Service?
CLICK HERE TO LEARN MORE
Are you a Long-Term Trader? Then take a look at our NEW RoboInvestor Service?
CLICK HERE TO LEARN MORE
In a surprising turn of events, the stock market rallied on Monday, propelling the S&P 500 out of correction territory. As Wall Street gears up for Thanksgiving in this shortened trading week, a dynamic interplay of corporate earnings, economic data, and evolving sentiments on interest rates is shaping the financial landscape.
A Whirlwind Recovery
The S&P 500’s dramatic surge, surpassing 10% from its recent low, signals a significant departure from correction territory initiated on October 27. Investors find solace in the conviction that the Federal Reserve is likely putting the brakes on interest rate hikes. The subsequent retreat in bond yields provides a much-needed reprieve for rate-sensitive stocks.
Yet, beneath the surface, the economic outlook remains a tapestry of complexities. The U.S. is anticipated to navigate a brief recession, grappling with the squeeze on consumer spending triggered by high inflation and the Fed’s stringent interest rates. The Conference Board’s revelation that its Leading Economic Index fell by 0.8% in October, exceeding the expected 0.7% drop, raises questions about the resilience of economic activity.
Tuesday promises insights into the Federal Reserve’s strategic playbook as the FOMC releases minutes from its early November meeting. With a steady interest rate since July, Wall Street speculates that the Fed’s hiking cycle might be on pause, reflecting in traders assigning less than a 1% chance of rate hikes before a potential cut.
Corporate maneuvers are also in the spotlight, with Microsoft making waves by enlisting former OpenAI CEO Sam Altman to lead a groundbreaking AI research team. This strategic move, coupled with quarterly earnings reports from major players like Nvidia, Best Buy, HP Inc, and Deere, injects a dose of anticipation into the market.
Zoom Video Communications, riding high with a 2.9% pre-earnings surge and a 6.1% after-hours rally on robust third-quarter results, showcases the power of positive corporate performance in driving stock momentum.
Last week’s spotlight on inflation, particularly the Consumer Price Index (CPI) for October, presented a narrative of a 3.2% year-over-year increase. This triggered discussions on the Federal Reserve’s stance on interest rates. Wednesday’s surprises in the Producer Price Index (PPI) and retail sales data, coupled with falling gasoline prices, added layers to the market narrative.
As we approach the end of 2023, the prevailing sentiment indicates the Federal Reserve’s reluctance to raise rates this year and the next, with expectations of rate cuts in early 2024—viewed as a bullish signal. The U.S. Dollar (DXY) and longer-dated treasuries below their 50-day moving averages suggest a market rally fueled by a weakening dollar and declining yields. Caution is advised amid optimism and the looming possibility of a government shutdown.
The energy sector has faced a notable pullback, testing the 200-day moving average due to weakened global demand and reduced geopolitical risks. WTI oil futures dropped 4.1% to $73.50 a barrel, impacting the S&P 500’s energy sector, which declined by 2.2%, while the utilities sector led with a gain of 0.8%.
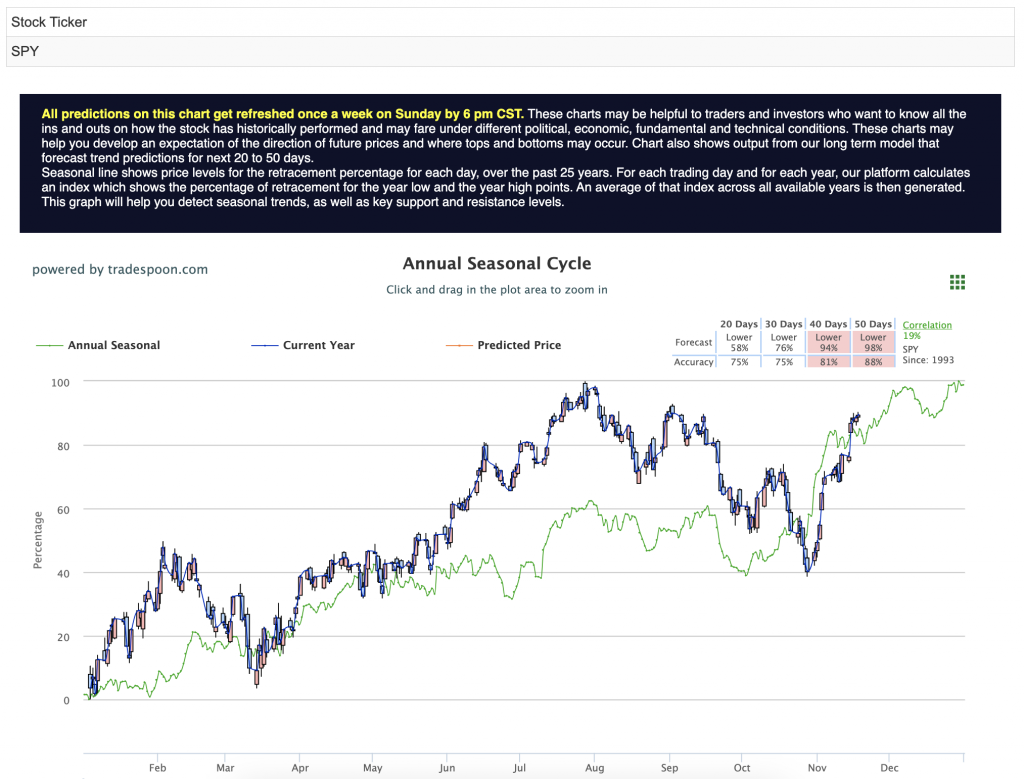
Amid these market dynamics, potential shifts are observed, influenced by factors like small caps, a weakening dollar, and declining yields. Anticipated short-term support is $400-$430, with discernible patterns of achieving higher highs and higher lows. Caution remains key, especially considering the potential for a government shutdown. The S&P 500 rally might encounter a ceiling within the $450-$470 range. For reference, the SPY Seasonal Chart is shown below:
As the week unfolds, investors eagerly anticipate further earnings reports and economic indicators that promise to shape the market narrative. Against the backdrop of the SPY hitting new highs, the market’s resurgence, marked by surprises, strategic shifts, and resilience, continues to captivate the financial world, setting the stage for an intriguing holiday season.
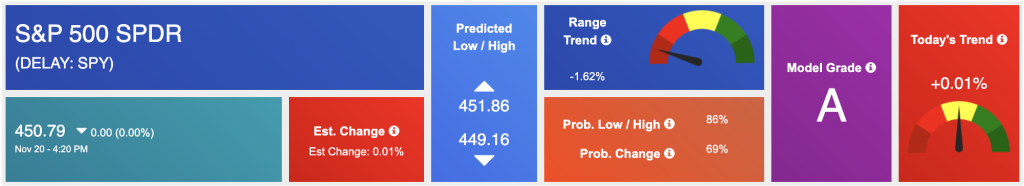
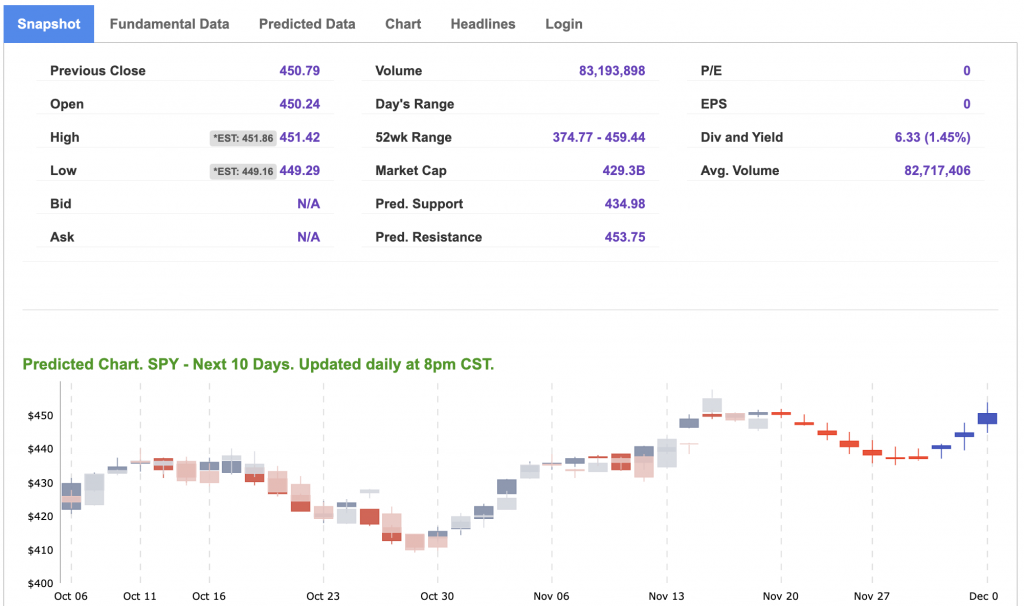
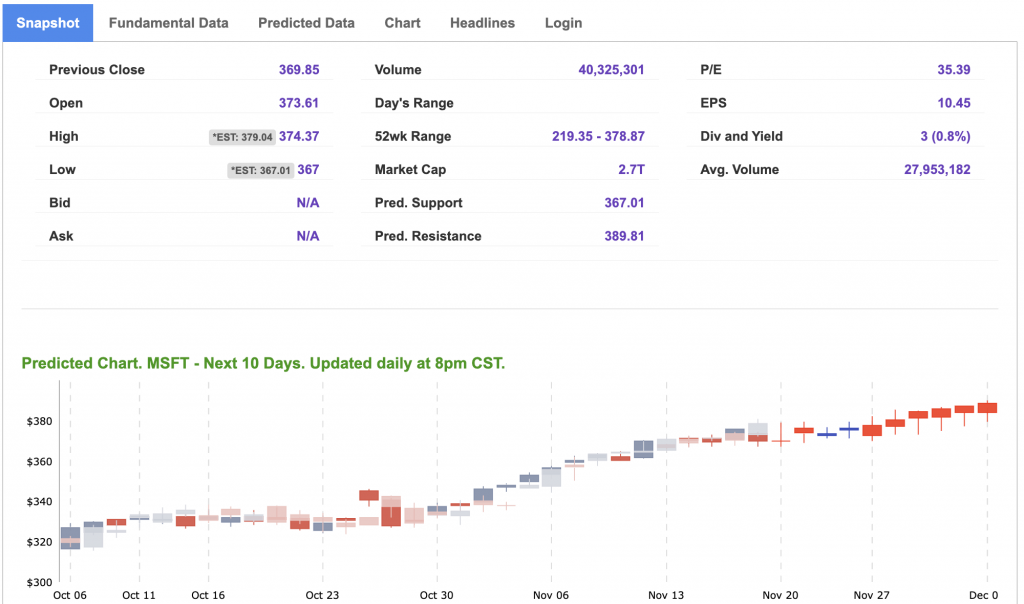
Using the “SPY” symbol to analyze the S&P 500 our 10-day prediction window shows a near-term positive outlook. Prediction data is uploaded after the market closes at 6 p.m. CST. Today’s data is based on market signals from the previous trading session.
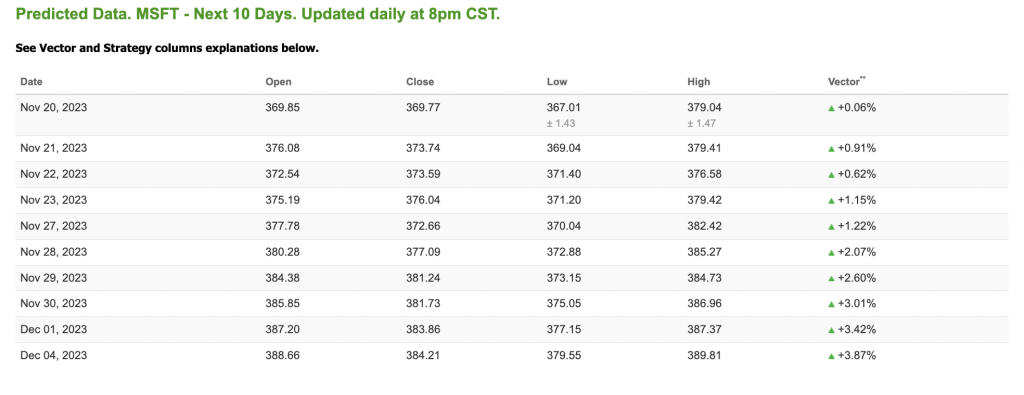
Note: The Vector column calculates the change of the Forecasted Average Price for the next trading session relative to the average of actual prices for the last trading session. The column shows the expected average price movement “Up or Down”, in percent. Trend traders should trade along the predicted direction of the Vector. The higher the value of the Vector the higher its momentum.
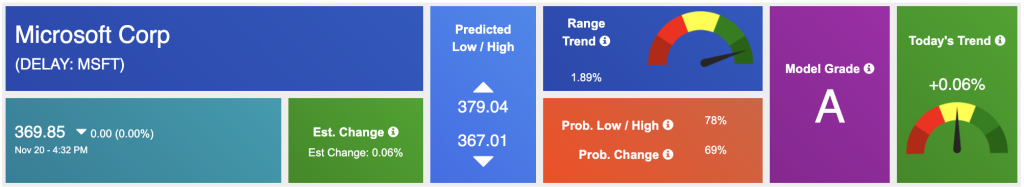
*Please note: At the time of publication Vlad Karpel does NOT have a position in the featured symbol, MSFT. Our featured symbol is part of your free subscription service. It is not included in any paid Tradespoon subscription service. Vlad Karpel only trades his money in paid subscription services. If you are a paid subscriber, please review your Premium Member Picks, ActiveTrader, or MonthlyTrader recommendations. If you are interested in receiving Vlad’s picks, please click here.
West Texas Intermediate for Crude Oil delivery (CL.1) is priced at $77.50 per barrel, up 2.12%, at the time of publication.
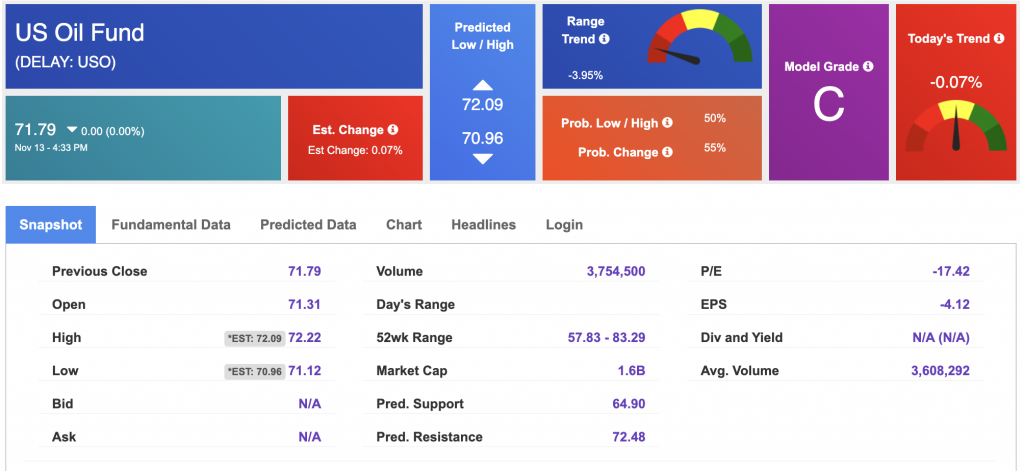
Looking at USO, a crude oil tracker, our 10-day prediction model shows mixed signals. The fund is trading at $71.79 at the time of publication. Prediction data is uploaded after the market close at 6 p.m., CST. Today’s data is based on market signals from the previous trading session.
The price for the Gold Continuous Contract (GC00) is down 0.23% at $1980.20 at the time of publication.
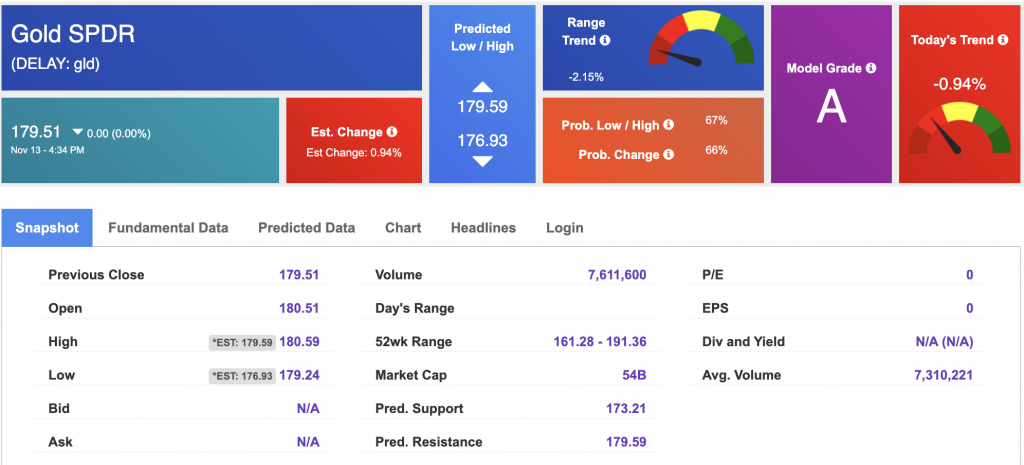
Using SPDR GOLD TRUST (GLD) as a tracker in our Stock Forecast Tool, the 10-day prediction window shows mixed signals. The gold proxy is trading at $184.79 at the time of publication. Vector signals show -0.75% for today. Prediction data is uploaded after the market close at 6 p.m., CST. Today’s data is based on market signals from the previous trading session.
The yield on the 10-year Treasury note is down at 4.422% at the time of publication.
The yield on the 30-year Treasury note is down at 4.572% at the time of publication.
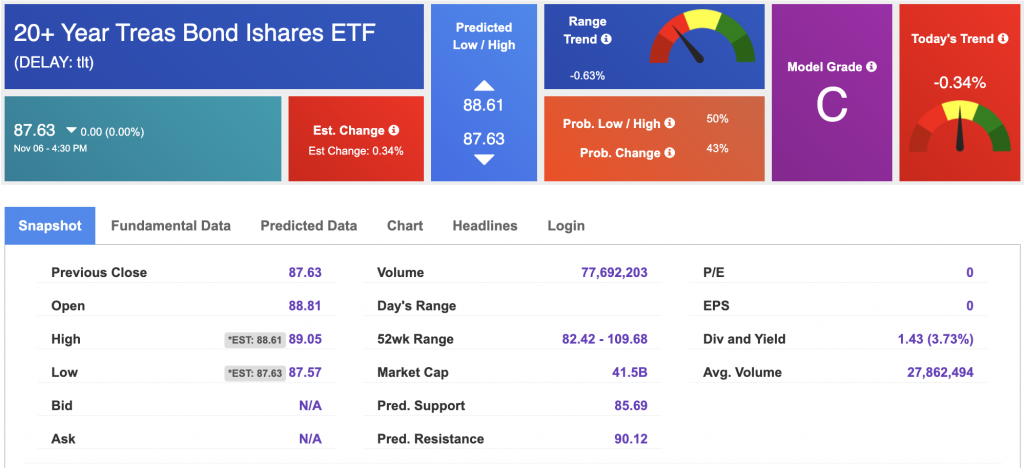
Using the iShares 20+ Year Treasury Bond ETF (TLT) as a proxy for bond prices in our Stock Forecast Tool, we see mixed signals in our 10-day prediction window. Prediction data is uploaded after the market close at 6 p.m., CST. Today’s data is based on market signals from the previous trading session.
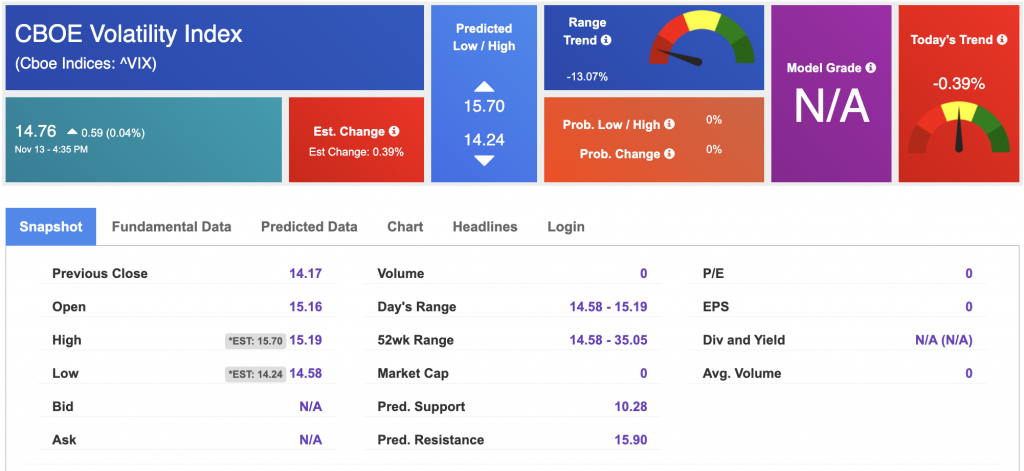
The CBOE Volatility Index (^VIX) is priced at $14.76 up 0.04% at the time of publication, and our 10-day prediction window shows mixed signals. Prediction data is uploaded after the market close at 6 p.m., CST. Today’s data is based on market signals from the previous trading session.
Please share this Tradespoon Market Commentary with your friends.
![]()

![]()
Comments Off on


Tradespoon Tools make finding winning trades in minute as easy as 1-2-3.
Our simple 3 step approach has resulted in an average return of almost 20% per trade!

