 Are you a Long-Term Trader? Then take a look at our NEW RoboInvestor Service?
CLICK HERE TO LEARN MORE
Are you a Long-Term Trader? Then take a look at our NEW RoboInvestor Service?
CLICK HERE TO LEARN MORE
The opening of this week in the U.S. financial markets was marked by mixed results, with tech stocks leading the charge, recovering from earlier losses as bond yields took a step back from their recent highs. As investors brace for a jam-packed week of earnings reports, the stage is set for some of the tech giants to shine. Microsoft and Alphabet are set to report on Tuesday, Meta Platforms on Wednesday, and Amazon on Thursday.
Monday’s trading session began with a slight setback as the 10-year Treasury yield briefly eclipsed the significant 5% mark for the first time since the 2007 financial crisis. This development sent ripples through the market, causing stocks to open on a slightly lower note. Traders are bracing themselves for an intense week of earnings reports.
Across the Atlantic, European markets remained indecisive as investor sentiments steadied in the wake of aid convoys entering the war-torn Gaza Strip. This humanitarian gesture added an element of relief to an otherwise complex global financial landscape.
The 10-year U.S. Treasury note yield made headlines, soaring to over 5% early on Monday. This level was a revival of the peak reached last week, which marked the highest point for the benchmark yield since the 2007 financial crisis. However, as the trading day progressed, the yield gradually settled back to 4.84%, providing some respite to investors.
The ongoing Israel-Hamas conflict took center stage, affecting both oil and gold prices. The decision by Israel to hold back from an expected ground invasion of Gaza temporarily eased tensions, causing a dip in these commodity prices. However, the ongoing Middle East crisis still looms over the financial world, with concerns about potential disruptions to oil supplies from the region causing a rise in assets like gold. Meanwhile, the CBOE Volatility Index, known as the VIX or “fear gauge,” experienced a spike, mainly attributed to the ongoing uncertainty related to the Israel-Hamas war and domestic political dysfunction. While it initially reached 23.08, it slightly retreated to 21.37 shortly after the market opened on Monday.
Reflecting on the past week, the U.S. stock market faced a challenging period with multiple selloffs. The beginning of the earnings season exacerbated existing concerns, leading to a gradual decline in stock prices throughout the week. It was on Friday that the market felt the full force of these headwinds, driven by mounting anxieties related to the Israel-Hamas conflict and surging bond yields.
The release of The Beige Book last week took center stage in the financial community. This report provides insights into economic activity across the U.S. It revealed that economic activity showed little to no change since the September report, with the U.S. economy exhibiting “stable” to “slightly weaker” growth. Despite rising inflationary pressures stemming from higher wages, increased oil prices, and insurance costs, companies struggled to pass these cost increases on to consumers, which resulted in shrinking profit margins.
The week prior saw a significant overshoot in interest rates, driven by weak demand for treasuries, particularly from Japan and China. This lack of demand pushed yields higher, affecting equity valuations. The yield on the 10-year Treasury note reached levels reminiscent of the Global Financial Crisis, amplifying market jitters.
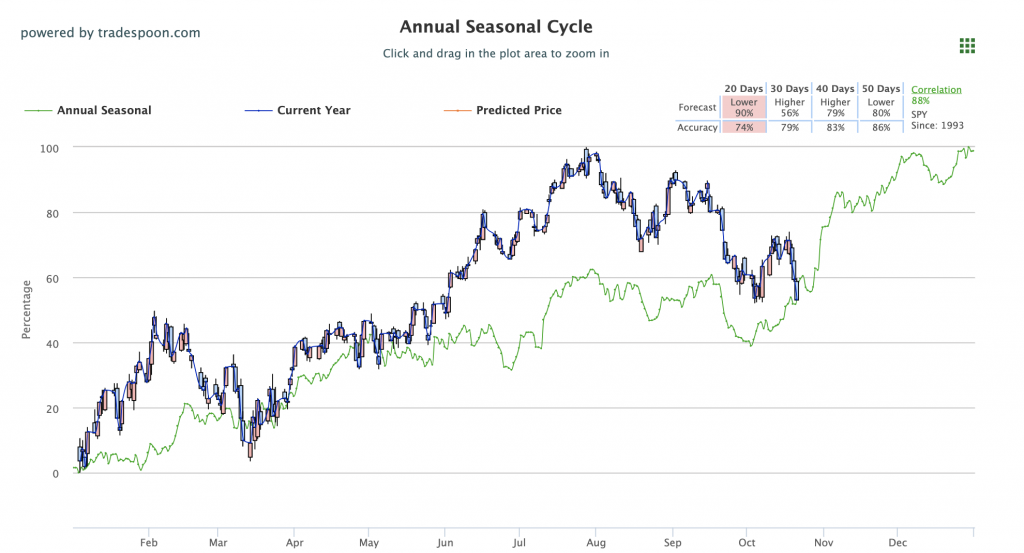
In the midst of this ongoing market volatility, a sense of caution looms over the SPY ETF. There’s a plausible scenario where the SPY may encounter resistance in the range of $450-470, with potential support levels in the $400-430 range in the coming months. The current market sentiment strongly suggests the likelihood of further downside, with signs pointing towards a potential breach of the lows seen in August. Investors are advised to proceed with care in these turbulent times. For reference, the SPY Seasonal Chart is shown below:
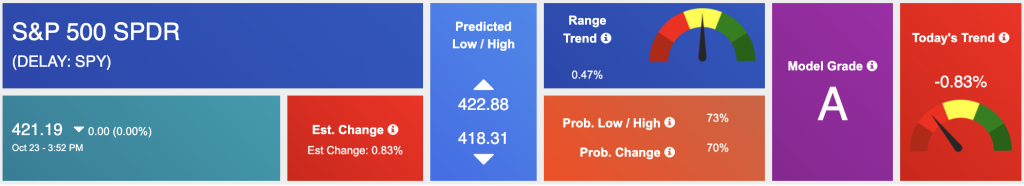
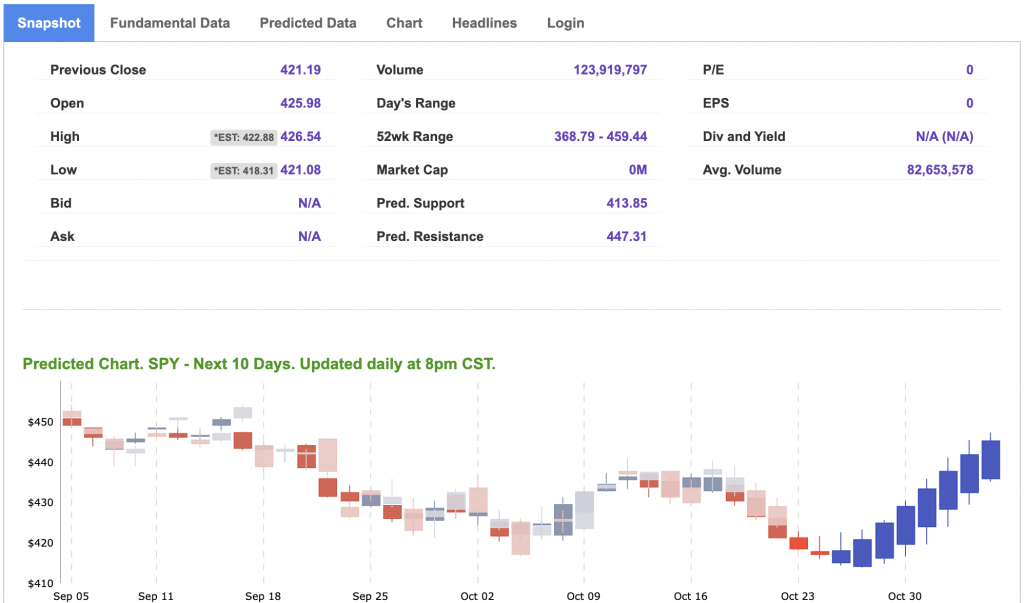
Using the “SPY” symbol to analyze the S&P 500 our 10-day prediction window shows a near-term positive outlook. Prediction data is uploaded after the market closes at 6 p.m. CST. Today’s data is based on market signals from the previous trading session.
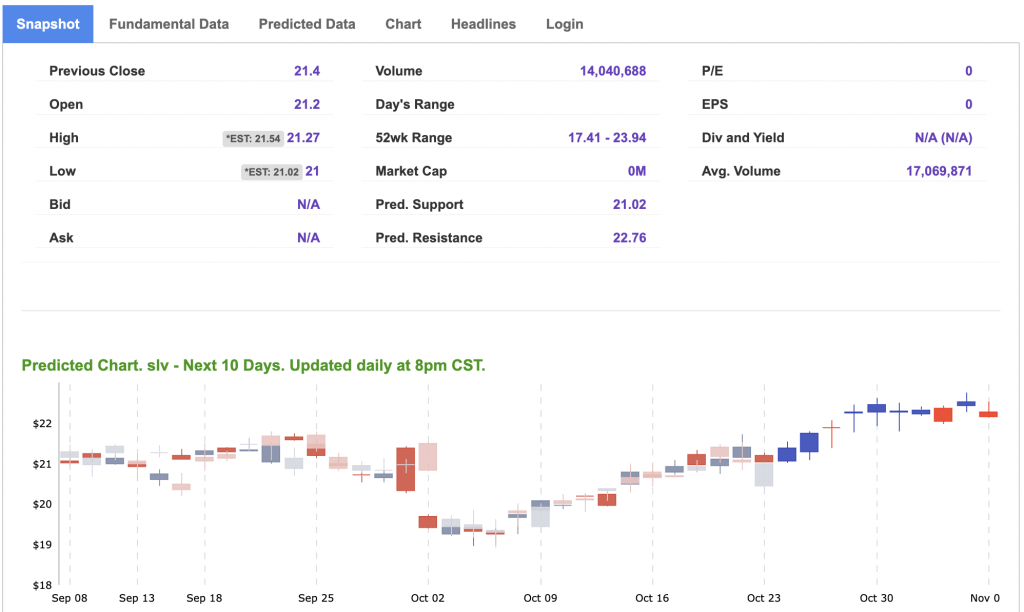
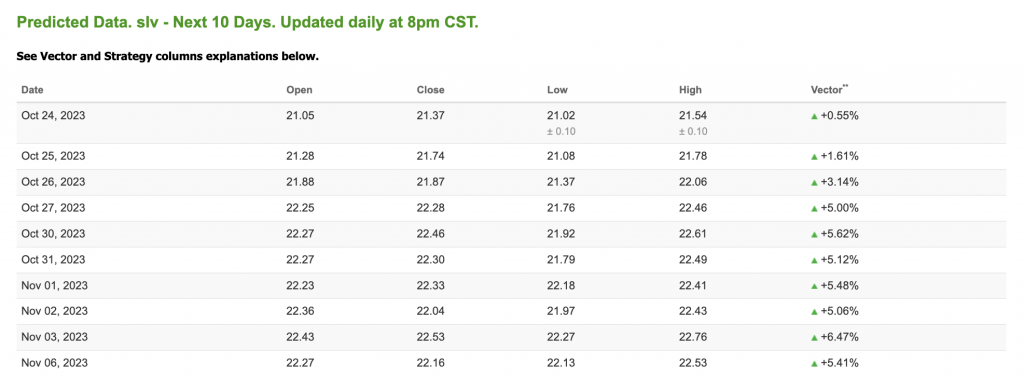
Note: The Vector column calculates the change of the Forecasted Average Price for the next trading session relative to the average of actual prices for the last trading session. The column shows the expected average price movement “Up or Down”, in percent. Trend traders should trade along the predicted direction of the Vector. The higher the value of the Vector the higher its momentum.
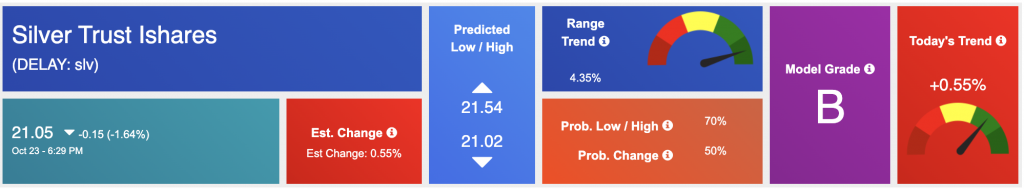
*Please note: At the time of publication Vlad Karpel does NOT have a position in the featured symbol, SLV. Our featured symbol is part of your free subscription service. It is not included in any paid Tradespoon subscription service. Vlad Karpel only trades his money in paid subscription services. If you are a paid subscriber, please review your Premium Member Picks, ActiveTrader, or MonthlyTrader recommendations. If you are interested in receiving Vlad’s picks, please click here.
West Texas Intermediate for Crude Oil delivery (CL.1) is priced at $86.11 per barrel, down 2.24%, at the time of publication.
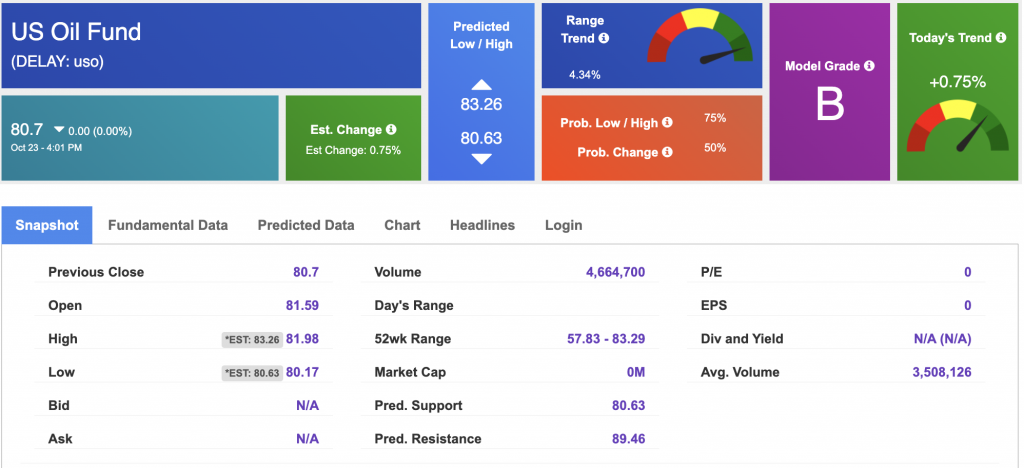
Looking at USO, a crude oil tracker, our 10-day prediction model shows mixed signals. The fund is trading at $80.7 at the time of publication. Prediction data is uploaded after the market close at 6 p.m., CST. Today’s data is based on market signals from the previous trading session.
The price for the Gold Continuous Contract (GC00) is down 0.51% at $1984.30 at the time of publication.
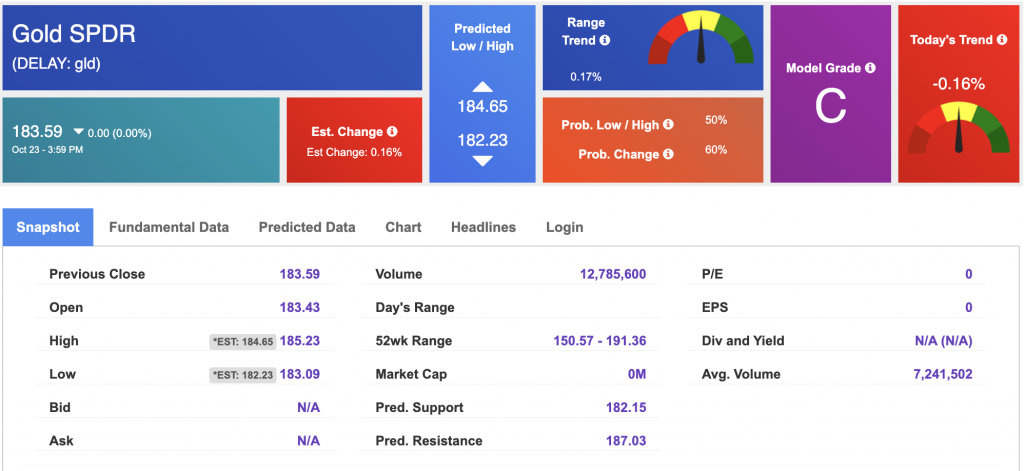
Using SPDR GOLD TRUST (GLD) as a tracker in our Stock Forecast Tool, the 10-day prediction window shows mixed signals. The gold proxy is trading at $183.59 at the time of publication. Vector signals show -0.16% for today. Prediction data is uploaded after the market close at 6 p.m., CST. Today’s data is based on market signals from the previous trading session.
The yield on the 10-year Treasury note is down at 4.849% at the time of publication.
The yield on the 30-year Treasury note is down at 5.003% at the time of publication.
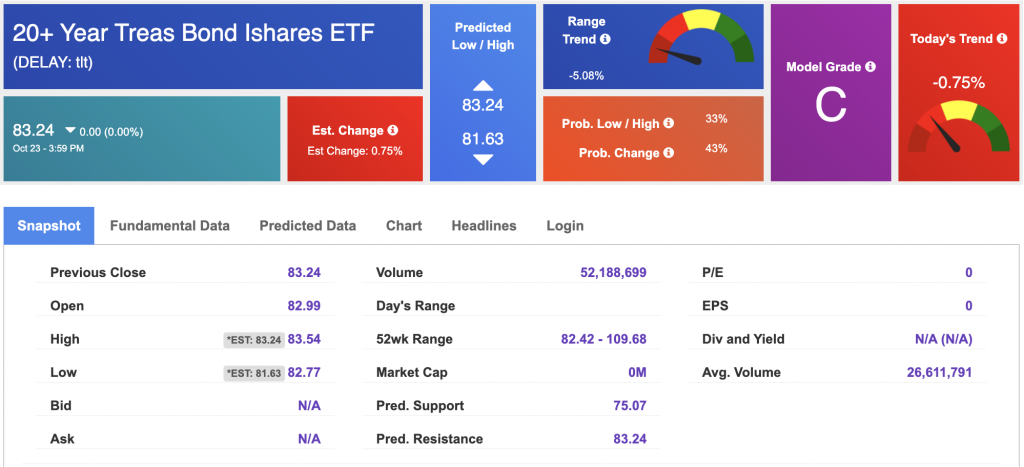
Using the iShares 20+ Year Treasury Bond ETF (TLT) as a proxy for bond prices in our Stock Forecast Tool, we see mixed signals in our 10-day prediction window. Prediction data is uploaded after the market close at 6 p.m., CST. Today’s data is based on market signals from the previous trading session.
The CBOE Volatility Index (^VIX) is priced at $20.37, down 6.17% at the time of publication, and our 10-day prediction window shows mixed signals. Prediction data is uploaded after the market close at 6 p.m., CST. Today’s data is based on market signals from the previous trading session.
Please share this Tradespoon Market Commentary with your friends.
![]()

![]()
Comments Off on


Tradespoon Tools make finding winning trades in minute as easy as 1-2-3.
Our simple 3 step approach has resulted in an average return of almost 20% per trade!

