 Sign Up for One-on-One Coaching and get our Premium Membership FREE for 1 Year!
CLICK HERE TO APPLY
Sign Up for One-on-One Coaching and get our Premium Membership FREE for 1 Year!
CLICK HERE TO APPLY
On Monday, stocks did not continue the rally from last Friday, as shares traded with mixed results. With U.S. inflation data just around the corner and fourth-quarter earnings season quickly approaching, this week will serve as a key indicator of Q1 performance, along with the Fed’s decision at next week’s Federal Open Market Committee meeting. On Tuesday, keep an eye out for key U.S. manufacturing and service PMI data to be released, while PCE data is set to be released on Friday.
Several sectors saw gains today; however, most traded with gains and losses throughout the day. Treasury yields lowered as debt prices rose; oil prices moved higher for most of the day before closing in the red, while gold finished with marginal gains. Key earnings to monitor this week will include Microsoft on Tuesday, Tesla on Wednesday, and Visa on Thursday. Additionally, quarterly earnings reports to be released this week are from 3M, American Airlines, AT&T, Boeing, Comcast, General Electric, Haliburton, MasterCard, Southwest Airlines, and Verizon.
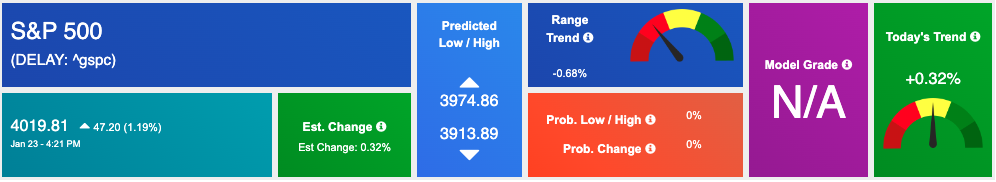
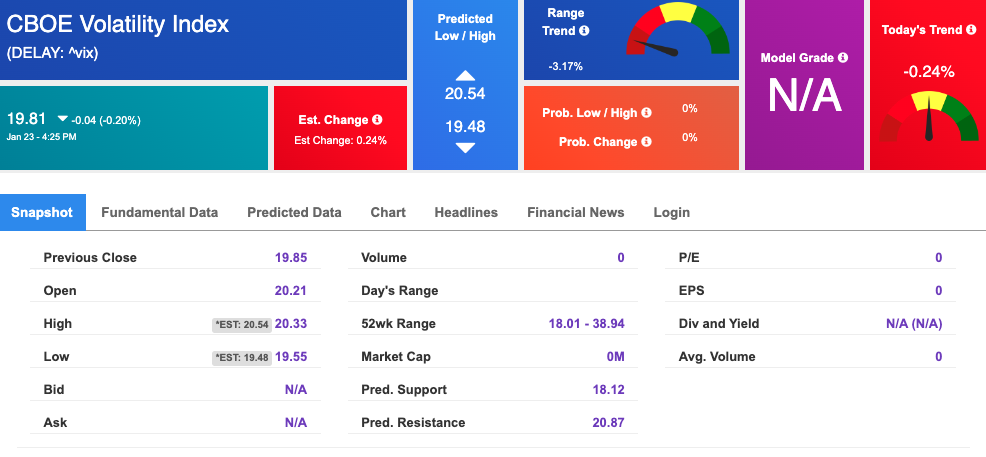
The Volatility Index, or $VIX, is hovering around the $19 benchmark as we keep an eye on earnings from large companies such as GE, Microsoft, and Tesla. We are also looking out for this week’s Purchasing Manager’s Index Data which can have a considerable impact on the market. The resistances of the S&P 500 are presently at $402 then followed by $416 while support sits at $396 subsequently to that being $391. Our forecast expects this bearish period in two weeks up to eight weeks from now; therefore we suggest our subscribers take caution and protect their investments accordingly for maximum safety during these uncertain times. Globally, both Asian and European markets closed in the green.
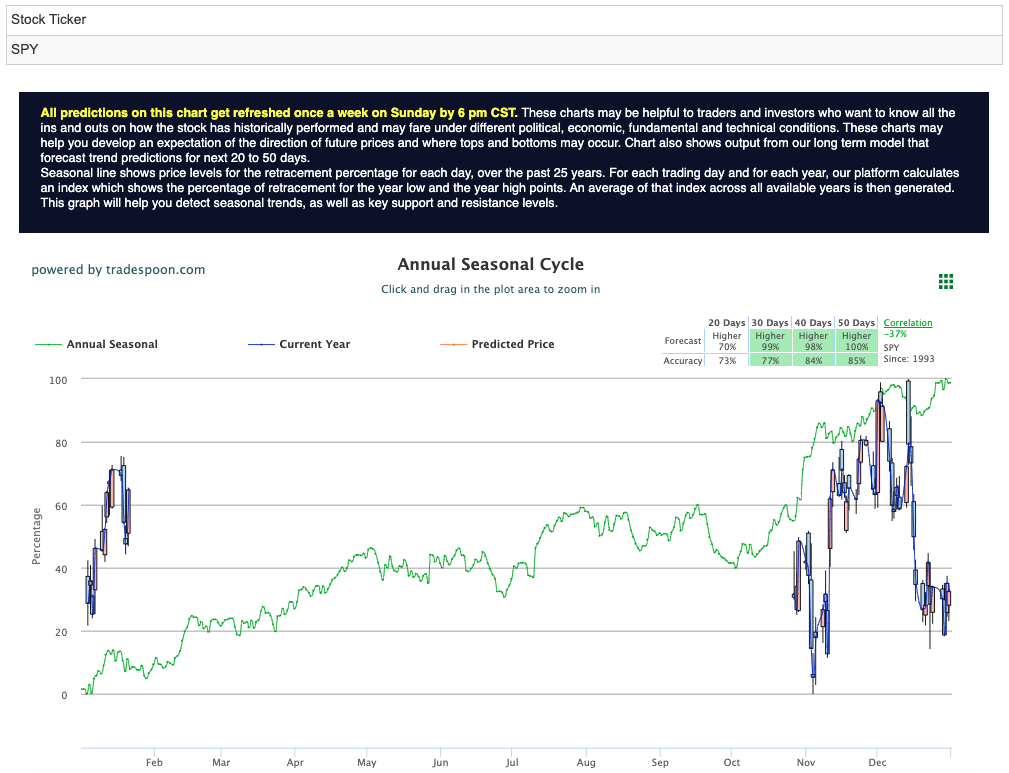
Market commentary readers should maintain clearly defined stop levels for all positions. For reference, the SPY Seasonal Chart is shown below:
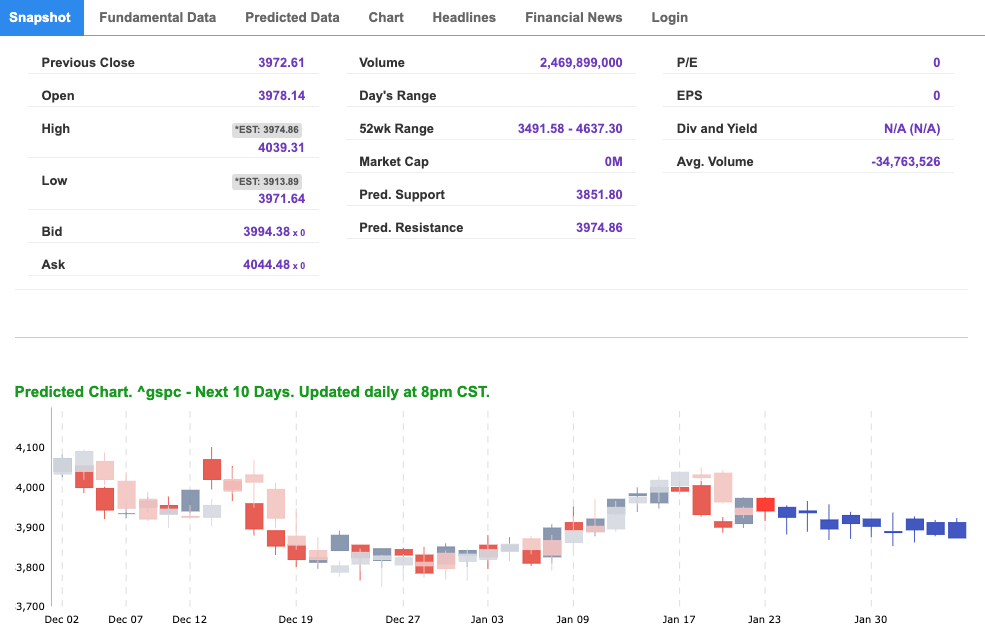
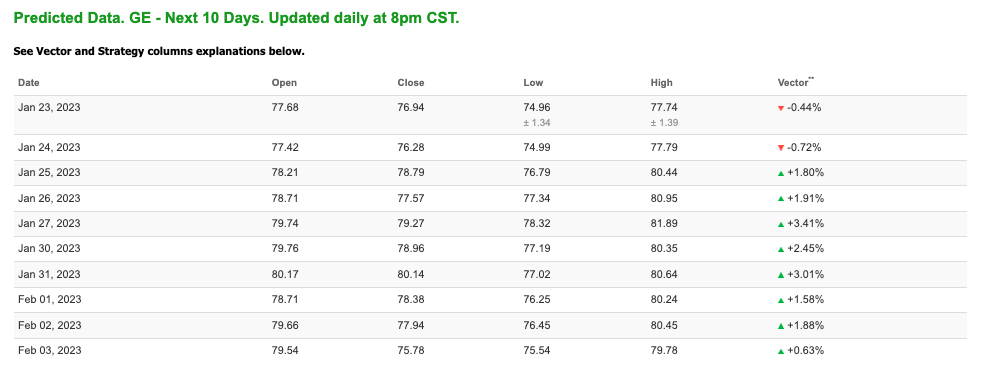
Note: The Vector column calculates the change of the Forecasted Average Price for the next trading session relative to the average of actual prices for the last trading session. The column shows the expected average price movement “Up or Down”, in percent. Trend traders should trade along the predicted direction of the Vector. The higher the value of the Vector the higher its momentum.
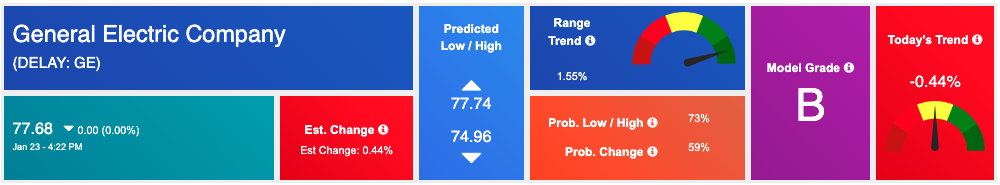
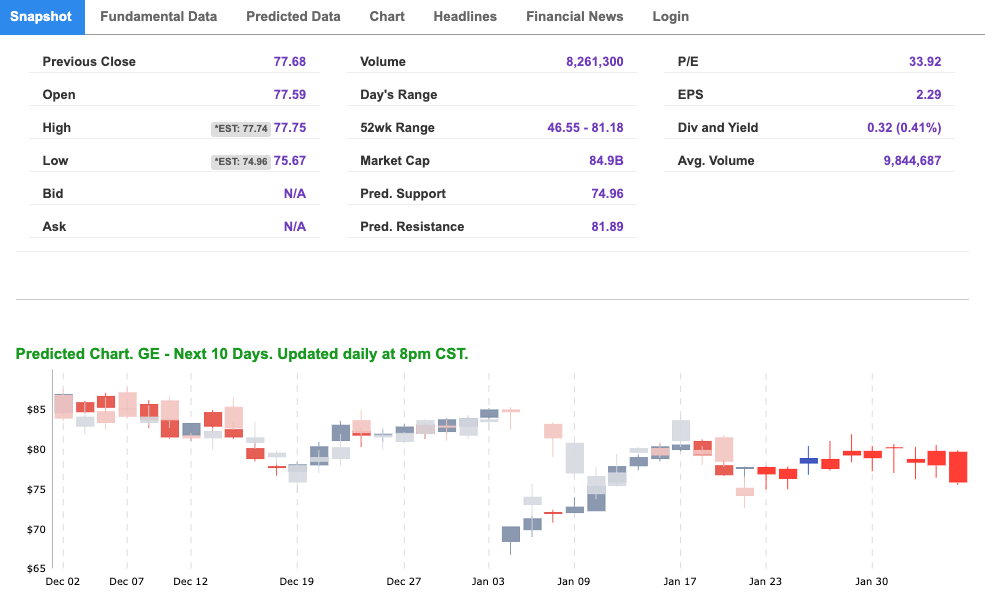
*Please note: At the time of publication Vlad Karpel does have a position in the featured symbol, GE. Our featured symbol is part of your free subscription service. It is not included in any paid Tradespoon subscription service. Vlad Karpel only trades his money in paid subscription services. If you are a paid subscriber, please review your Premium Member Picks, ActiveTrader, or MonthlyTrader recommendations. If you are interested in receiving Vlad’s picks, please click here.
West Texas Intermediate for Crude Oil delivery (CL.1) is priced at $81.62 per barrel, down 0.02%, at the time of publication.
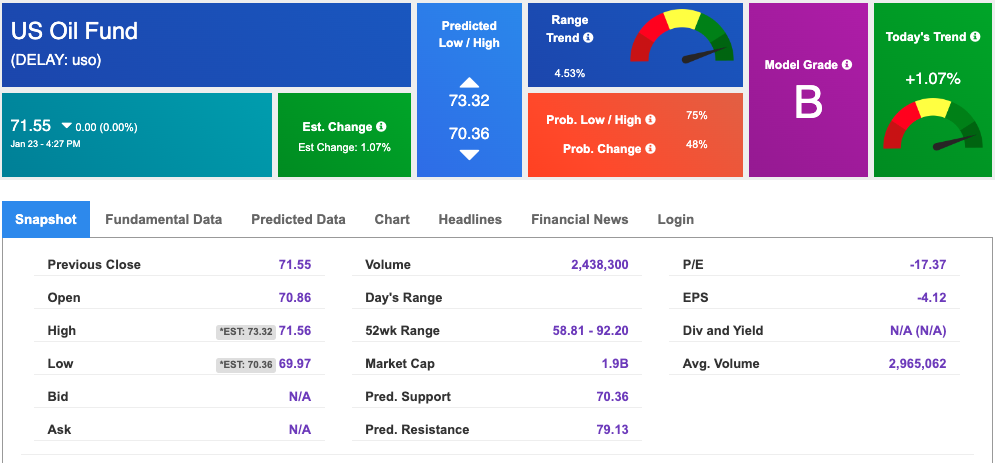
Looking at USO, a crude oil tracker, our 10-day prediction model shows mixed signals. The fund is trading at $71.55 at the time of publication. Prediction data is uploaded after the market close at 6 p.m., CST. Today’s data is based on market signals from the previous trading session.
The price for the Gold Continuous Contract (GC00) is up 0.20% at $1932.00 at the time of publication.

Using SPDR GOLD TRUST (GLD) as a tracker in our Stock Forecast Tool, the 10-day prediction window shows mixed signals. The gold proxy is trading at $179.29 at the time of publication. Vector signals show +0.15% for today. Prediction data is uploaded after the market close at 6 p.m., CST. Today’s data is based on market signals from the previous trading session.
The yield on the 10-year Treasury note is down at 3.521% at the time of publication.
The yield on the 30-year Treasury note is down at 3.683% at the time of publication.
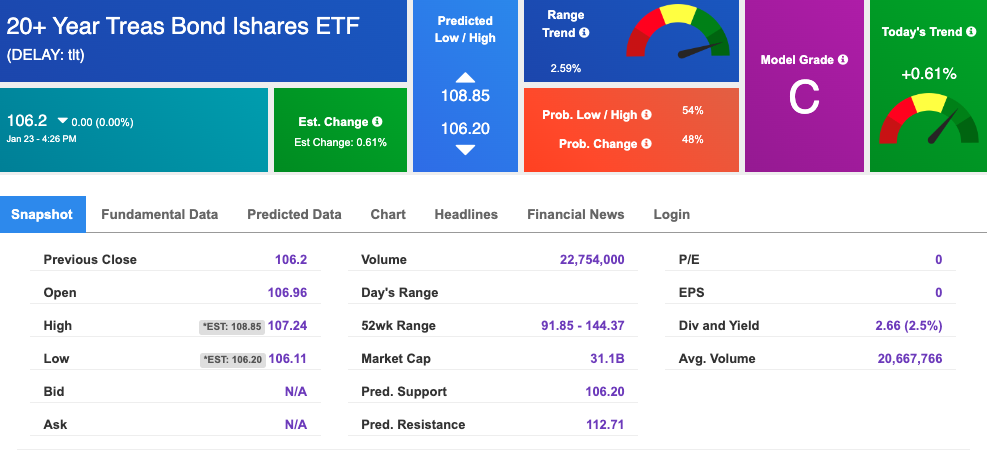
Using the iShares 20+ Year Treasury Bond ETF (TLT) as a proxy for bond prices in our Stock Forecast Tool, we see mixed signals in our 10-day prediction window. Prediction data is uploaded after the market close at 6 p.m., CST. Today’s data is based on market signals from the previous trading session.
The CBOE Volatility Index (^VIX) is $19.81 at the time of publication, and our 10-day prediction window shows mixed signals. Prediction data is uploaded after the market close at 6 p.m., CST. Today’s data is based on market signals from the previous trading session.
Please share this Tradespoon Market Commentary with your friends.
![]()

![]()
Comments Off on


Tradespoon Tools make finding winning trades in minute as easy as 1-2-3.
Our simple 3 step approach has resulted in an average return of almost 20% per trade!

