 Save Big on Commissions ($0.65 per Contract)
CLICK HERE TO LEARN MORE
Save Big on Commissions ($0.65 per Contract)
CLICK HERE TO LEARN MORE
For the fourth consecutive day, the Dow Jones, S&P 500, and Nasdaq declined as investors exit their positions ahead of the Labor Day holiday. This brought all three major U.S. indices, in the month of August, down 4%. Troubled by sluggish job growth in the private sector and worries about a worsening recession prompted by Chair Powell’s Jackson Hole address drove major indices to their fourth straight losing session. August saw a second straight month of employment declines, according to revised ADP figures which were released this morning. The U.S. private sector added 132,000 jobs in August, annual pay was up 7.6%, and large companies saw the most jobs created the report also noted. Later this week, look out for additional key employment data to release including unemployment and hourly earnings. Also released this week will be the ISM manufacturing index, August construction spending, and July factory orders. Oil sold off sharply today, while the dollar and gold also declined. Bitcoin and long-term U.S. treasury yields were on the move higher today.
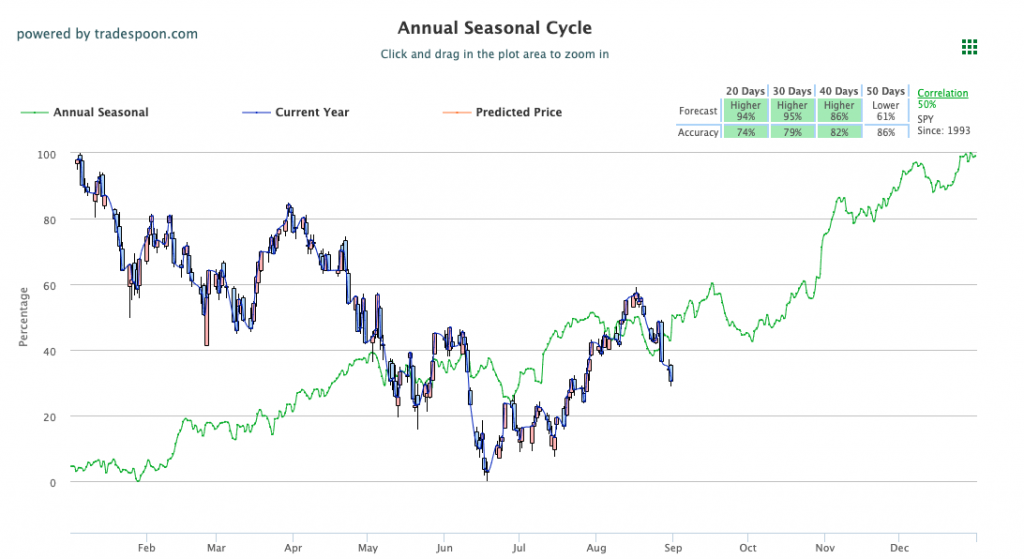
As recession fears continue to mount, we are keeping an eye on the volatility index, which is currently trading at the $28 level. The $CHWY, $HPQ, and $AVGO earnings and the August unemployment number on Friday can influence the next move in the market. We are also monitoring the overhead resistance levels in the SPY, which are presently at $406 and then $417. The $SPY support is at $390 and then $380. We expect the market to continue the current pullback for the next 2-8 weeks. For any additional rallies, which could incur, we would be a seller and encourage subscribers not to chase the market at these levels. Globally, Asian markets finished with mixed results while European markets closed in the red. We encourage all market commentary readers to maintain clearly defined stop levels for all positions. For reference, the SPY Seasonal Chart is shown below:
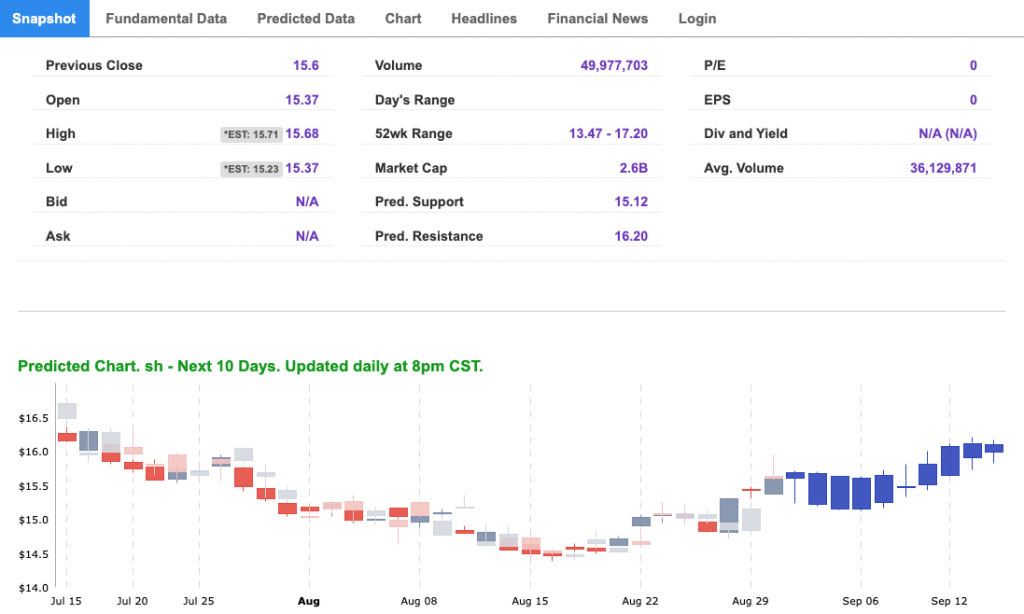
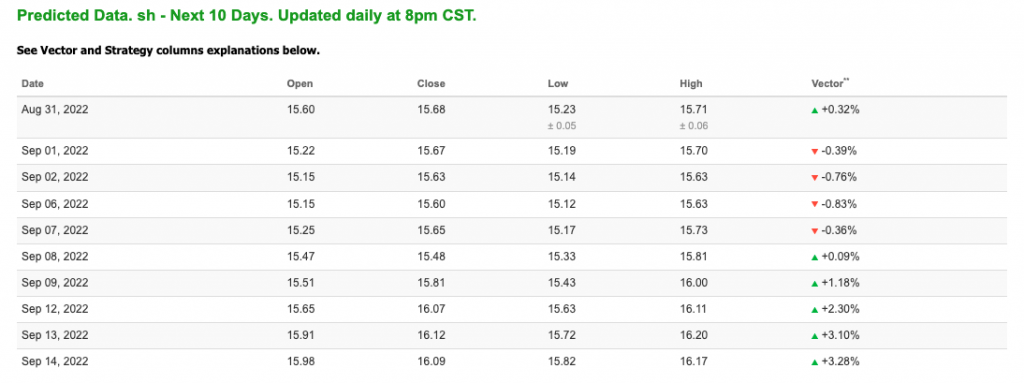
Note: The Vector column calculates the change of the Forecasted Average Price for the next trading session relative to the average of actual prices for the last trading session. The column shows the expected average price movement “Up or Down”, in percent. Trend traders should trade along the predicted direction of the Vector. The higher the value of the Vector the higher its momentum.
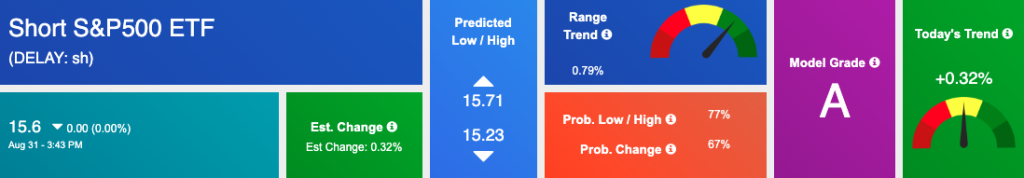
*Please note: At the time of publication Vlad Karpel does have a position in the featured symbol, SH. Our featured symbol is part of your free subscription service. It is not included in any paid Tradespoon subscription service. Vlad Karpel only trades his money in paid subscription services. If you are a paid subscriber, please review your Premium Member Picks, ActiveTrader, or MonthlyTrader recommendations. If you are interested in receiving Vlad’s picks, please click here.
West Texas Intermediate for Crude Oil delivery (CL.1) is priced at $88.80 per barrel, down 3.13%, at the time of publication.
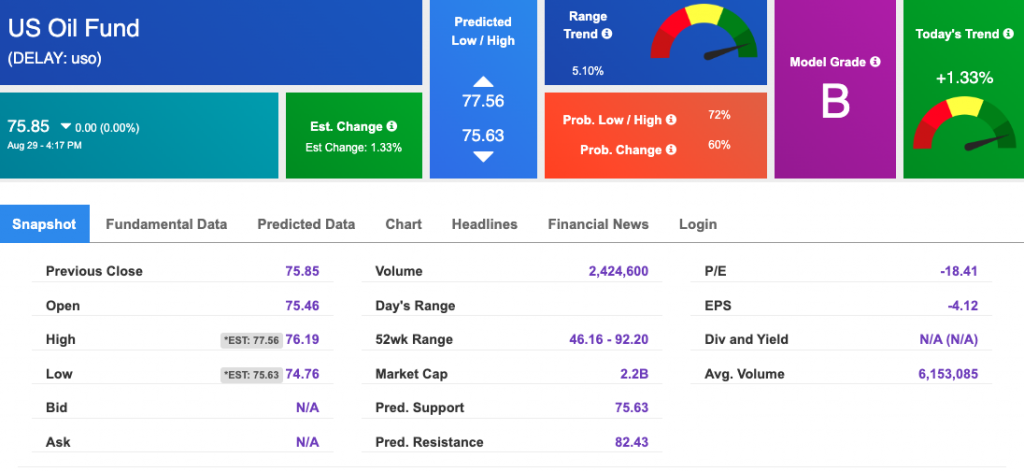
Looking at USO, a crude oil tracker, our 10-day prediction model shows mixed signals. The fund is trading at $75.85 at the time of publication. Prediction data is uploaded after the market close at 6 p.m., CST. Today’s data is based on market signals from the previous trading session.
The price for the Gold Continuous Contract (GC00) is down 0.82% at $1722.00 at the time of publication.
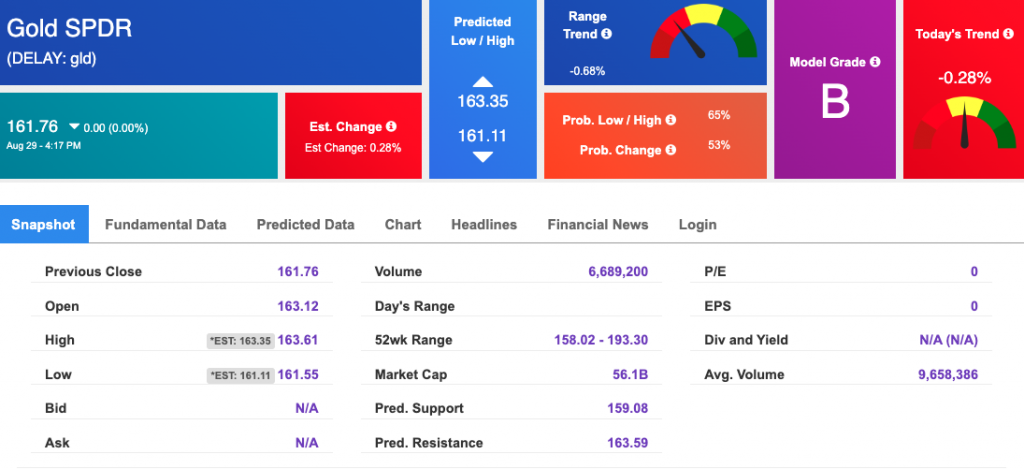
Using SPDR GOLD TRUST (GLD) as a tracker in our Stock Forecast Tool, the 10-day prediction window shows mixed signals. The gold proxy is trading at $161.76 at the time of publication. Vector signals show -0.28% for today. Prediction data is uploaded after the market close at 6 p.m., CST. Today’s data is based on market signals from the previous trading session.
The yield on the 10-year Treasury note is up, at 3.194% at the time of publication.
The yield on the 30-year Treasury note is up, at 3.299% at the time of publication.
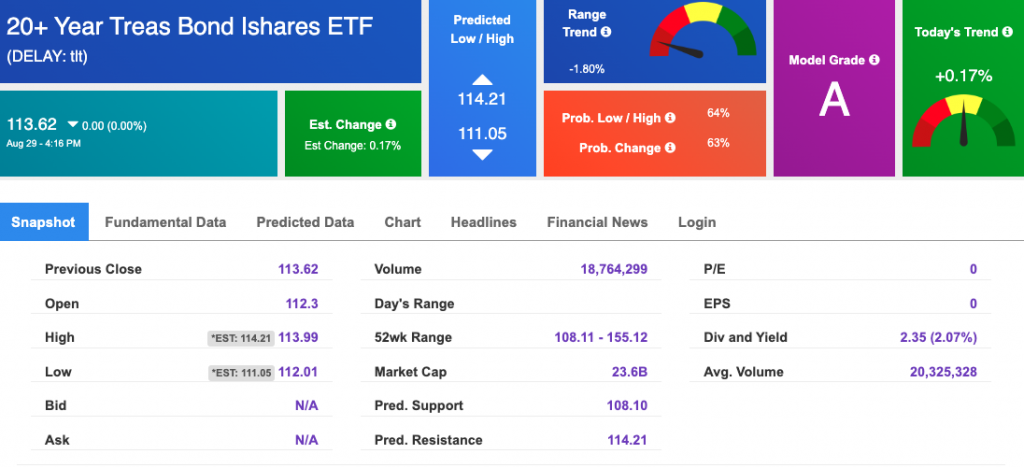
Using the iShares 20+ Year Treasury Bond ETF (TLT) as a proxy for bond prices in our Stock Forecast Tool, we see mixed signals in our 10-day prediction window. Prediction data is uploaded after the market close at 6 p.m., CST. Today’s data is based on market signals from the previous trading session.
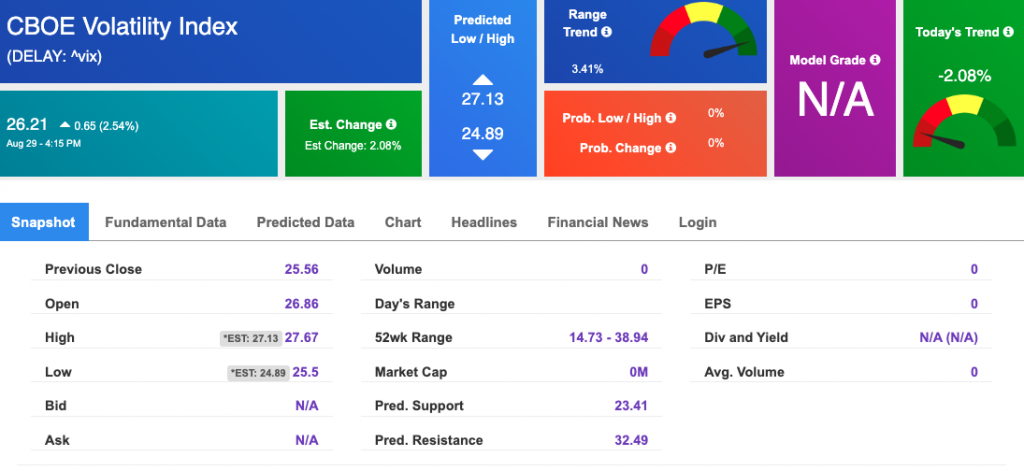
The CBOE Volatility Index (^VIX) is $26.21 at the time of publication, and our 10-day prediction window shows mixed signals. Prediction data is uploaded after the market close at 6 p.m., CST. Today’s data is based on market signals from the previous trading session.
Please share this Tradespoon Market Commentary with your friends.
![]()

![]()
Comments Off on


Tradespoon Tools make finding winning trades in minute as easy as 1-2-3.
Our simple 3 step approach has resulted in an average return of almost 20% per trade!

