 Sign Up for One-on-One Coaching and get our Premium Membership FREE for 1 Year!
CLICK HERE TO APPLY
Sign Up for One-on-One Coaching and get our Premium Membership FREE for 1 Year!
CLICK HERE TO APPLY
In early trading on Monday, U.S. stocks showcased a mixed performance as investors held their breath for updates on a potential deal to raise the U.S. debt ceiling. While both the S&P and Nasdaq appeared poised to finish the day with gains, the Dow Jones lagged behind in negative territory. Additionally, U.S. stock futures marginally declined ahead of a crucial week for debt ceiling negotiations.
With just over a week remaining until the estimated June 1 deadline for raising the debt limit, President Joe Biden is scheduled to meet with House Speaker Kevin McCarthy (R., Calif) in the latest effort to establish some progress in debt ceiling talks. Market participants are anxiously awaiting progress on a deal that would avert a potential U.S. default, a historical first. McCarthy and President Biden are set to convene at the White House at 5:30 p.m. Eastern time on Monday in hopes of reaching a resolution.
Adding to the market’s focus, St. Louis Fed President James Bullard declared on Monday that he foresees two more interest-rate hikes later this year as the central bank grapples with persistently high inflation levels. The Federal Reserve has increased interest rates conditionally since early 2022. However, recent indicators suggest a gradual slowdown in both prices and the economy, prompting Fed Chairman Jerome Powell to comment that challenges in the banking system could potentially reduce the need for interest rate hikes to the extent previously anticipated.
Also on Monday, Treasury yields advanced in response to Bullard’s hawkish remarks regarding interest rates. The 10-year yield reached 3.703%, marking its highest level in over two months while experiencing its seventh consecutive day of gains.
Investors are also keenly awaiting the release of the Federal Reserve’s May meeting minutes on Wednesday, which are expected to provide valuable insights into the central bank’s potential future course of action regarding interest rates.
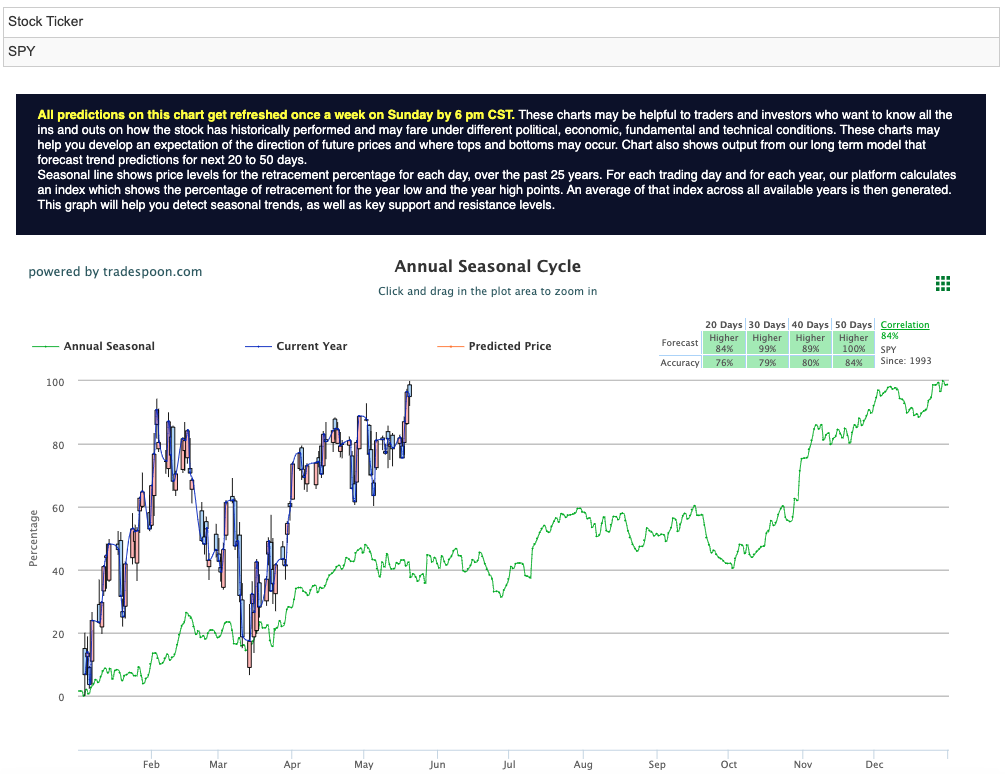
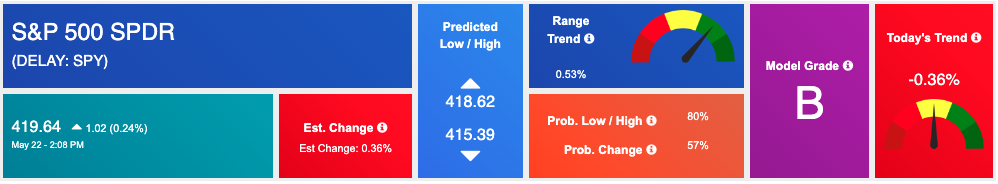
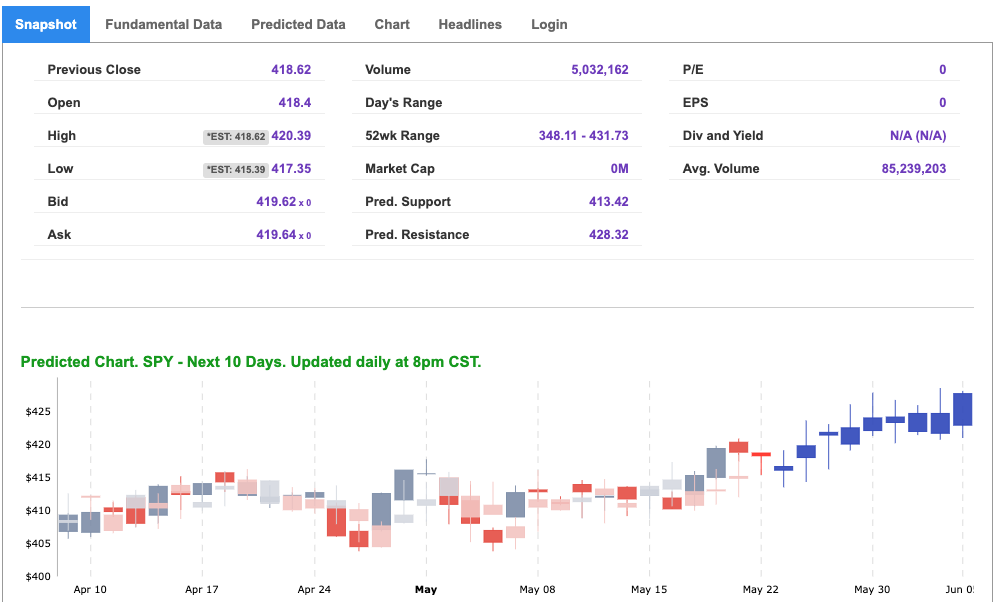
As we diligently monitor current market conditions and prepare for the next market move, it is noteworthy that the VIX, commonly known as the “fear index,” is trading near the $18 level. This week, market sentiment can be influenced by the earnings reports of Lowe’s Companies Inc. ($LOW), Zoom Video Communications Inc. ($ZM), and NVIDIA Corporation ($NVDA), in addition to the release of the Fed meeting minutes. Furthermore, we are closely observing the overhead resistance levels in the SPDR S&P 500 ETF ($SPY), which currently stand at $420 and $427 respectively. The support levels for $SPY are $414 and $408. Anticipating a sideways trading pattern in the market over the next 2-8 weeks, we currently maintain a bearish outlook and encourage our subscribers to hedge their positions accordingly. For reference, the SPY Seasonal Chart is shown below:
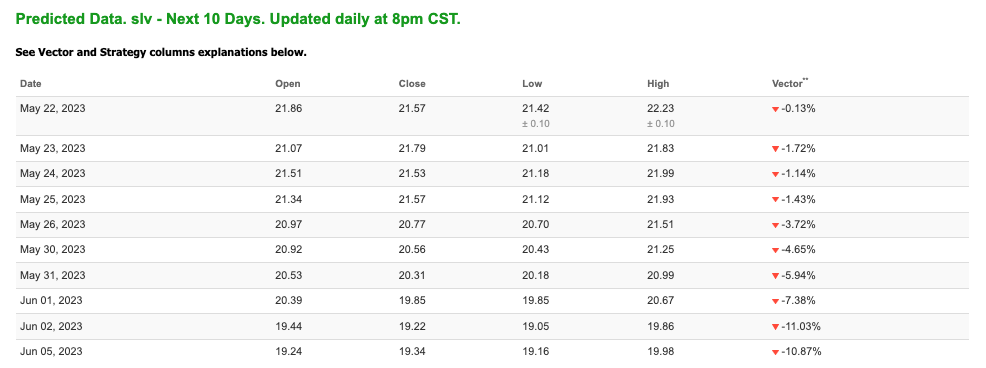
Note: The Vector column calculates the change of the Forecasted Average Price for the next trading session relative to the average of actual prices for the last trading session. The column shows the expected average price movement “Up or Down”, in percent. Trend traders should trade along the predicted direction of the Vector. The higher the value of the Vector the higher its momentum.
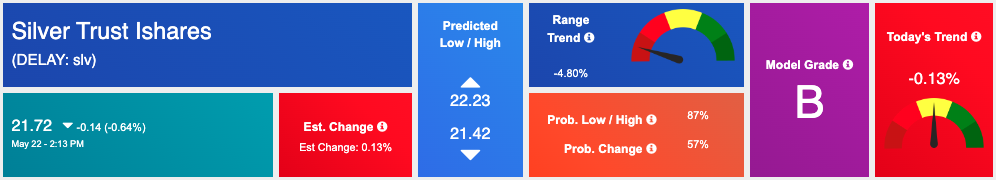
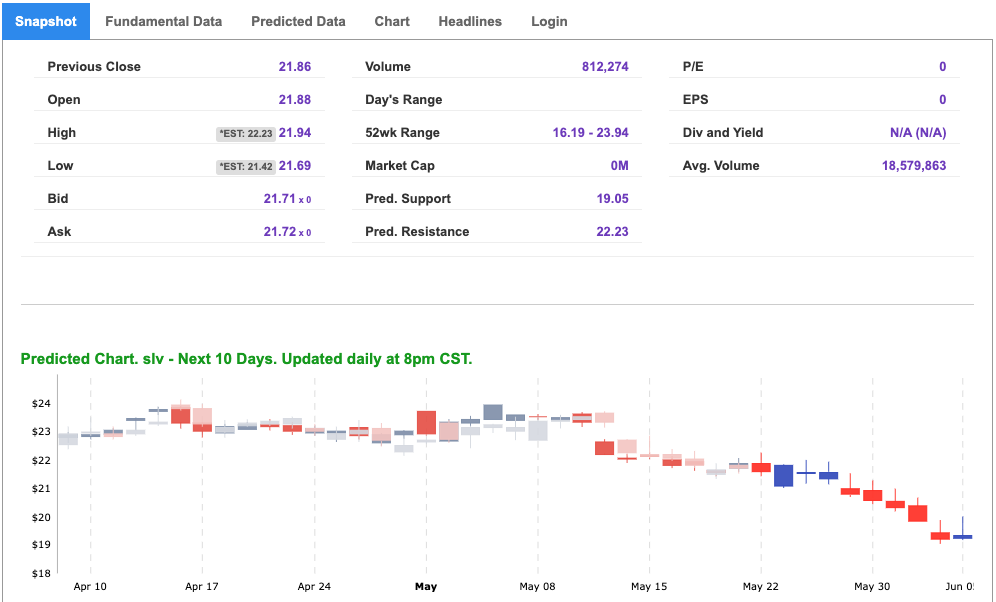
*Please note: At the time of publication Vlad Karpel does have a position in the featured symbol, SLV. Our featured symbol is part of your free subscription service. It is not included in any paid Tradespoon subscription service. Vlad Karpel only trades his money in paid subscription services. If you are a paid subscriber, please review your Premium Member Picks, ActiveTrader, or MonthlyTrader recommendations. If you are interested in receiving Vlad’s picks, please click here.
West Texas Intermediate for Crude Oil delivery (CL.1) is priced at $71.81 per barrel, up 0.36%, at the time of publication.
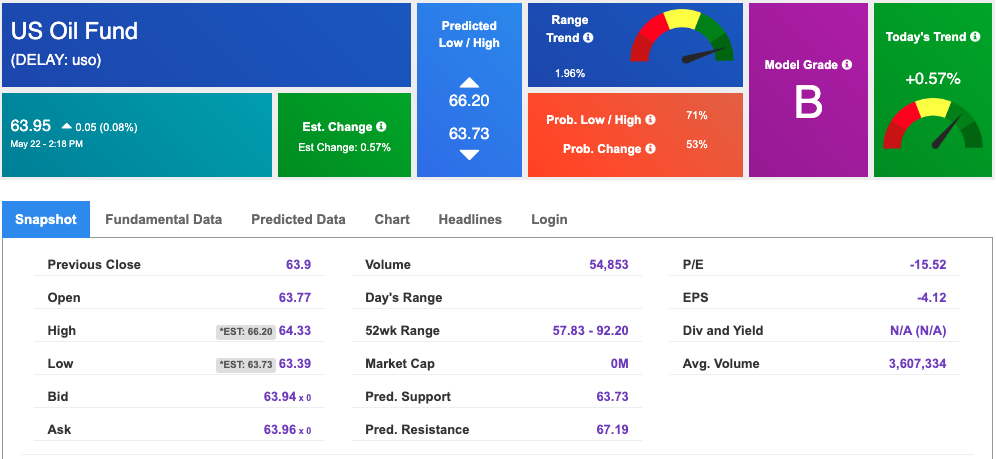
Looking at USO, a crude oil tracker, our 10-day prediction model shows mixed signals. The fund is trading at $63.95 at the time of publication. Prediction data is uploaded after the market close at 6 p.m., CST. Today’s data is based on market signals from the previous trading session.
The price for the Gold Continuous Contract (GC00) is down 0.37% at $1974.20 at the time of publication.
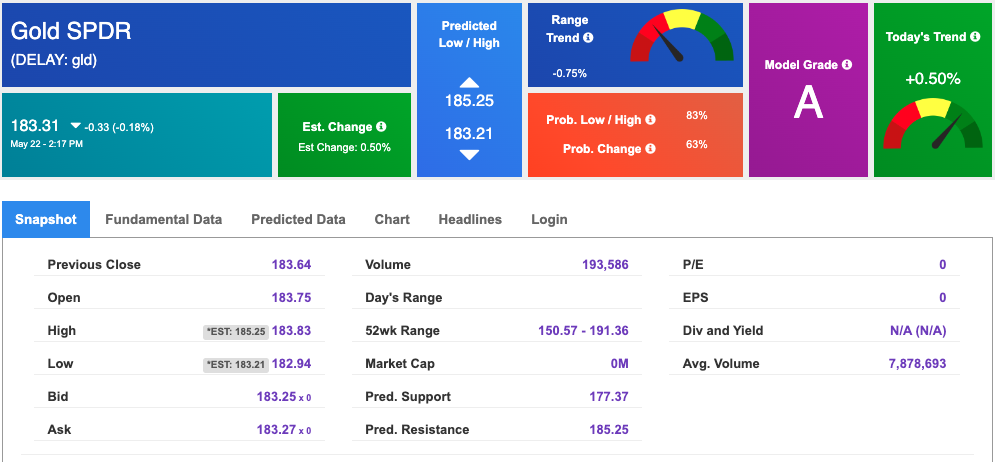
Using SPDR GOLD TRUST (GLD) as a tracker in our Stock Forecast Tool, the 10-day prediction window shows mixed signals. The gold proxy is trading at $183.31 at the time of publication. Vector signals show +0.50% for today. Prediction data is uploaded after the market close at 6 p.m., CST. Today’s data is based on market signals from the previous trading session.
The yield on the 10-year Treasury note is up at 3.717% at the time of publication.
The yield on the 30-year Treasury note is up at 3.969% at the time of publication.
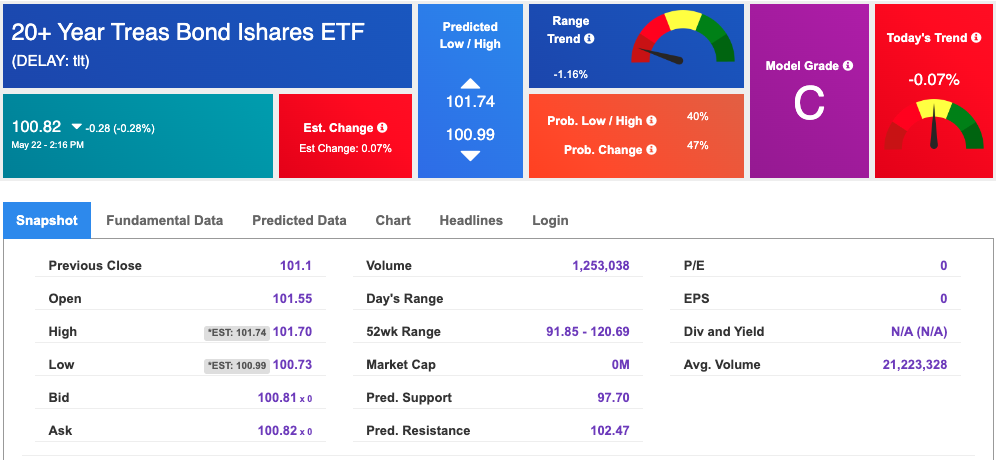
Using the iShares 20+ Year Treasury Bond ETF (TLT) as a proxy for bond prices in our Stock Forecast Tool, we see mixed signals in our 10-day prediction window. Prediction data is uploaded after the market close at 6 p.m., CST. Today’s data is based on market signals from the previous trading session.
The CBOE Volatility Index (^VIX) is $16.94 at the time of publication, and our 10-day prediction window shows mixed signals. Prediction data is uploaded after the market close at 6 p.m., CST. Today’s data is based on market signals from the previous trading session.
Please share this Tradespoon Market Commentary with your friends.
![]()

![]()
Comments Off on


Tradespoon Tools make finding winning trades in minute as easy as 1-2-3.
Our simple 3 step approach has resulted in an average return of almost 20% per trade!

