 Save Big on Commissions ($0.65 per Contract)
CLICK HERE TO LEARN MORE
Save Big on Commissions ($0.65 per Contract)
CLICK HERE TO LEARN MORE
Last week, we saw a busy market schedule characterized by a confluence of economic intricacies, punctuated by corporate earnings releases and a pivotal Federal Reserve decision, investors found themselves on the edge of their seats. As we dissect the events that shaped the market landscape, a nuanced narrative unfolds, unveiling shifts in investor sentiment, the impact of pivotal earnings reports, and the Federal Reserve’s crucial role in guiding the financial trajectory.
Wednesday marked a pivotal moment as the Federal Reserve, in a unanimous decision, maintained interest rates at 5.25%-5.50%. Fed Chair Jerome Powell, in a post-meeting press conference, emphasized concerns about persistently high inflation, quashing speculations of a rate cut in March. The market responded with a recalibration, witnessing a drop in the implied probability of future rate cuts to 35%, the lowest in over two months. Investors are now keenly scrutinizing the Fed’s forward guidance for insights into its strategy amid economic uncertainties, with a prevailing belief that the rate-hiking cycle for the current year and the next has concluded.
Post the Fed decision, the market saw a recovery as investors absorbed Powell’s comments, anticipating a pattern of higher highs and higher lows into the next year. Tech giants Apple, Amazon.com, and Meta Platforms took center stage, contributing to 28% of the S&P 500 index. Earnings results presented a mixed bag, with Pfizer and General Motors delivering positive surprises, while Microsoft and Alphabet disappointed, triggering a mid-week market plunge. Meta Platforms stole the spotlight on Friday, registering the single biggest one-day gain in market value by any U.S. company.
Beyond corporate earnings and the Fed decision, the financial world focused on vital economic indicators. The Institute for Supply Management’s Purchasing Managers Index (PMI) for January signaled an improvement in the manufacturing sector, albeit with a prolonged contraction streak. Despite U.S. manufacturing contracting for 15 consecutive months, the PMI reading of 49.1 exceeded expectations, offering a measure of comfort to investors.
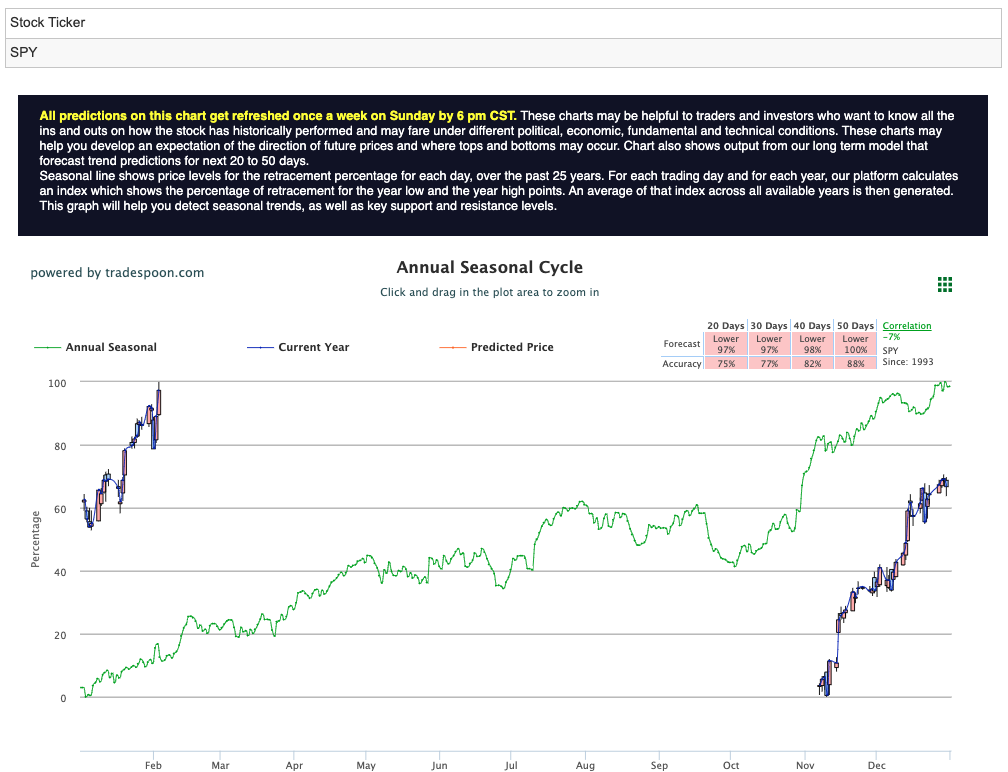
As a market-neutral stance gained popularity, a prudent perspective took hold, foreseeing potential short support levels within the 440-460 range, while the SPY rally appeared to be constrained within the $470-500 levels. Despite an initial surge to unprecedented highs, doubt persisted, hinting that the pinnacle of the rally might have occurred early in the week. For reference, the SPY Seasonal Chart is shown below:
Friday’s rally was fueled by solid earnings from Big Tech, coupled with stronger-than-expected U.S. jobs data, adding 353,000 jobs in January. Noteworthy global developments included a substantial drop in inflation in Europe, signaling a cooling economy. European stocks exhibited fluctuations after robust U.S. jobs data diminished expectations of an early Federal Reserve interest-rate cut.
As the new week unfolds, key economic reports will include ISM services on Monday, Fed U.S. deficit trade data and consumer credit on Wednesday, and wholesale inventories and unemployment on Thursday. Additionally, several Fed officials will make comments throughout the week that will be closely monitored. Looking ahead, key inflation data for the week starting February 12th, with core CPI and PPI reports, will be pivotal.
Earnings will continue to play a factor with McDonald’s and Caterpillar on Monday, Eli Lilly and Ford on Tuesday, Disney and Alibaba on Wednesday, Spirit on Thursday, and Friday featuring PepsiCo. With over 100 companies set to report, the upcoming week promises to provide a clearer picture of current market dynamics. Investors remain cautiously optimistic, navigating a sea of economic indicators and potential headwinds in the ever-evolving financial landscape.
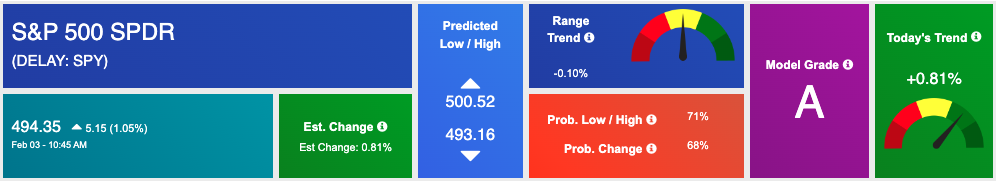
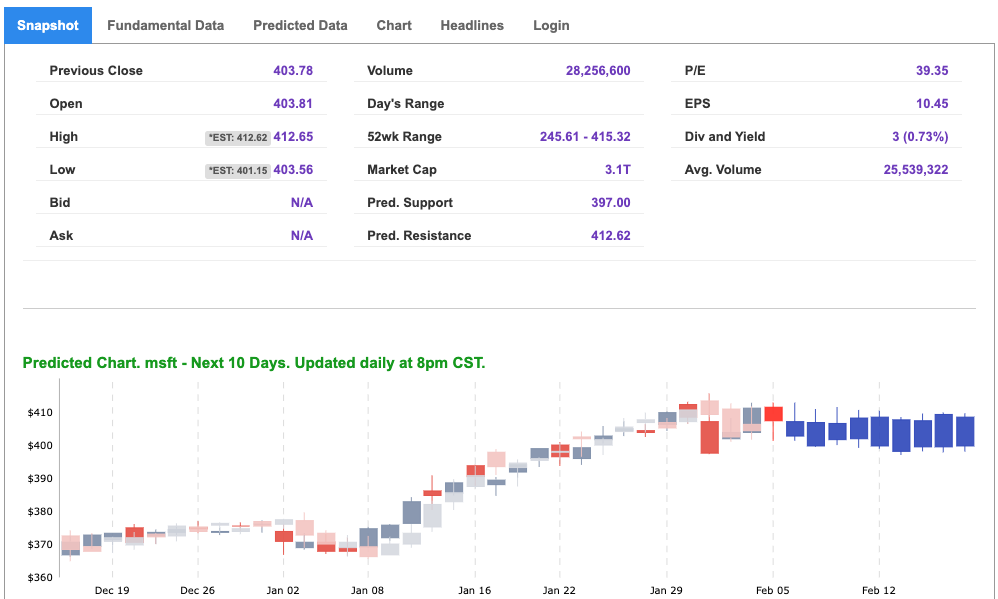
Using the “SPY” symbol to analyze the S&P 500 our 10-day prediction window shows a near-term positive outlook. Prediction data is uploaded after the market closes at 6 p.m. CST. Today’s data is based on market signals from the previous trading session.
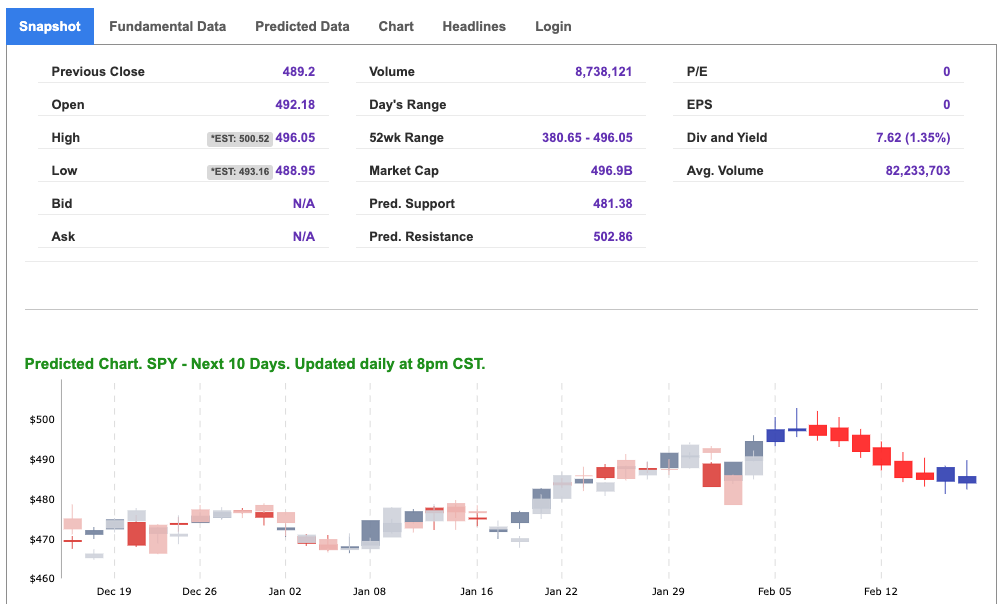
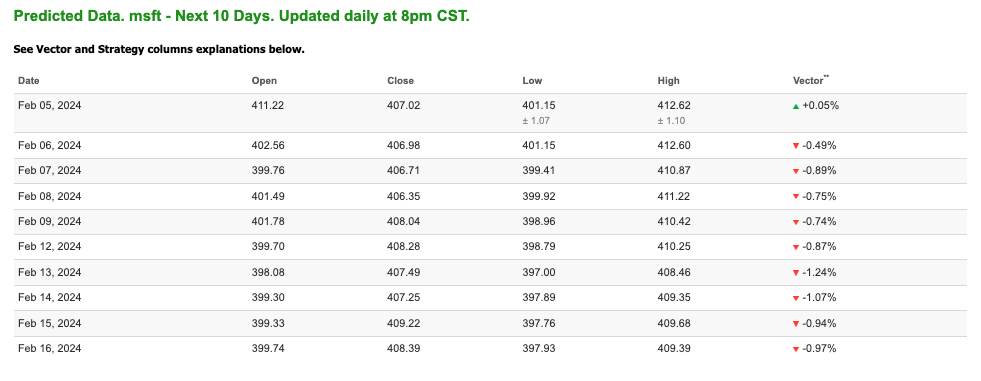
Note: The Vector column calculates the change of the Forecasted Average Price for the next trading session relative to the average of actual prices for the last trading session. The column shows the expected average price movement “Up or Down”, in percent. Trend traders should trade along the predicted direction of the Vector. The higher the value of the Vector the higher its momentum.
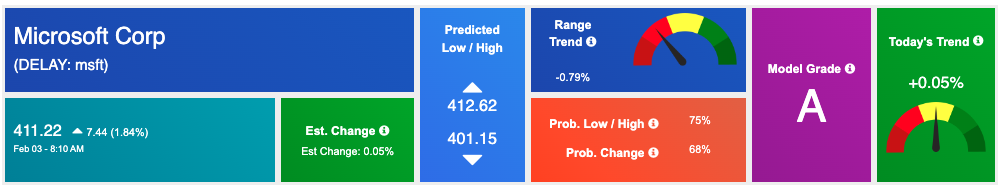
*Please note: At the time of publication Vlad Karpel does NOT have a position in the featured symbol, msft. Our featured symbol is part of your free subscription service. It is not included in any paid Tradespoon subscription service. Vlad Karpel only trades his money in paid subscription services. If you are a paid subscriber, please review your Premium Member Picks, ActiveTrader, or MonthlyTrader recommendations. If you are interested in receiving Vlad’s picks, please click here.
West Texas Intermediate for Crude Oil delivery (CL.1) is priced at $72.40 per barrel, down 1.92%, at the time of publication.
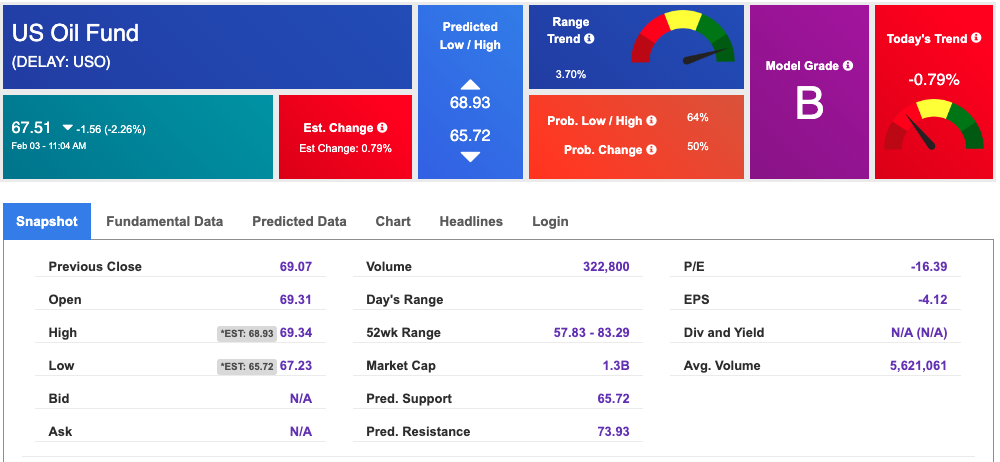
Looking at USO, a crude oil tracker, our 10-day prediction model shows mixed signals. The fund is trading at $67.51 at the time of publication. Prediction data is uploaded after the market close at 6 p.m., CST. Today’s data is based on market signals from the previous trading session.
The price for the Gold Continuous Contract (GC00) is down 0.68% at $2057.10 at the time of publication.
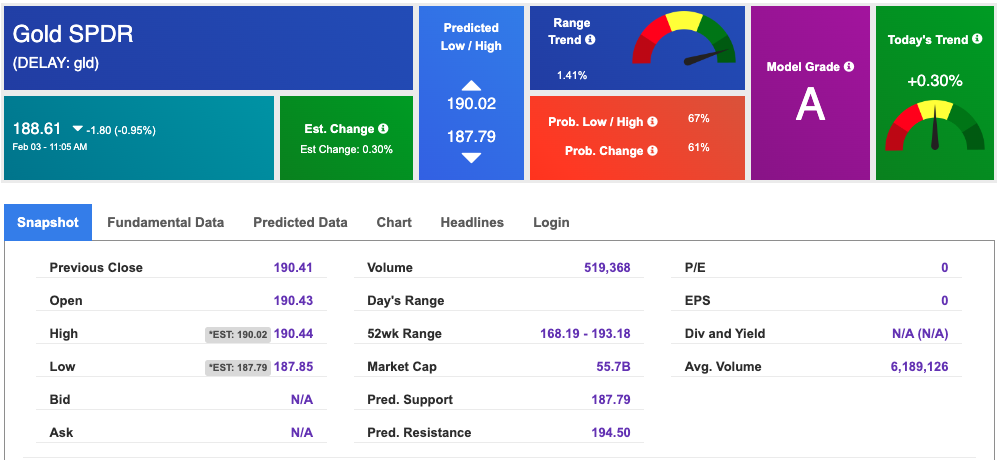
Using SPDR GOLD TRUST (GLD) as a tracker in our Stock Forecast Tool, the 10-day prediction window shows mixed signals. The gold proxy is trading at $188.61 at the time of publication. Vector signals show +0.30% for today. Prediction data is uploaded after the market close at 6 p.m., CST. Today’s data is based on market signals from the previous trading session.
The yield on the 10-year Treasury note is up at 4.023% at the time of publication.
The yield on the 30-year Treasury note is up at 4.222% at the time of publication.
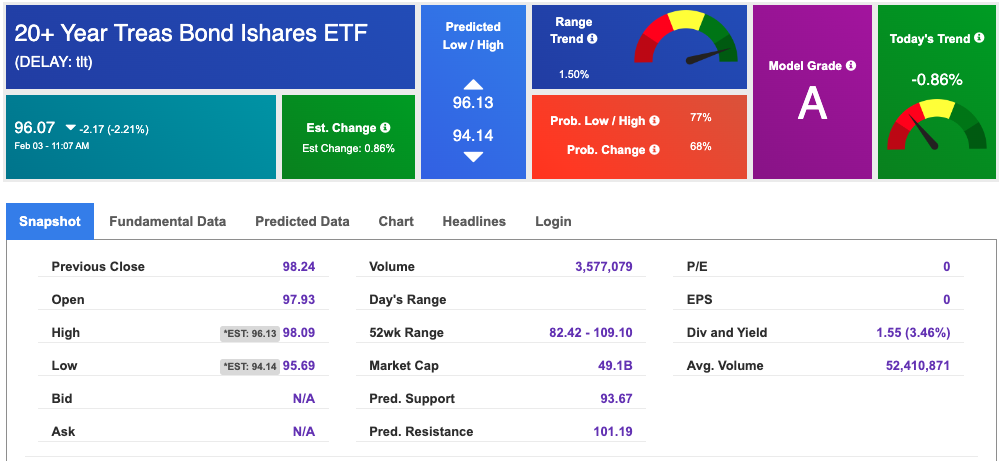
Using the iShares 20+ Year Treasury Bond ETF (TLT) as a proxy for bond prices in our Stock Forecast Tool, we see mixed signals in our 10-day prediction window. Prediction data is uploaded after the market close at 6 p.m., CST. Today’s data is based on market signals from the previous trading session.
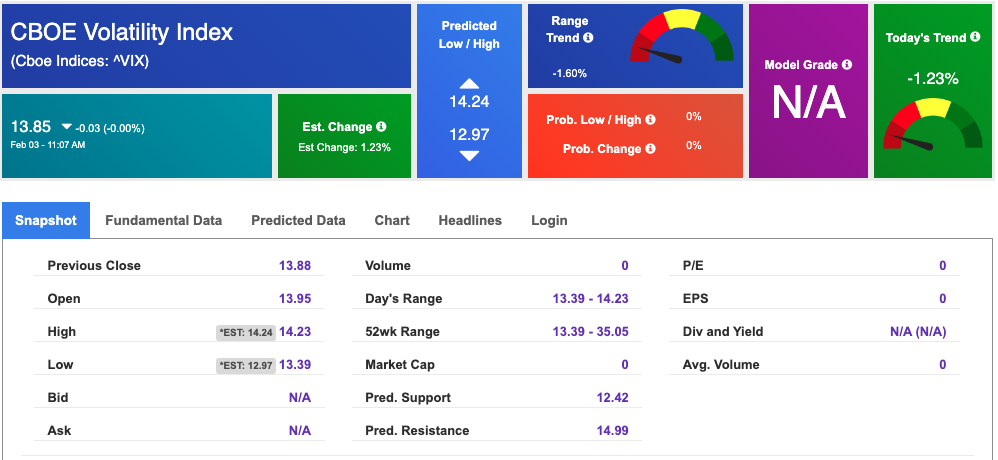
The CBOE Volatility Index (^VIX) is priced at $13.7 up 0.03% at the time of publication, and our 10-day prediction window shows mixed signals. Prediction data is uploaded after the market close at 6 p.m., CST. Today’s data is based on market signals from the previous trading session.
Please share this Tradespoon Market Commentary with your friends.
![]()

![]()
Comments Off on


Tradespoon Tools make finding winning trades in minute as easy as 1-2-3.
Our simple 3 step approach has resulted in an average return of almost 20% per trade!

