 Save Big on Commissions ($0.65 per Contract)
CLICK HERE TO LEARN MORE
Save Big on Commissions ($0.65 per Contract)
CLICK HERE TO LEARN MORE
Concerns about inflation and the Federal Reserve weighed on US stock prices today, as all three main indices closed in the red. Economic stability and health of the U.S. economy are prime factors investors are watching as inflation and the Fed’s interest rate path will continue to be monitored and likely impact market direction. Additionally, economic reports released this week have signaled some market direction as the manufacturing report for May showed an impressive rise in the prior month, as well as the latest job openings report which dropped. The biggest indicator of U.S. economic health is the Beige Book which was also released today and showed modest growth in the previous period. A Federal Open Market Committee meeting is scheduled for later this month, as well as another in July, in which both meetings are projected to produce an interest rate hike.
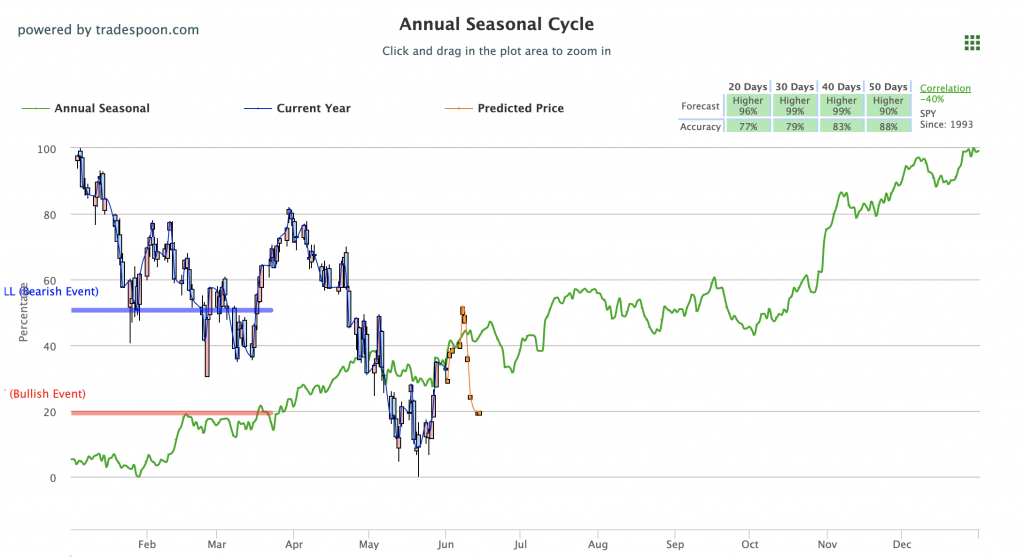
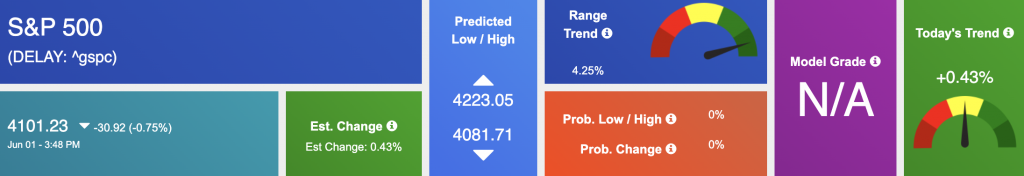
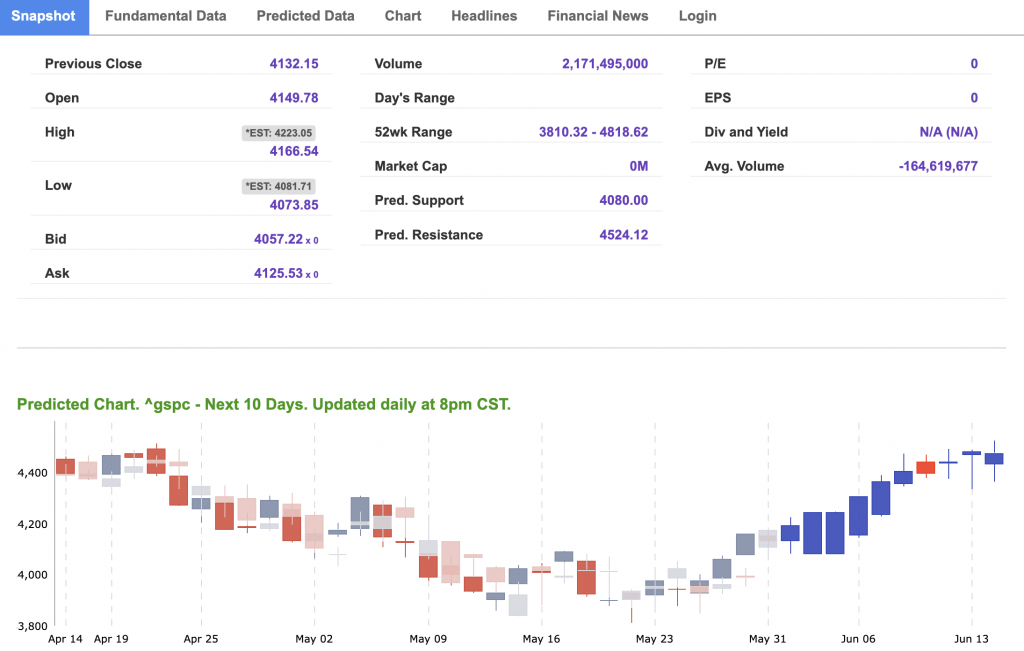
The VIX is presently near the 25 level. The $MDB, $NTAP, and $CHWY earnings this week might have a significant influence on the market’s next move. We are watching the overhead resistance levels in the SPY, which are presently at $420 and then $430. The $SPY support is at $404 and then $396. We anticipate the market to resume its recent upward momentum for the next 2-4 weeks. In the near term, the market is highly oversold and on track for a rebound. Globally, Asian markets finished with mixed results while European markets closed in the red. We encourage all market commentary readers to maintain clearly defined stop levels for all positions. For reference, the SPY Seasonal Chart is shown below:
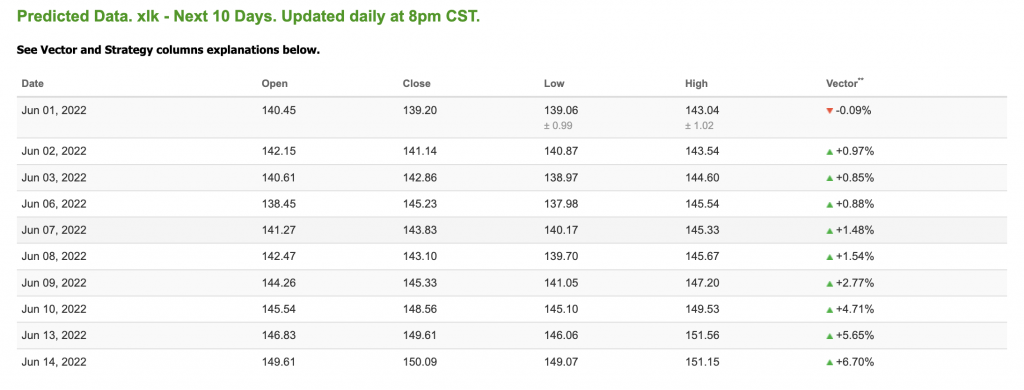
Note: The Vector column calculates the change of the Forecasted Average Price for the next trading session relative to the average of actual prices for the last trading session. The column shows the expected average price movement “Up or Down”, in percent. Trend traders should trade along the predicted direction of the Vector. The higher the value of the Vector the higher its momentum.
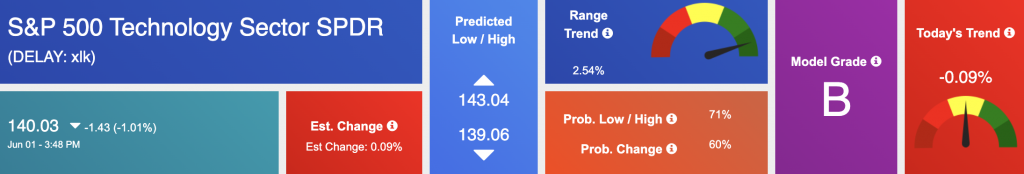
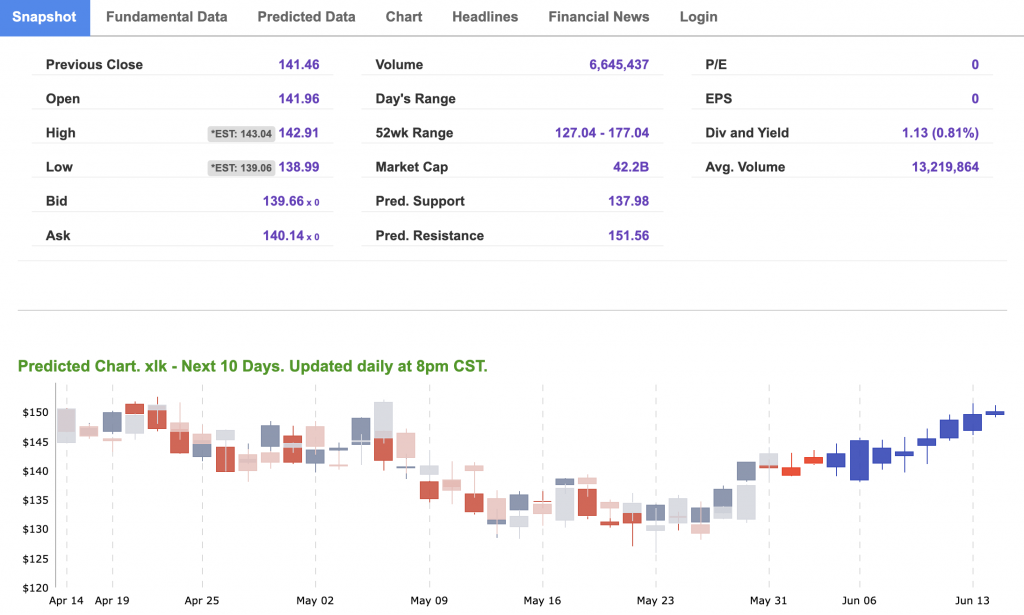
*Please note: At the time of publication Vlad Karpel does have a position in the featured symbol, XLK. Our featured symbol is part of your free subscription service. It is not included in any paid Tradespoon subscription service. Vlad Karpel only trades his money in paid subscription services. If you are a paid subscriber, please review your Premium Member Picks, ActiveTrader, or MonthlyTrader recommendations. If you are interested in receiving Vlad’s picks, please click here.
West Texas Intermediate for Crude Oil delivery (CL.1) is priced at $114.78 per barrel, up 0.10%, at the time of publication.
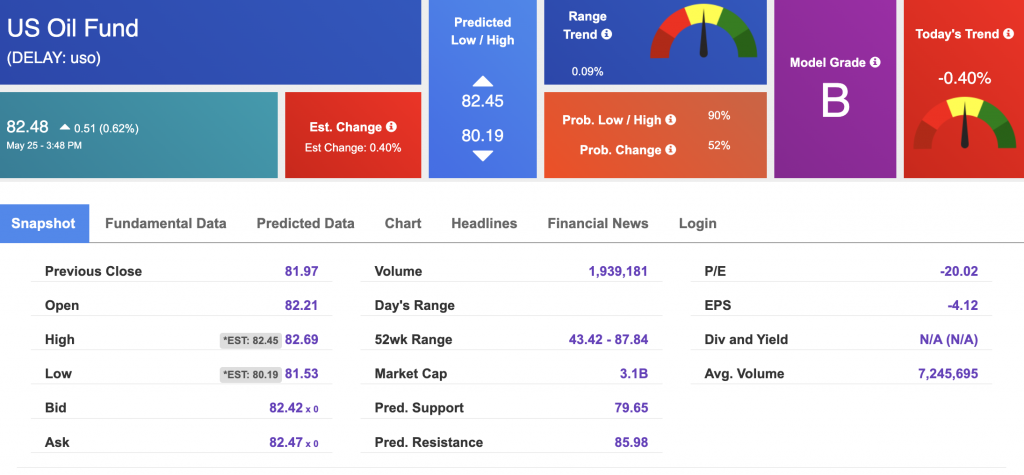
Looking at USO, a crude oil tracker, our 10-day prediction model shows mixed signals. The fund is trading at $82.48 at the time of publication. Prediction data is uploaded after the market close at 6 p.m., CST. Today’s data is based on market signals from the previous trading session.
The price for the Gold Continuous Contract (GC00) is up 0.06% at $1849.60 at the time of publication.
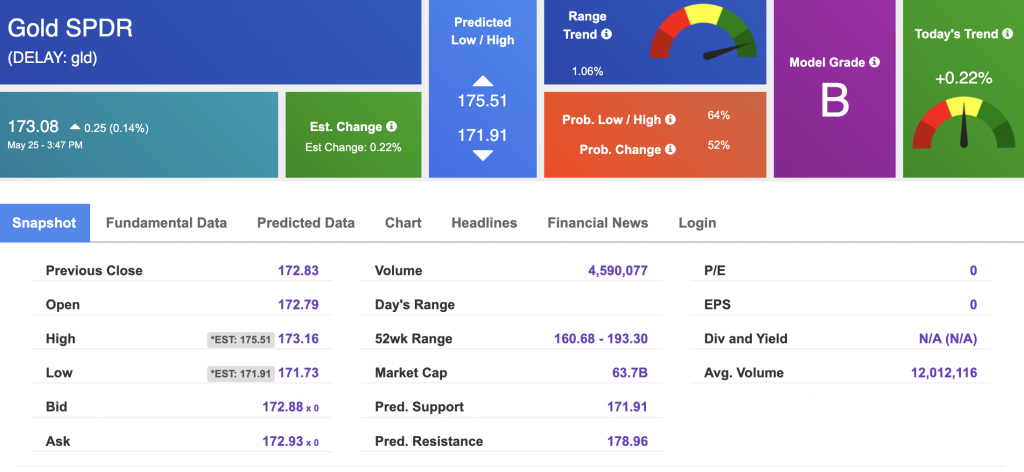
Using SPDR GOLD TRUST (GLD) as a tracker in our Stock Forecast Tool, the 10-day prediction window shows mixed signals. The gold proxy is trading at $173.08 at the time of publication. Vector signals show +0.22% for today. Prediction data is uploaded after the market close at 6 p.m., CST. Today’s data is based on market signals from the previous trading session.
The yield on the 10-year Treasury note is up, at 2.914% at the time of publication.
The yield on the 30-year Treasury note is up, at 3.063% at the time of publication.
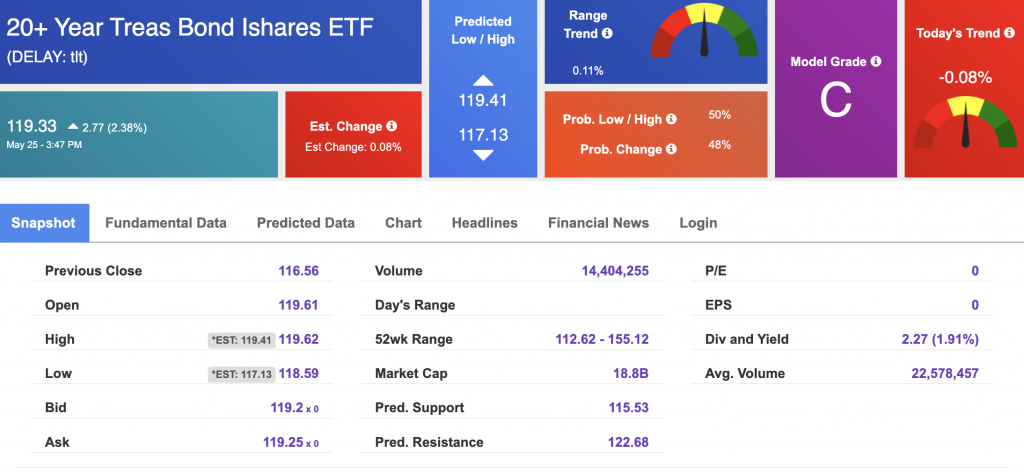
Using the iShares 20+ Year Treasury Bond ETF (TLT) as a proxy for bond prices in our Stock Forecast Tool, we see mixed signals in our 10-day prediction window. Prediction data is uploaded after the market close at 6 p.m., CST. Today’s data is based on market signals from the previous trading session.
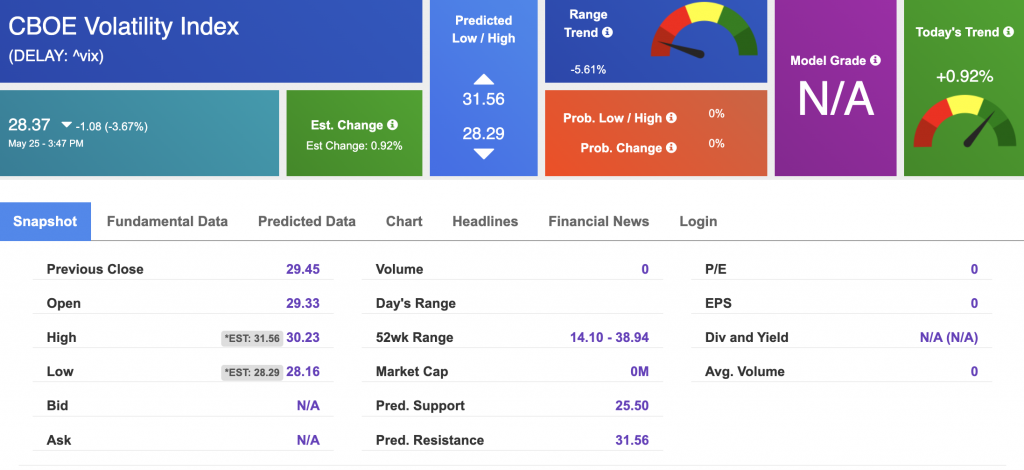
The CBOE Volatility Index (^VIX) is $28.48 at the time of publication, and our 10-day prediction window shows mixed signals. Prediction data is uploaded after the market close at 6 p.m., CST. Today’s data is based on market signals from the previous trading session.
Please share this Tradespoon Market Commentary with your friends.
![]()

![]()
Comments Off on


Tradespoon Tools make finding winning trades in minute as easy as 1-2-3.
Our simple 3 step approach has resulted in an average return of almost 20% per trade!

