 Save Big on Commissions ($0.65 per Contract)
CLICK HERE TO LEARN MORE
Save Big on Commissions ($0.65 per Contract)
CLICK HERE TO LEARN MORE
In a somewhat subdued start to the week, Monday witnessed marginal declines in the Dow and S&P, while the NASDAQ managed to close slightly higher. Earnings took the spotlight initially, setting the tone for the week, but investors are eyeing Thursday for a pivotal event—the release of the Federal Reserve’s preferred inflation gauge, the core personal consumption expenditures (PCE) index for October. This key metric will provide insights into the progress of the central bank’s battle against inflation.
European Stocks Reverse Recent Gains: Following a holiday-shortened week, the market’s next significant test for the November rally looms with the personal consumption expenditures price index scheduled for Thursday. The anticipation is high, and the Federal Reserve’s preferred inflation measure will be followed by a public appearance from Chair Jerome Powell on Friday.
Fed Rates and Treasury Yields: The persistent speculation about falling Fed rates in the coming year continues to exert pressure on Treasury yields. The 10-year yield is currently at 4.455%, and the two-year at 4.950%, both experiencing declines last week. October’s housing data, expected to be released at 10 a.m. ET, is anticipated to support the notion that rates are currently high. Market expectations lean towards the Fed maintaining rates until May, with the likelihood of rate cuts increasing thereafter, as indicated by Fed-fund futures.
New Home Sales and Nvidia’s Rollercoaster: New home sales faced an unexpected dip in October, signaling the impact of rising mortgage rates. On the corporate front, Nvidia (NVDA) rebounded with a 1.4% gain after facing a 3% drop on Friday due to the reported delay in launching a new artificial intelligence chip for China. Despite solid earnings last week, the stock experienced a 4% decline, reflecting current overbought conditions.
Upcoming Earnings Reports: This week, reports are expected from key players such as Salesforce (CRM), Intuit (INTU), Workday (WDAY), Snowflake (SNOW), CrowdStrike Holdings (CRWD), Splunk (SPLK), Hewlett Packard Enterprise (HPE), NetApp (NTAP), Dollar Tree (DLTR), Okta (OKTA), Dell Technologies (DELL), Marvell Technology (MRVL), UiPath (PATH), and Kroger (KR).
Oil Prices Near Yearly Lows Amid OPEC Meeting Delay: OPEC meeting delays have contributed to a drop in oil prices, nearing the lows for the year. Meanwhile, the majority of market participants seem to believe that the Federal Reserve is concluding its rate hikes this year and next, with a high probability of interest rate cuts in the first half of 2024, signaling bullish sentiment in the market.
AI’s Influence on the Stock Market: In a remarkable turn of events, the CEO of OpenAI was ousted and subsequently reinstated, underscoring the pivotal role of artificial intelligence in the future of the stock market and society at large. This unusual situation highlights the importance of AI in the age of social media, where every action and word can quickly influence public opinion and organize movements, as seen in examples like Elon Musk, Russia-Ukraine, and Israel-Hamas conflicts.
Market Outlook and Catalysts: As the DXY and longer-dated treasuries dip below the 50 DMA, the current market rally is expected to persist as long as the dollar remains weak and yields decline toward the end of the year. The majority of market participants foresee lower yields in the first half of 2024, but a deviation from this could extend the duration of higher inflation and delay interest rate cuts until the latter part of 2025.
While potential patterns of higher highs and higher lows are acknowledged in the near term, I am sticking to a market-neutral stance. The belief lingers that the SPY rally might cap at $450-470, with cautious eyes on short support in the $400-430 range for the coming months. Despite expectations of incremental market movements, there’s a consensus that the pinnacle of this rally may already be behind us, urging investors to navigate with a balanced approach in this evolving financial landscape. See the SPY Seasonal Chart below for reference:
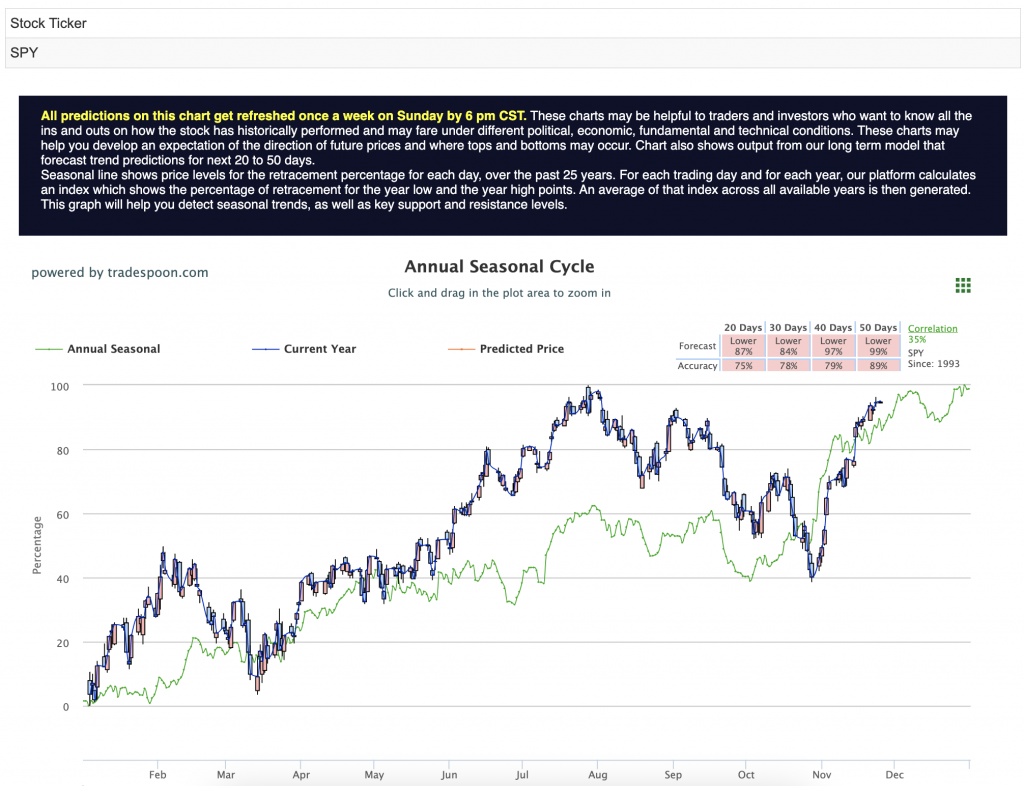
Energy Pullback and the Need for Catalysts: Energy has experienced a significant pullback, testing the 200 DMA due to weak global demand and a reduction in geopolitical risks. For the market to witness further upward movement, a catalyst is required. Beyond Nvidia, macroeconomic data, including CPI, PPI, unemployment figures, and Powell’s statements in the first two weeks of December, will play a crucial role. Short-term pullbacks are expected, but the pattern of higher highs and higher lows is likely to continue into the next year, provided signs of a recession remain absent.
Underperforming Sectors: Notably, small caps and banks are underperforming, indicating that the current rally may have limitations until these sectors show signs of improvement. While the market outlook remains optimistic, caution is advised, with the possibility that the most robust phase of the rally has already occurred.
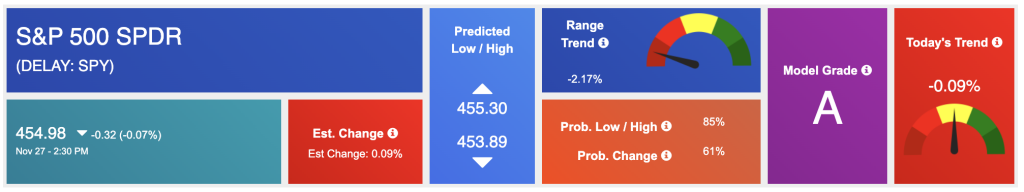
Using the “SPY” symbol to analyze the S&P 500 our 10-day prediction window shows a near-term positive outlook. Prediction data is uploaded after the market closes at 6 p.m. CST. Today’s data is based on market signals from the previous trading session.
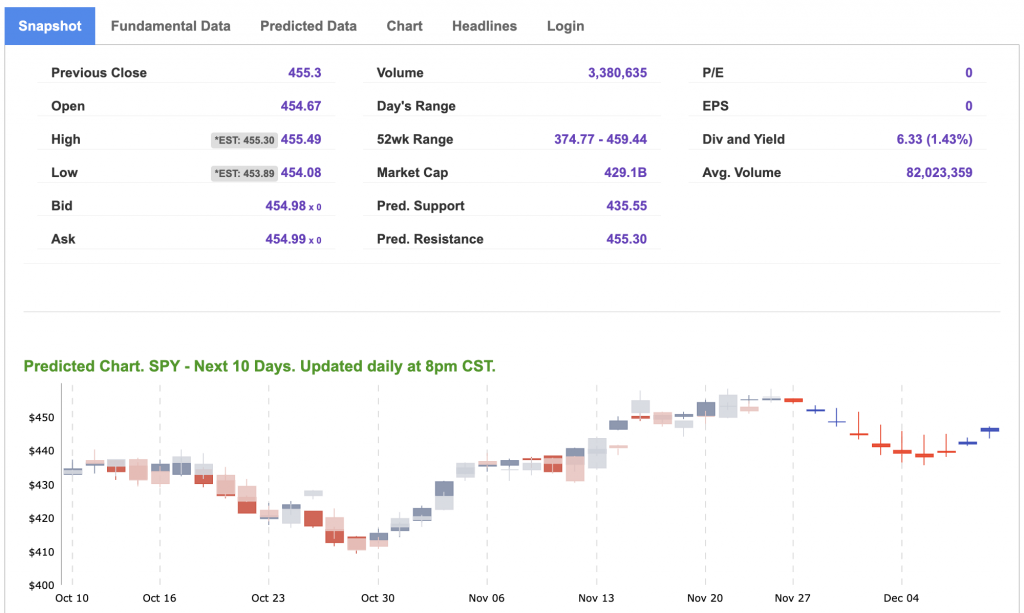
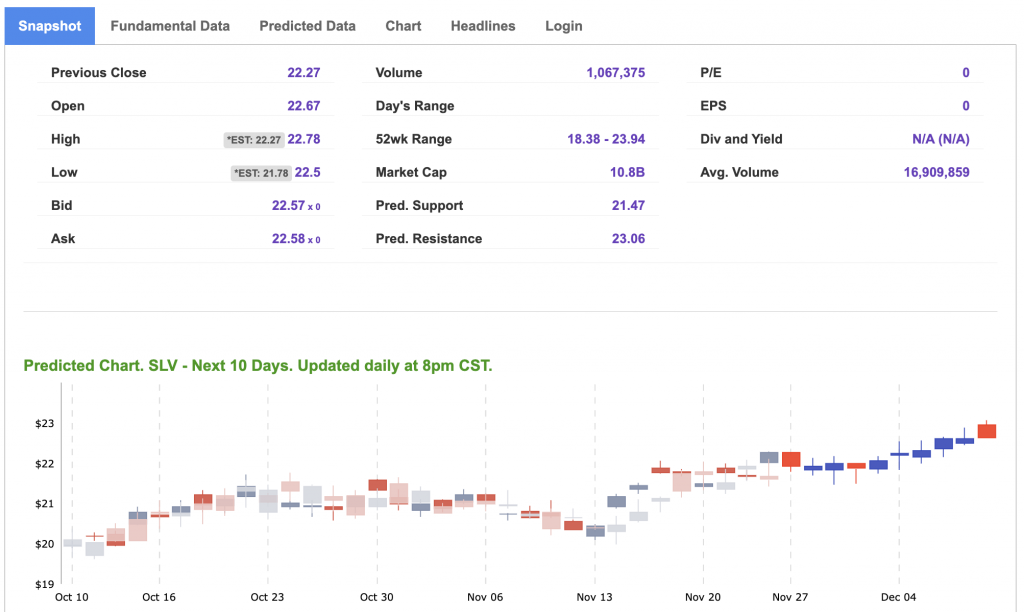
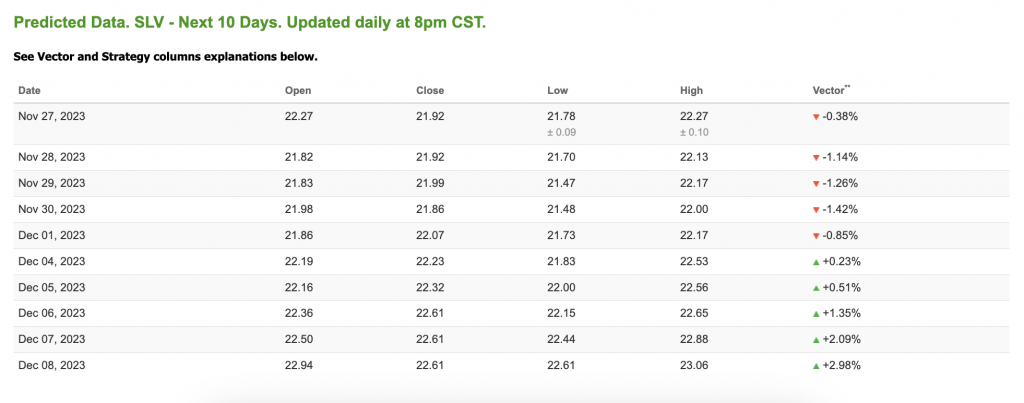
Note: The Vector column calculates the change of the Forecasted Average Price for the next trading session relative to the average of actual prices for the last trading session. The column shows the expected average price movement “Up or Down”, in percent. Trend traders should trade along the predicted direction of the Vector. The higher the value of the Vector the higher its momentum.
*Please note: At the time of publication Vlad Karpel does NOT have a position in the featured symbol, MSFT. Our featured symbol is part of your free subscription service. It is not included in any paid Tradespoon subscription service. Vlad Karpel only trades his money in paid subscription services. If you are a paid subscriber, please review your Premium Member Picks, ActiveTrader, or MonthlyTrader recommendations. If you are interested in receiving Vlad’s picks, please click here.
West Texas Intermediate for Crude Oil delivery (CL.1) is priced at $77.50 per barrel, up 2.12%, at the time of publication.
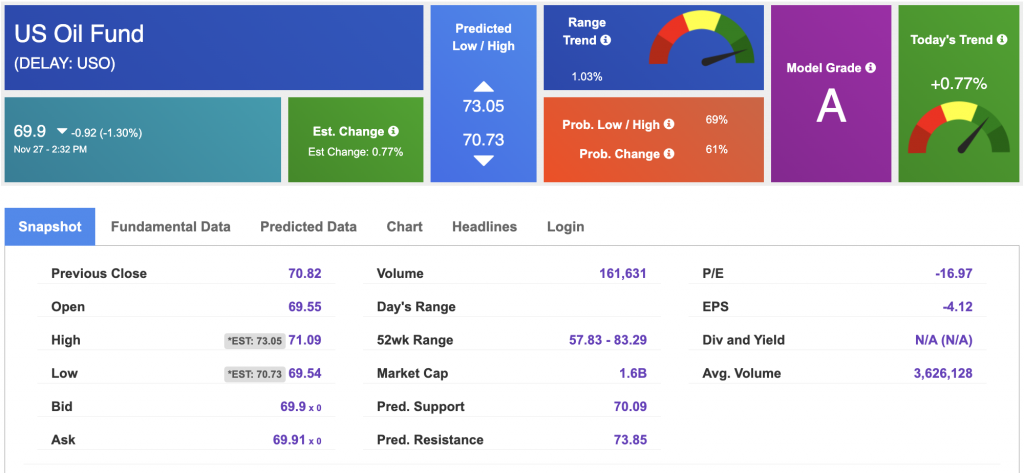
Looking at USO, a crude oil tracker, our 10-day prediction model shows mixed signals. The fund is trading at $69.9 at the time of publication. Prediction data is uploaded after the market close at 6 p.m., CST. Today’s data is based on market signals from the previous trading session.
The price for the Gold Continuous Contract (GC00) is down 0.23% at $1980.20 at the time of publication.
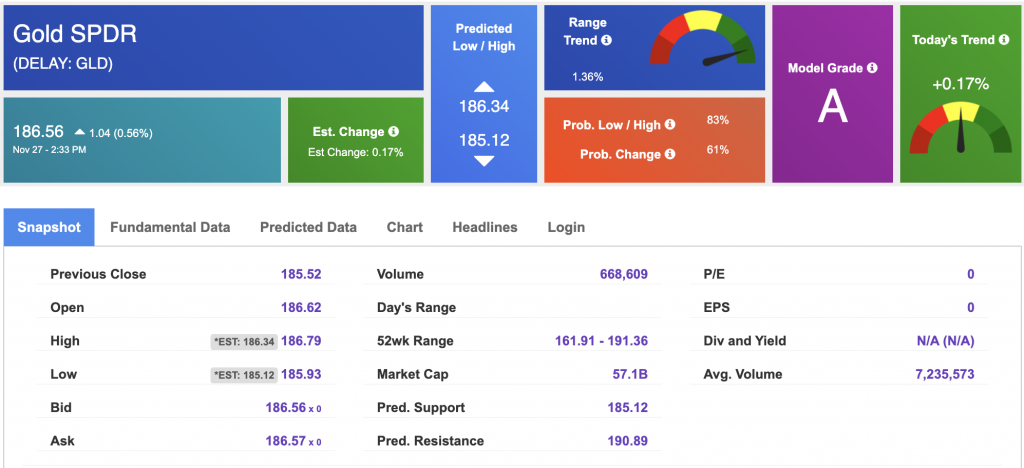
Using SPDR GOLD TRUST (GLD) as a tracker in our Stock Forecast Tool, the 10-day prediction window shows mixed signals. The gold proxy is trading at $186.56 at the time of publication. Vector signals show +0.17% for today. Prediction data is uploaded after the market close at 6 p.m., CST. Today’s data is based on market signals from the previous trading session.
The yield on the 10-year Treasury note is down at 4.392% at the time of publication.
The yield on the 30-year Treasury note is down at 4.533% at the time of publication.
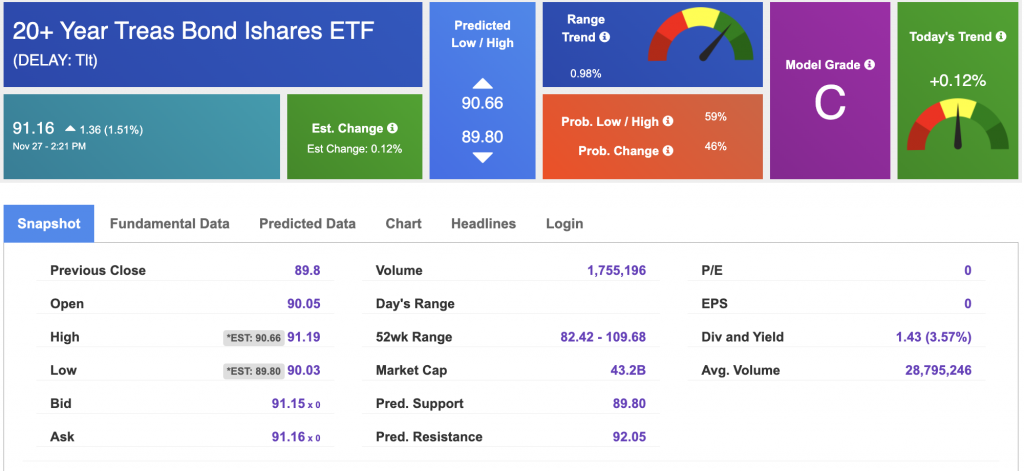
Using the iShares 20+ Year Treasury Bond ETF (TLT) as a proxy for bond prices in our Stock Forecast Tool, we see mixed signals in our 10-day prediction window. Prediction data is uploaded after the market close at 6 p.m., CST. Today’s data is based on market signals from the previous trading session.
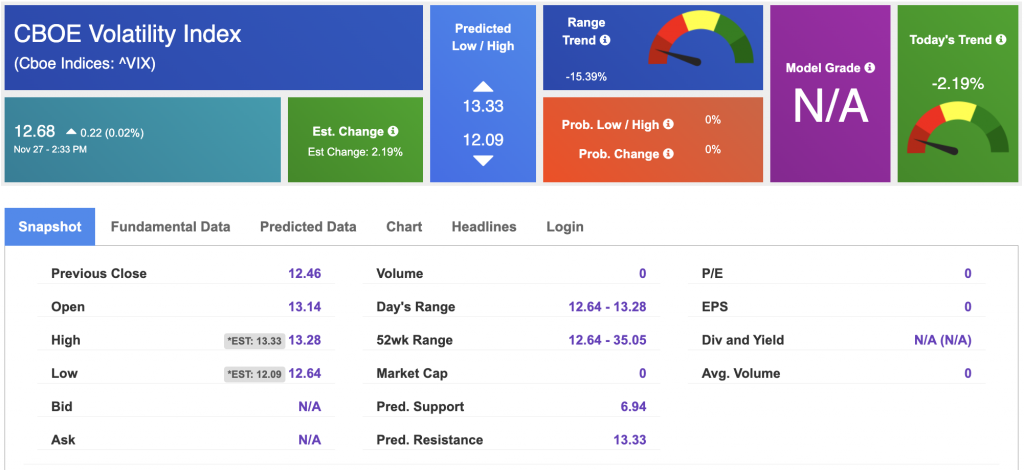
The CBOE Volatility Index (^VIX) is priced at $12.68 up 0.02% at the time of publication, and our 10-day prediction window shows mixed signals. Prediction data is uploaded after the market close at 6 p.m., CST. Today’s data is based on market signals from the previous trading session.
Please share this Tradespoon Market Commentary with your friends.
![]()

![]()
Comments Off on


Tradespoon Tools make finding winning trades in minute as easy as 1-2-3.
Our simple 3 step approach has resulted in an average return of almost 20% per trade!