 Are you a Long-Term Trader? Then take a look at our NEW RoboInvestor Service?
CLICK HERE TO LEARN MORE
Are you a Long-Term Trader? Then take a look at our NEW RoboInvestor Service?
CLICK HERE TO LEARN MORE
Following the release of the latest Federal Open Market Committee meeting minutes, all three major U.S. indices closed in the red. U.S. stocks recovered slightly by the end of the day but still finished lower as minutes from the Federal Reserve’s July meeting showed policymakers are open to continuing interest rate hikes but will be conscious about not going overboard with hikes. In July, policymakers also said that if the public began to doubt the Fed’s resolve to raise rates enough to control inflation, then there would be a significant risk of high inflation becoming entrenched. Retail data was also released today showing U.S. retail sales remained steady last month, while the drop in gas prices and new vehicle purchases significantly impacted these numbers. Estimates were in the range of 0.1% growth, but primarily saw a drop in auto as retail sales minus auto showed a 0.4% increase, and up 0.7% if gas was also excluded. Elsewhere, Walmart and Home Depot reports helped shares rise while Target saw shares drop after missing estimates. Lowe’s released their earnings today and saw shares marginally increase.
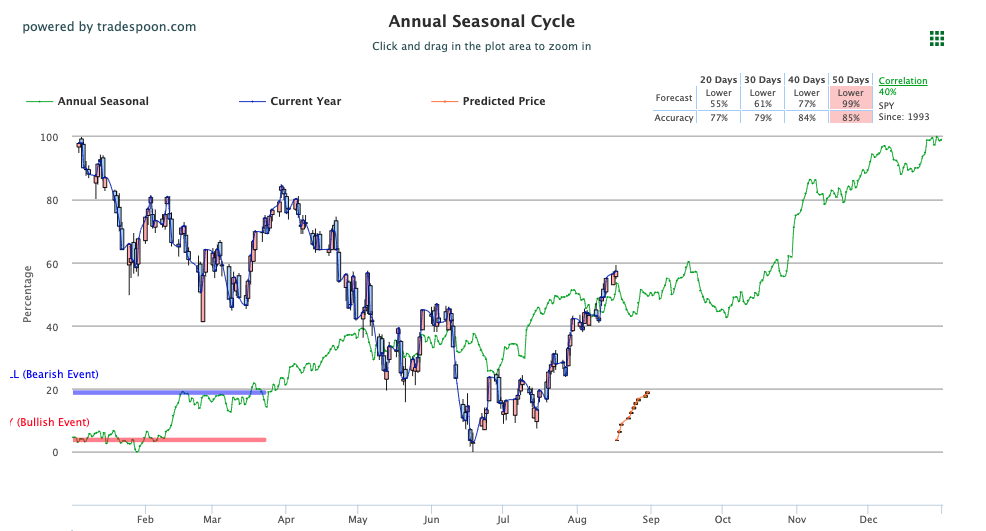
The $VIX is currently trading near the $20 level while the dollar moved marginally higher today. The $CSCO, $HD, and $ADI earnings and July retail numbers can influence the next move in the market. We are watching the overhead resistance levels in the SPY, which are presently at $430 and then $440. The $SPY support is at $420 and then $406. We expect the market to continue the short-term rally for the next couple of weeks and encourage subscribers not to chase the market at these levels. Globally, Asian markets traded higher while European markets closed in the red. We encourage all market commentary readers to maintain clearly defined stop levels for all positions. For reference, the SPY Seasonal Chart is shown below:
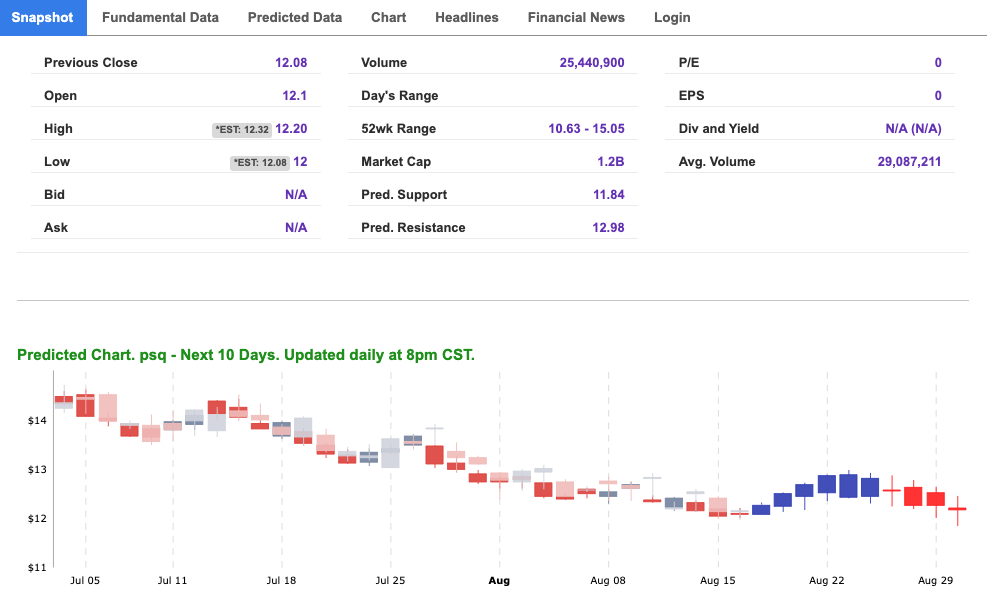
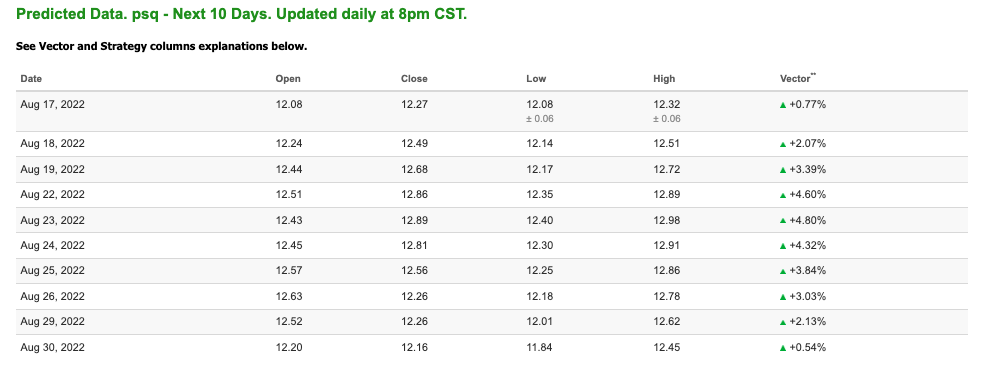
Note: The Vector column calculates the change of the Forecasted Average Price for the next trading session relative to the average of actual prices for the last trading session. The column shows the expected average price movement “Up or Down”, in percent. Trend traders should trade along the predicted direction of the Vector. The higher the value of the Vector the higher its momentum.
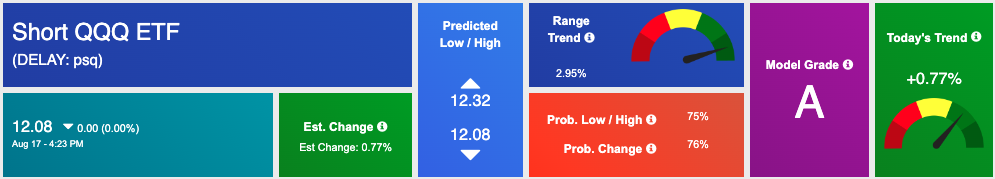
*Please note: At the time of publication Vlad Karpel does have a position in the featured symbol, PSQ. Our featured symbol is part of your free subscription service. It is not included in any paid Tradespoon subscription service. Vlad Karpel only trades his money in paid subscription services. If you are a paid subscriber, please review your Premium Member Picks, ActiveTrader, or MonthlyTrader recommendations. If you are interested in receiving Vlad’s picks, please click here.
West Texas Intermediate for Crude Oil delivery (CL.1) is priced at $87.29 per barrel, up 0.88%, at the time of publication.
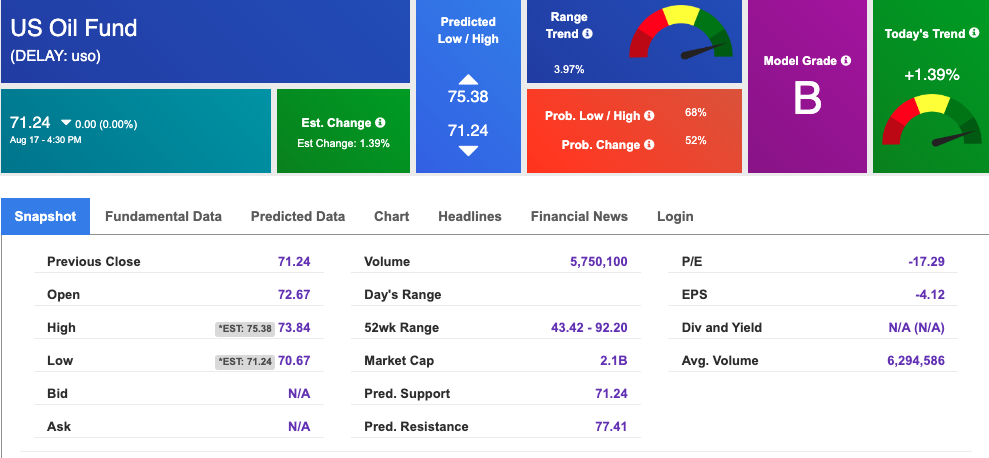
Looking at USO, a crude oil tracker, our 10-day prediction model shows mixed signals. The fund is trading at $71.24 at the time of publication. Prediction data is uploaded after the market close at 6 p.m., CST. Today’s data is based on market signals from the previous trading session.
The price for the Gold Continuous Contract (GC00) is down 0.75% at $1776.30 at the time of publication.
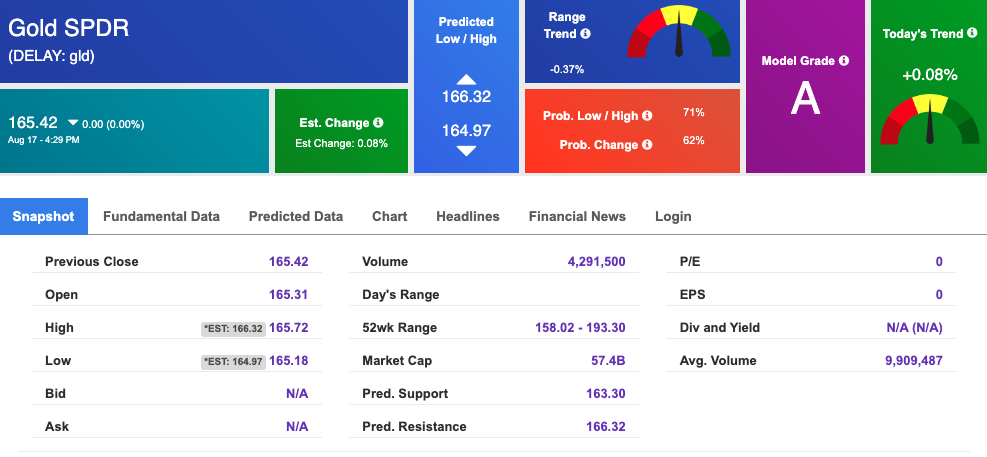
Using SPDR GOLD TRUST (GLD) as a tracker in our Stock Forecast Tool, the 10-day prediction window shows mixed signals. The gold proxy is trading at $165.42 at the time of publication. Vector signals show +0.08% for today. Prediction data is uploaded after the market close at 6 p.m., CST. Today’s data is based on market signals from the previous trading session.
The yield on the 10-year Treasury note is up, at 2.900% at the time of publication.
The yield on the 30-year Treasury note is up, at 3.154% at the time of publication.
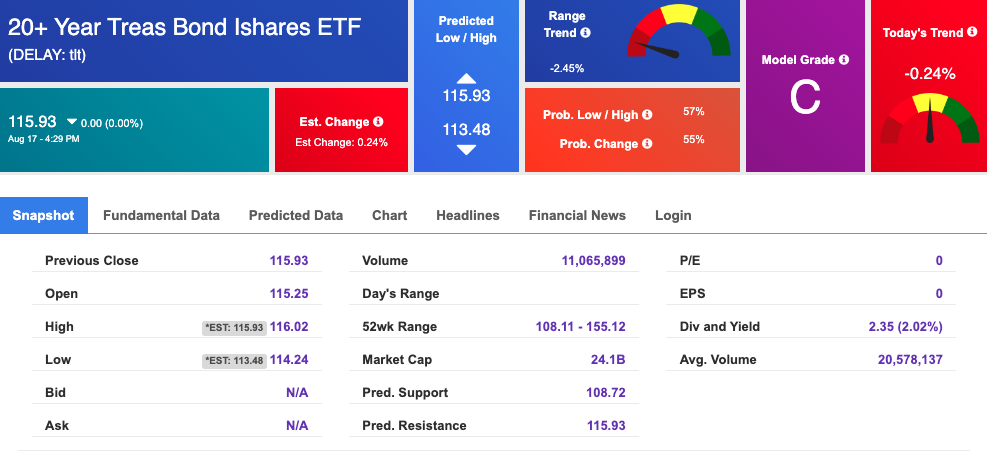
Using the iShares 20+ Year Treasury Bond ETF (TLT) as a proxy for bond prices in our Stock Forecast Tool, we see mixed signals in our 10-day prediction window. Prediction data is uploaded after the market close at 6 p.m., CST. Today’s data is based on market signals from the previous trading session.
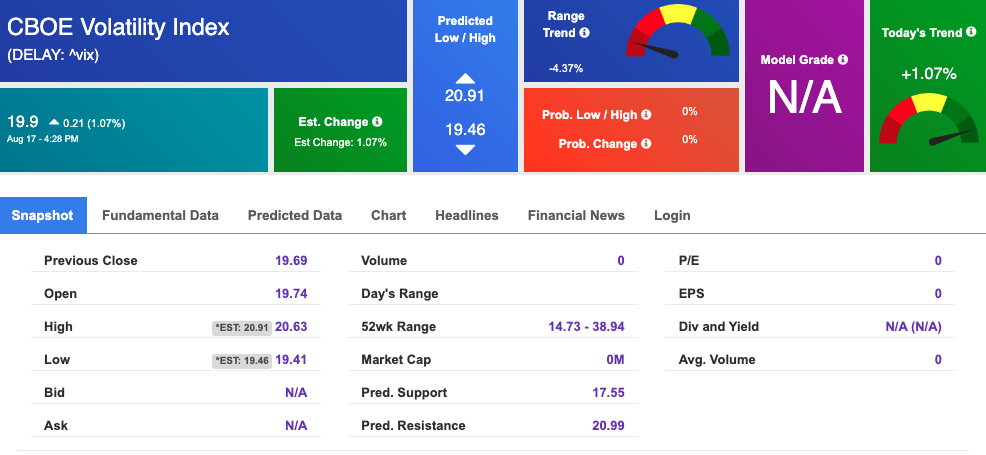
The CBOE Volatility Index (^VIX) is $19.9 at the time of publication, and our 10-day prediction window shows mixed signals. Prediction data is uploaded after the market close at 6 p.m., CST. Today’s data is based on market signals from the previous trading session.
Please share this Tradespoon Market Commentary with your friends.
![]()

![]()
Comments Off on


Tradespoon Tools make finding winning trades in minute as easy as 1-2-3.
Our simple 3 step approach has resulted in an average return of almost 20% per trade!

