 Are you a Long-Term Trader? Then take a look at our NEW RoboInvestor Service?
CLICK HERE TO LEARN MORE
Are you a Long-Term Trader? Then take a look at our NEW RoboInvestor Service?
CLICK HERE TO LEARN MORE
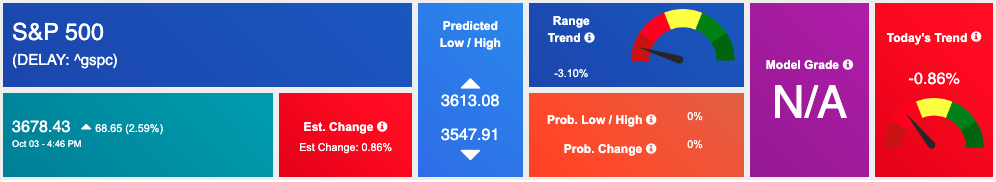
Following today’s release of the Federal Open Market Committee meeting minutes, all three major U.S. indices closed in the red. Although the Nasdaq was able to muster a 0.1% gain on Tuesday, most U.S. shares sold off today ahead of key inflation reports due this week. Also this week, Q3 earnings season begins with major banks. We are keeping an eye on the $VIX which spiked today and is trading near the $35 level. The $JPM,$STM and $DAL earnings, and CPI/PPI data this week can influence the next move in the market. We are watching the overhead resistance levels in the SPY, which are presently at $376 and then $390. The $SPY support is at $355 and then $340.The market will likely continue to bottom for the next 2-8 weeks. The short-term market is oversold and may stage a few days of recovery. We’d be a buyer into any additional sell-offs and encourage our subscribers not to follow the market down.
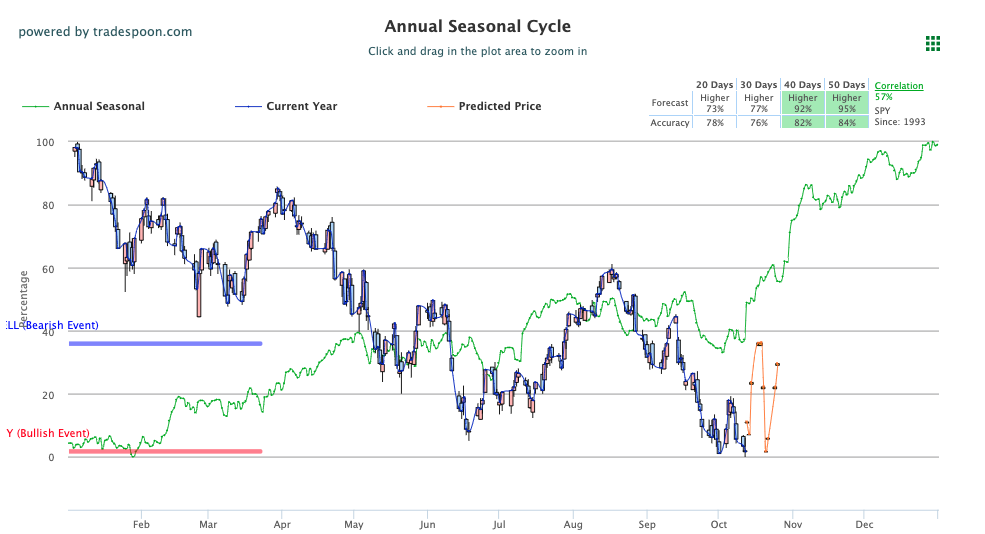
The Fed’s minutes from the last meeting show that officials are still worried about inflation at its current high level, likely leading to more policy updates meant to reduce inflation as previous attempts have not fared well. In the minutes, Fed officials described inflation as “unacceptably high,” and that their approach of combating price increases aggressively rather than doing too little was more beneficial to the economy. Investors are eagerly awaiting Thursday’s release of the September consumer prices data from the United States. The September CPI reading is expected to show an 8.1% rise from the previous year, decreasing from August’s 8.3%. The core CPI, which removes food and energy from the calculation, is expected to rise 6.5% year over year, up from 6.3%. Globally, Asian markets traded with mixed results while European markets sold off. We encourage all market commentary readers to maintain clearly defined stop levels for all positions. For reference, the SPY Seasonal Chart is shown below:
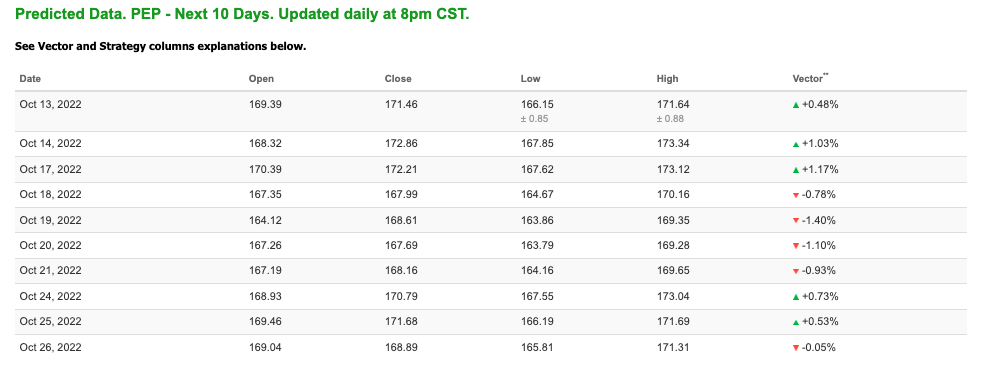
Note: The Vector column calculates the change of the Forecasted Average Price for the next trading session relative to the average of actual prices for the last trading session. The column shows the expected average price movement “Up or Down”, in percent. Trend traders should trade along the predicted direction of the Vector. The higher the value of the Vector the higher its momentum.
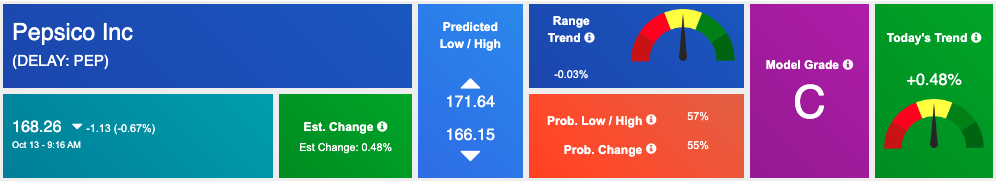
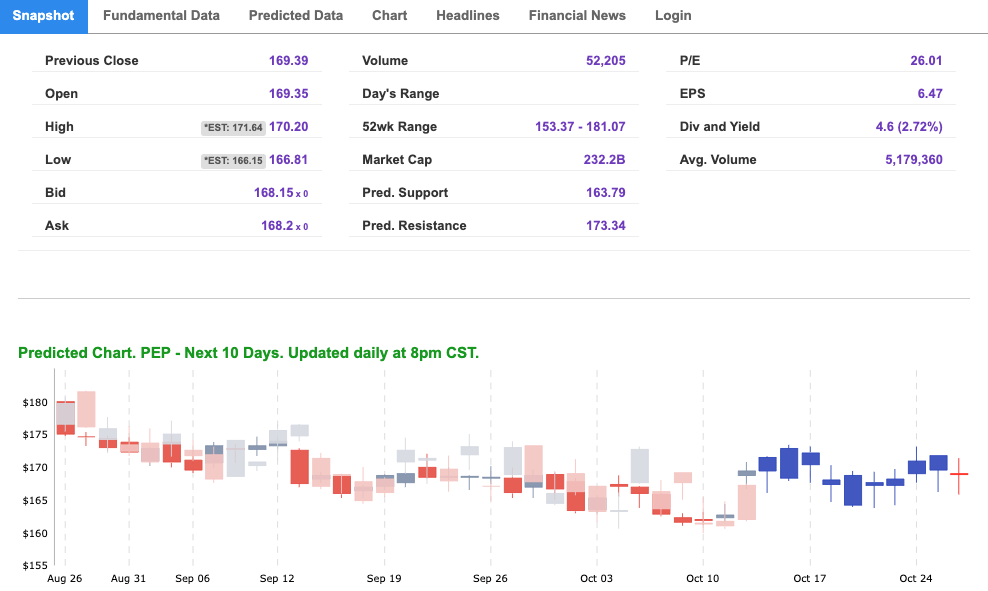
*Please note: At the time of publication Vlad Karpel does have a position in the featured symbol, pep. Our featured symbol is part of your free subscription service. It is not included in any paid Tradespoon subscription service. Vlad Karpel only trades his money in paid subscription services. If you are a paid subscriber, please review your Premium Member Picks, ActiveTrader, or MonthlyTrader recommendations. If you are interested in receiving Vlad’s picks, please click here.
West Texas Intermediate for Crude Oil delivery (CL.1) is priced at $86.64 per barrel, down 0.73%, at the time of publication.
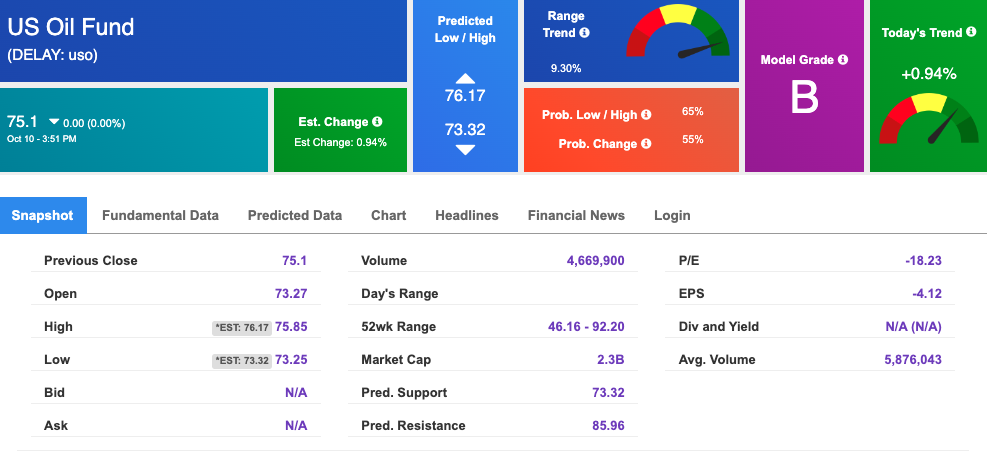
Looking at USO, a crude oil tracker, our 10-day prediction model shows mixed signals. The fund is trading at $75.1 at the time of publication. Prediction data is uploaded after the market close at 6 p.m., CST. Today’s data is based on market signals from the previous trading session.
The price for the Gold Continuous Contract (GC00) is down 1.39% at $1653.70 at the time of publication.
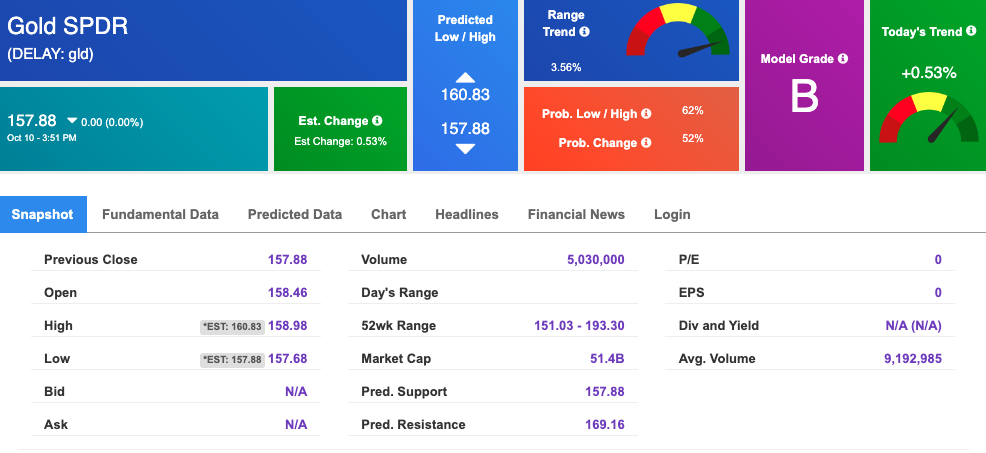
Using SPDR GOLD TRUST (GLD) as a tracker in our Stock Forecast Tool, the 10-day prediction window shows mixed signals. The gold proxy is trading at $157.88 at the time of publication. Vector signals show 0.53% for today. Prediction data is uploaded after the market close at 6 p.m., CST. Today’s data is based on market signals from the previous trading session.
The yield on the 10-year Treasury note is flat at 3.990% at the time of publication.
The yield on the 30-year Treasury note is flat at 3.939% at the time of publication.
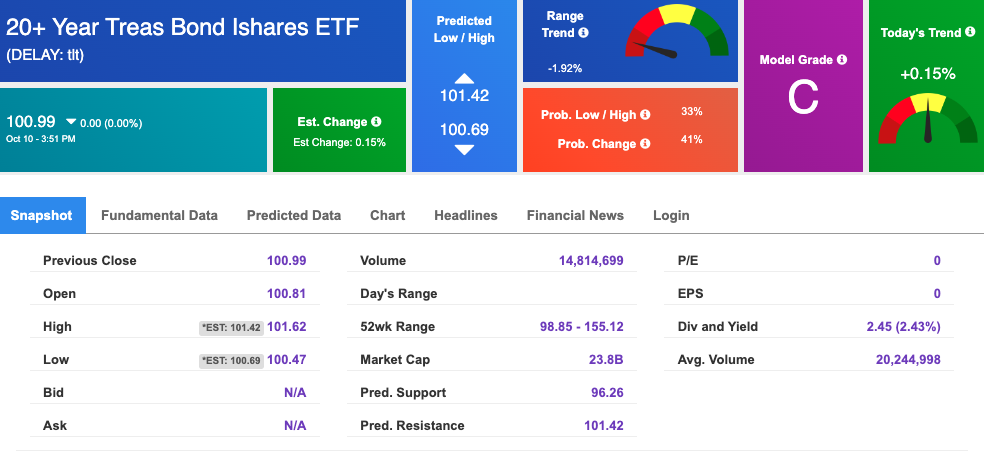
Using the iShares 20+ Year Treasury Bond ETF (TLT) as a proxy for bond prices in our Stock Forecast Tool, we see mixed signals in our 10-day prediction window. Prediction data is uploaded after the market close at 6 p.m., CST. Today’s data is based on market signals from the previous trading session.
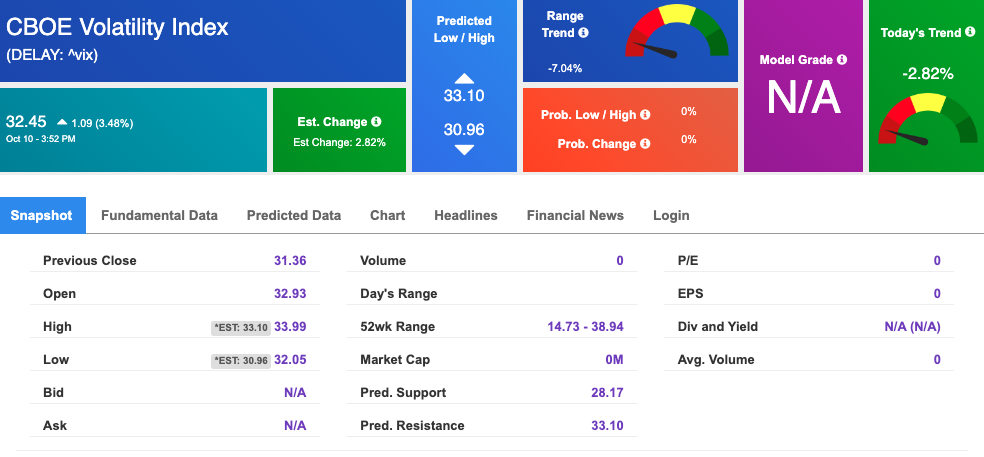
The CBOE Volatility Index (^VIX) is $32.45 at the time of publication, and our 10-day prediction window shows mixed signals. Prediction data is uploaded after the market close at 6 p.m., CST. Today’s data is based on market signals from the previous trading session.
Please share this Tradespoon Market Commentary with your friends.
![]()

![]()
Comments Off on


Tradespoon Tools make finding winning trades in minute as easy as 1-2-3.
Our simple 3 step approach has resulted in an average return of almost 20% per trade!

