 Special Offer: Try the 'Elite Trading Circle Membership' for ONLY $37!
CLICK HERE TO LEARN MORE
Special Offer: Try the 'Elite Trading Circle Membership' for ONLY $37!
CLICK HERE TO LEARN MORE
Markets traded to mixed results as the S&P 500 and Dow extend their losing streaks following market-wide sentiment of three additional Fed rate rises anticipated in 2022. The Nasdaq Composite Index rose slightly in the final minutes of trading on Monday, recovering after taking a beating earlier in the day, as investors reacted to concern about Federal Reserve policy. Last Friday’s jobs report was worse than predicted with 199,000 new employment in December; bringing the unemployment rate to a pandemic low while also reporting an increase in salaries. Last week’s Federal Reserve minutes are still carrying an impact into this week as the minutes also appear to indicate policy makers were looking to tighten fiscal policy as an effort to combat inflation. While the dollar and gold, traditionally trading inversely, both rose slightly, Bitcoin was down for the day.
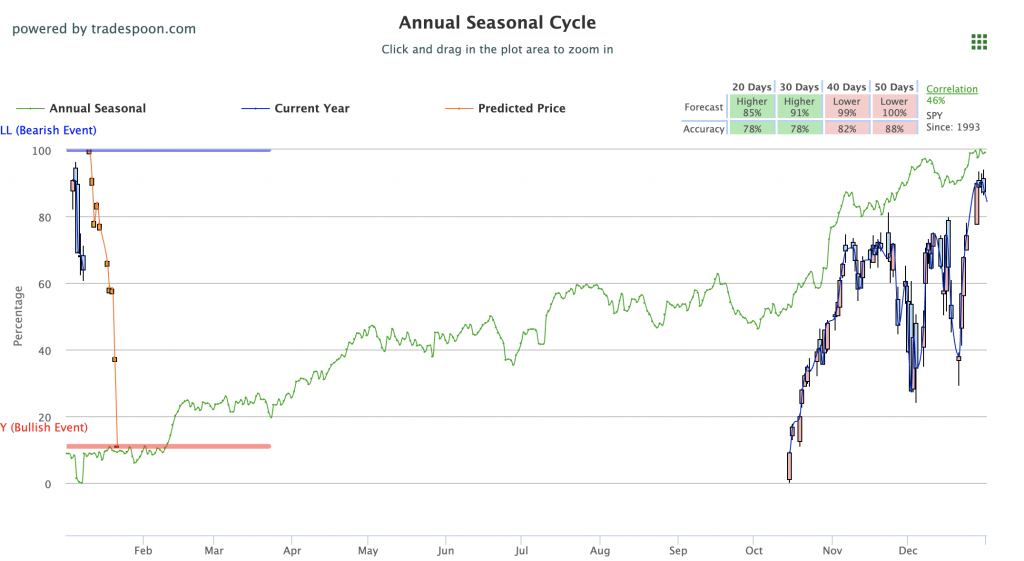
The $VIX just spiked to 24 level and the $QQQ continues to approach 200 DMA. $QQQ is trading below the 50-day moving average on the precipitous drop in $TLT. Omicron virus, the fear of inflation, Fed hawking statement, CPI December numbers this week can impact the next move in the market. We are watching the vital support levels in the SPY, which are presently at $450 and then $440, and we expect the market to continue trading sideways into the first quarter of 2022. Globally, European markets closed unanimously in the red while Asian markets finished with mixed results. We encourage all market commentary readers to maintain clearly defined stop levels for all positions. For reference, the SPY Seasonal Chart is shown below:
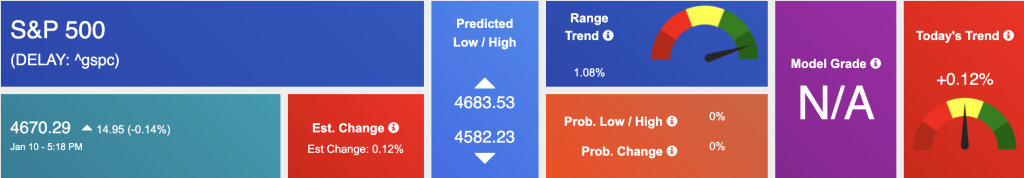
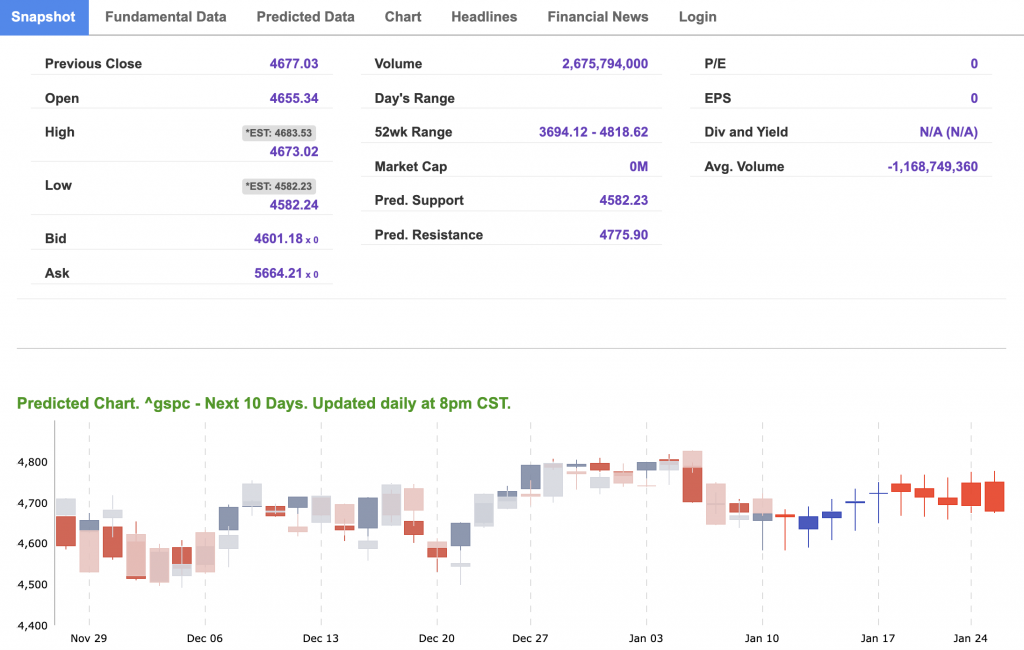
Using the “^GSPC” symbol to analyze the S&P 500 our 10-day prediction window shows a near-term mixed outlook. Prediction data is uploaded after the market closes at 6 p.m. CST. Today’s data is based on market signals from the previous trading session.
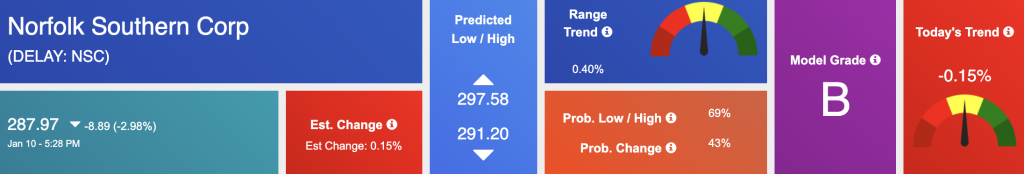
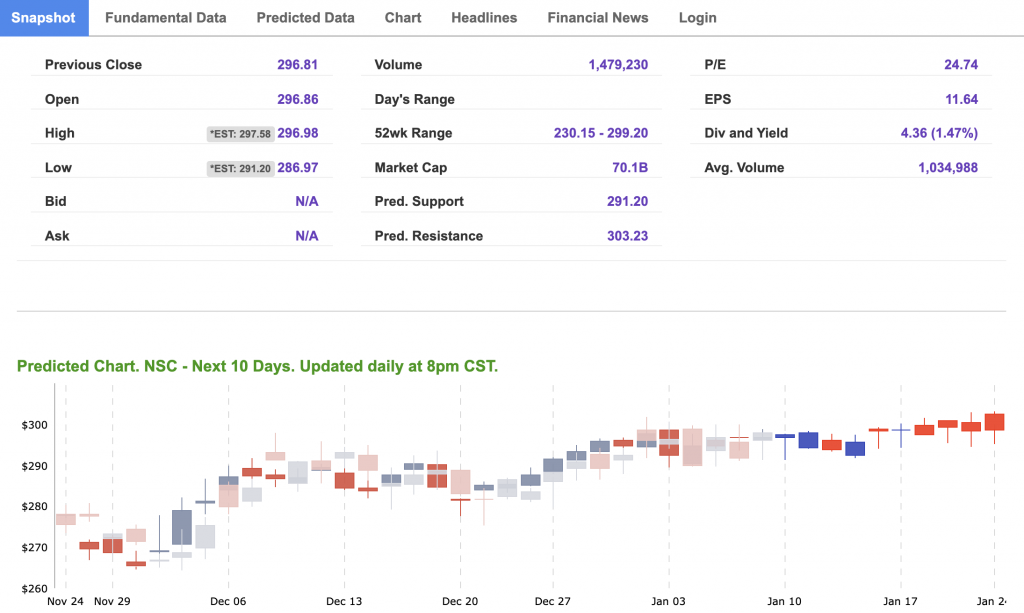
The symbol is trading at $287.97 with a vector of -0.15% at the time of publication.
10-Day Prediction data is uploaded after the market close at 6 p.m., CST. Today’s data is based on market signals from the previous trading session.
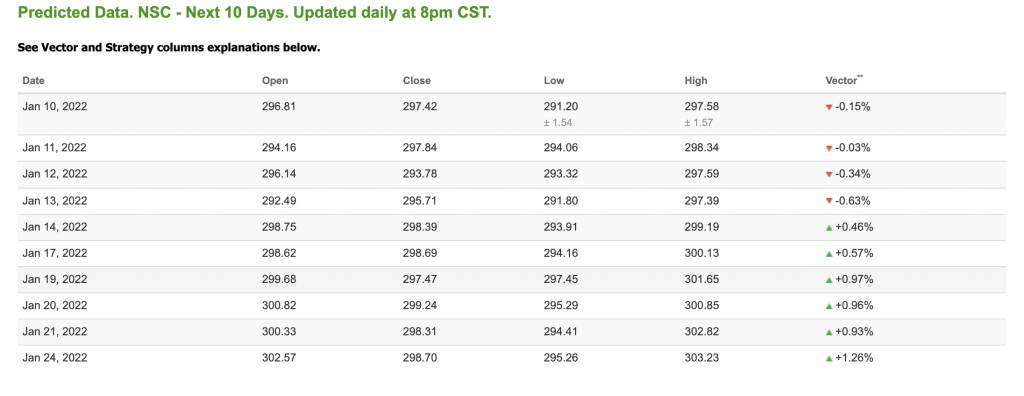
Note: The Vector column calculates the change of the Forecasted Average Price for the next trading session relative to the average of actual prices for the last trading session. The column shows the expected average price movement “Up or Down”, in percent. Trend traders should trade along the predicted direction of the Vector. The higher the value of the Vector the higher its momentum.
*Please note: At the time of publication Vlad Karpel does not have a position in the featured symbol, nsc. Our featured symbol is part of your free subscription service. It is not included in any paid Tradespoon subscription service. Vlad Karpel only trades his money in paid subscription services. If you are a paid subscriber, please review your Premium Member Picks, ActiveTrader, or MonthlyTrader recommendations. If you are interested in receiving Vlad’s picks, please click here.
West Texas Intermediate for Crude Oil delivery (CL.1) is priced at $78.54 per barrel, up 0.40% at the time of publication.
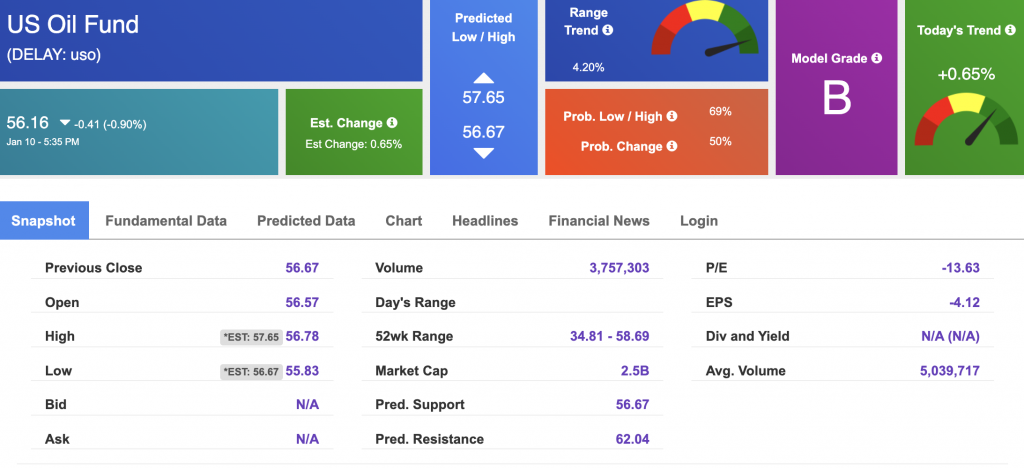
Looking at USO, a crude oil tracker, our 10-day prediction model shows mixed signals. The fund is trading at $56.15 at the time of publication. Prediction data is uploaded after the market close at 6 p.m., CST. Today’s data is based on market signals from the previous trading session.
The price for the Gold Continuous Contract (GC00) is up 0.12% at $1801.20 at the time of publication.
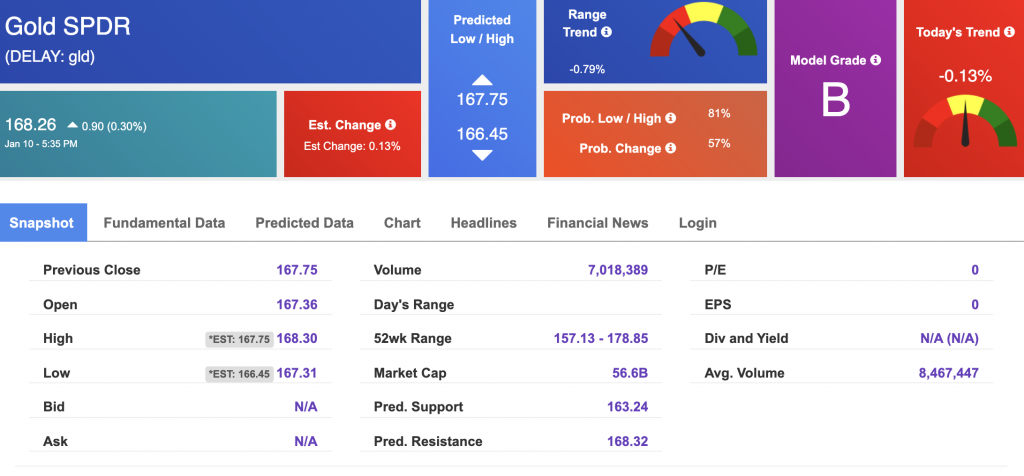
Using SPDR GOLD TRUST (GLD) as a tracker in our Stock Forecast Tool, the 10-day prediction window shows mixed signals. The gold proxy is trading at $168.26 at the time of publication. Vector signals show -0.13% for today. Prediction data is uploaded after the market close at 6 p.m., CST. Today’s data is based on market signals from the previous trading session.
The yield on the 10-year Treasury note is up, at 1.706% at the time of publication.
The yield on the 30-year Treasury note is up, at 2.102% at the time of publication.
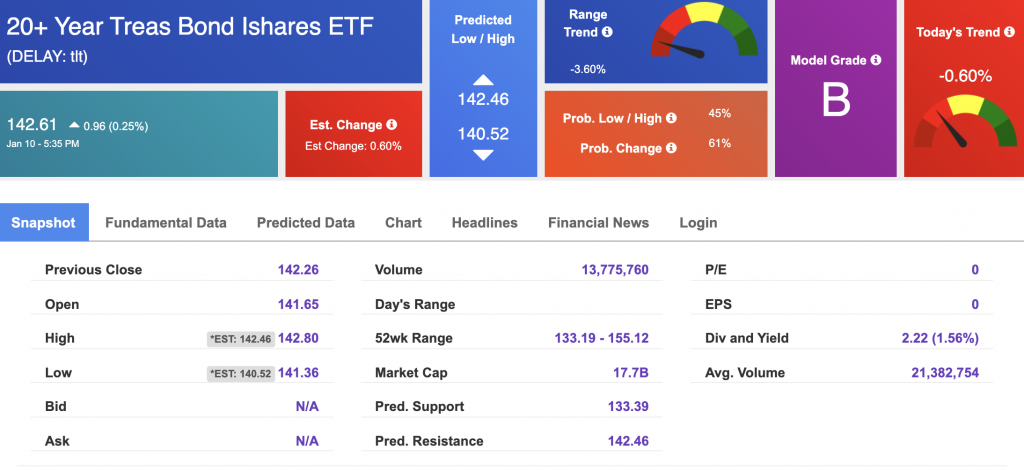
Using the iShares 20+ Year Treasury Bond ETF (TLT) as a proxy for bond prices in our Stock Forecast Tool, we see mixed signals in our 10-day prediction window. Prediction data is uploaded after the market close at 6 p.m., CST. Today’s data is based on market signals from the previous trading session.
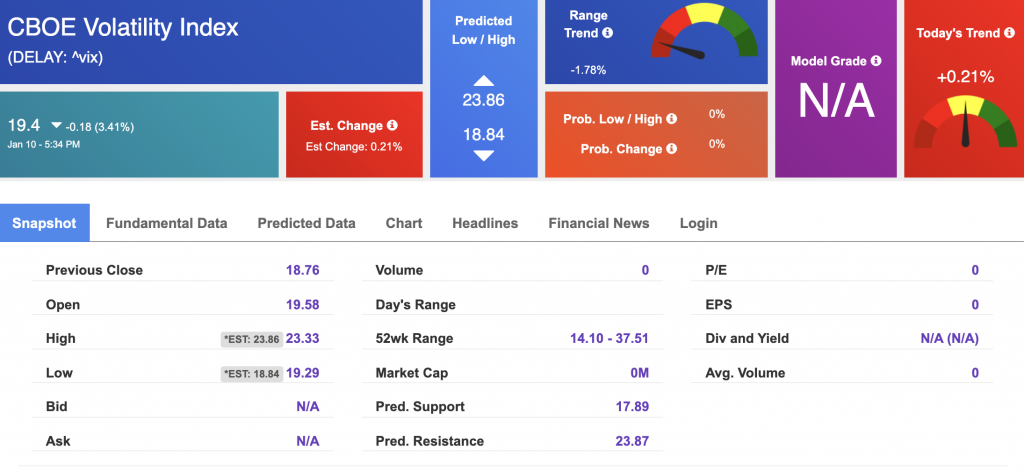
The CBOE Volatility Index (^VIX) is $19.4 at the time of publication, and our 10-day prediction window shows mixed signals. Prediction data is uploaded after the market close at 6 p.m., CST. Today’s data is based on market signals from the previous trading session.
Please share this Tradespoon Market Commentary with your friends.
![]()

![]()
Comments Off on


Tradespoon Tools make finding winning trades in minute as easy as 1-2-3.
Our simple 3 step approach has resulted in an average return of almost 20% per trade!

