 Save Big on Commissions ($0.65 per Contract)
CLICK HERE TO LEARN MORE
Save Big on Commissions ($0.65 per Contract)
CLICK HERE TO LEARN MORE
Stocks closed higher on Monday, bouncing back after a week of losses. The market was buoyed by hotter-than-expected inflation data that suggested the Federal Reserve might need to take further action. All three major indexes had fallen by more than 1% on Friday, with the Dow posting its fourth consecutive weekly loss; meanwhile, the S&P 500 marked its third consecutive weekly loss.
Investors closely watched reports on durable goods and pending home sales on Monday, which showed that new orders for durable goods had slipped by 4.5% in January, reversing the 5.1% uptick expected by economists in December. Meanwhile, pending home sales rose 8.1%, far exceeding expectations of a 0.95% uptick. We are also keeping a close eye on the February jobs report, which has been delayed until March 10, as well as the latest ISM manufacturing data due on Wednesday and services data due on Friday.
Last week’s hotter-than-expected inflation data has pointed to more work for the Federal Reserve in terms of interest-rate hikes. Traders are now pricing in a 25% chance of a 50-basis point hike at the Fed’s March meeting. The Fed’s current median expectations are for the federal funds rate to be 5% to 5.25% by the end of 2023, and 4% to 4.25%, by the end of 2024. The US dollar, which rallied on Friday as rate expectations rose, took a breather on Monday as investors paused. The US Dollar Index, which tracks the greenback against a basket of global currencies, rose slightly after five consecutive days of gains.
Earnings season is wrapping up, with Zoom Video Communications, Occidental Petroleum, and Workday all reporting on Monday, and AutoZone, Monster Beverage, Norwegian Cruise Line Holdings, and Target set to follow on Tuesday. Retail earnings continue on Wednesday with Dollar Tree and Lowe’s, while Broadcom and Costco post on Thursday.
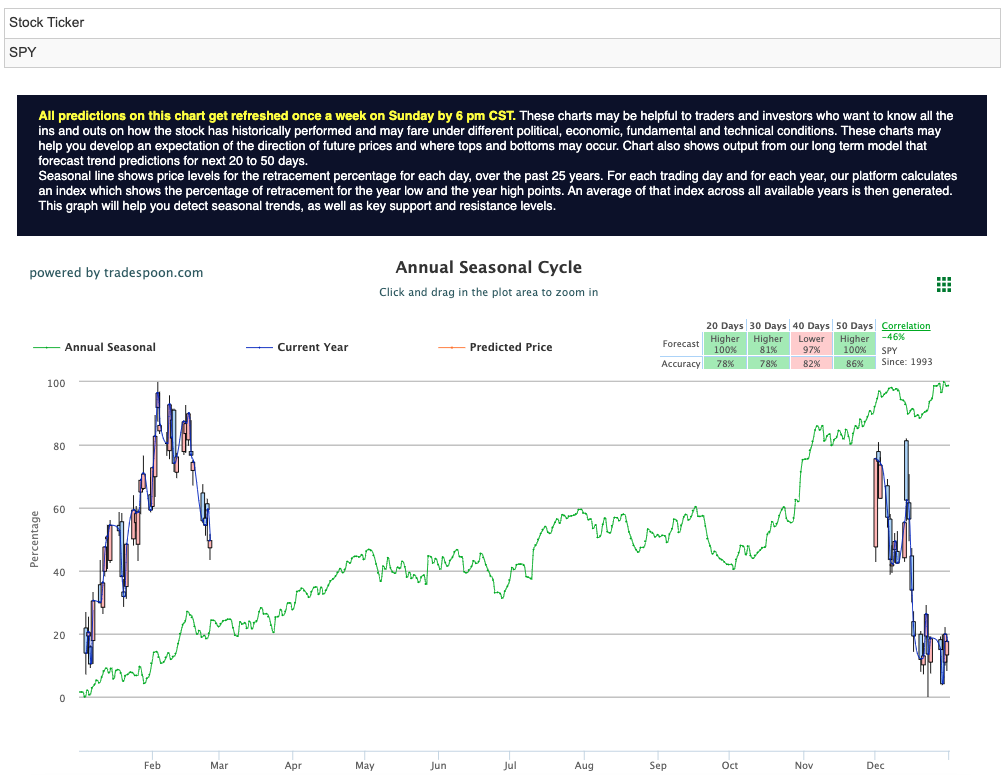
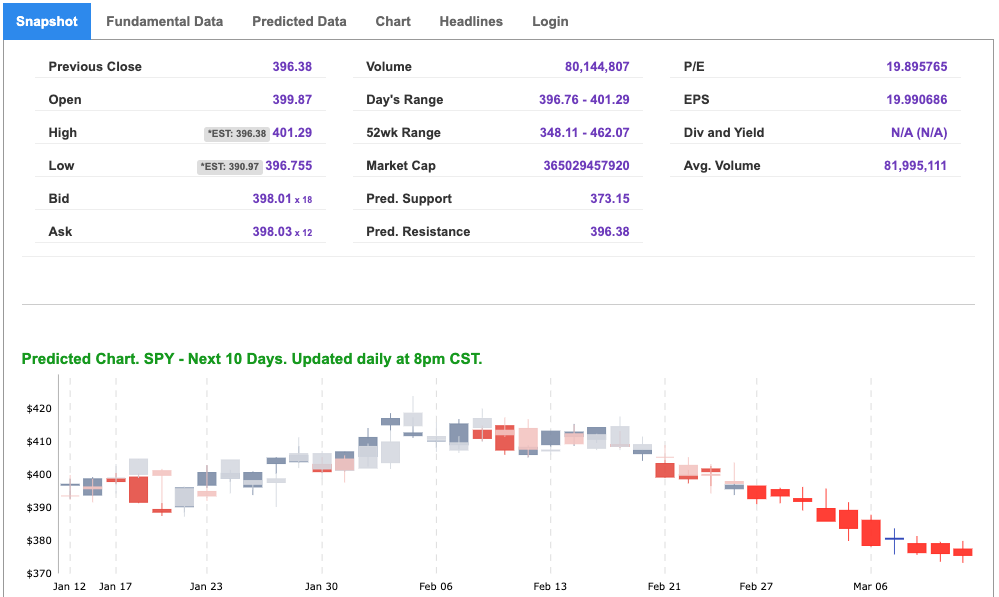
The $VIX is trading near the $21 level, and the earnings reports from TGT, ZM, and OXY this week, as well as the ISM data, could influence the next move in the market. Market watchers are keeping an eye on the overhead resistance levels in the SPY, which are currently at $403 and then $408. The $SPY support is at $395 and then $390. The market is expected to trade sideways for the next 2-8 weeks, and readers are encouraged to hedge their positions. At this time, we would recommend being market neutral on the market. Asian markets finished in the red, while European markets booked gains. Market commentary readers should maintain clearly defined stop levels for all positions. For reference, the SPY Seasonal Chart is shown below:
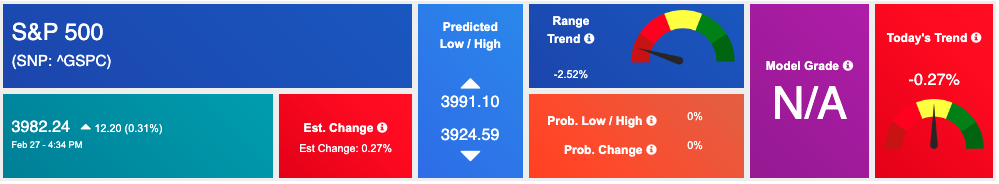
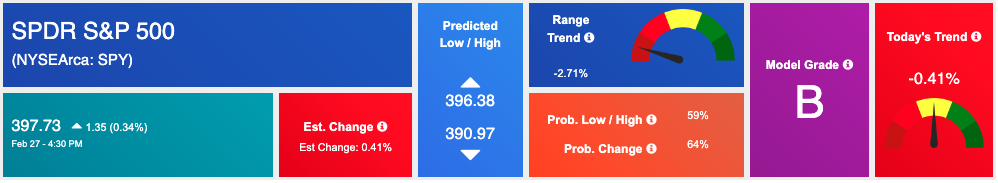
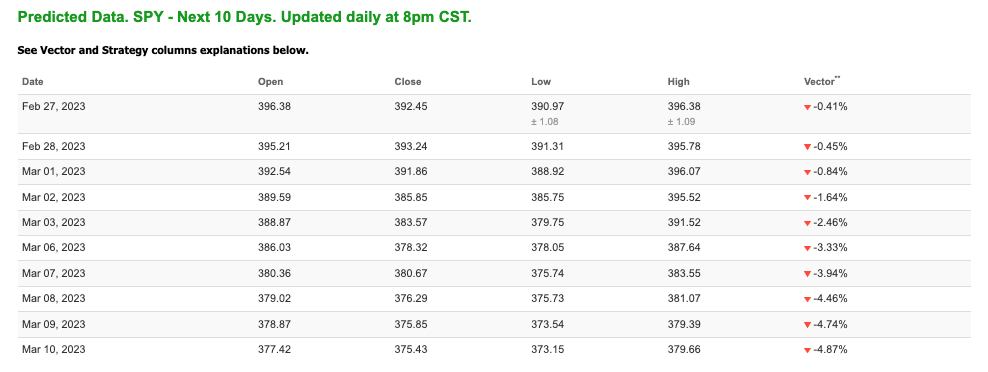
Note: The Vector column calculates the change of the Forecasted Average Price for the next trading session relative to the average of actual prices for the last trading session. The column shows the expected average price movement “Up or Down”, in percent. Trend traders should trade along the predicted direction of the Vector. The higher the value of the Vector the higher its momentum.
*Please note: At the time of publication Vlad Karpel does have a position in the featured symbol, spy. Our featured symbol is part of your free subscription service. It is not included in any paid Tradespoon subscription service. Vlad Karpel only trades his money in paid subscription services. If you are a paid subscriber, please review your Premium Member Picks, ActiveTrader, or MonthlyTrader recommendations. If you are interested in receiving Vlad’s picks, please click here.
West Texas Intermediate for Crude Oil delivery (CL.1) is priced at $75.74 per barrel, down 0.76%, at the time of publication.
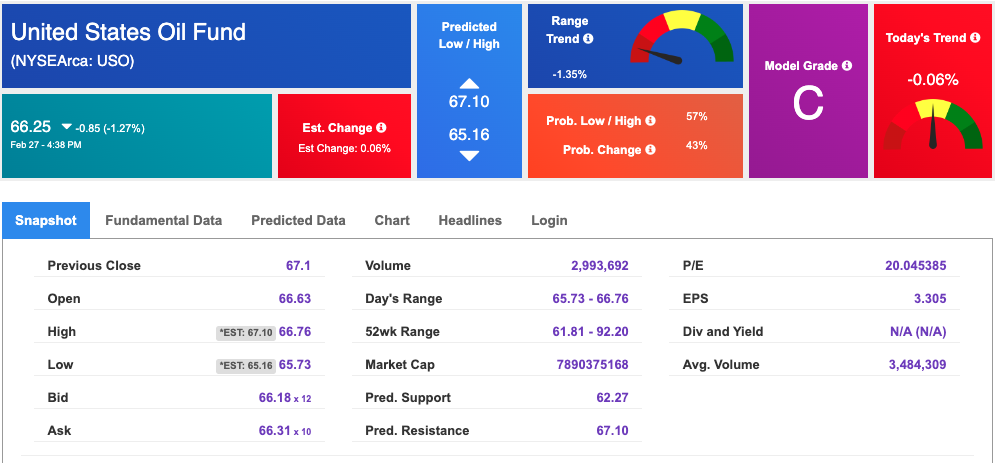
Looking at USO, a crude oil tracker, our 10-day prediction model shows mixed signals. The fund is trading at $66.25 at the time of publication. Prediction data is uploaded after the market close at 6 p.m., CST. Today’s data is based on market signals from the previous trading session.
The price for the Gold Continuous Contract (GC00) is up 0.39% at $1824.20 at the time of publication.
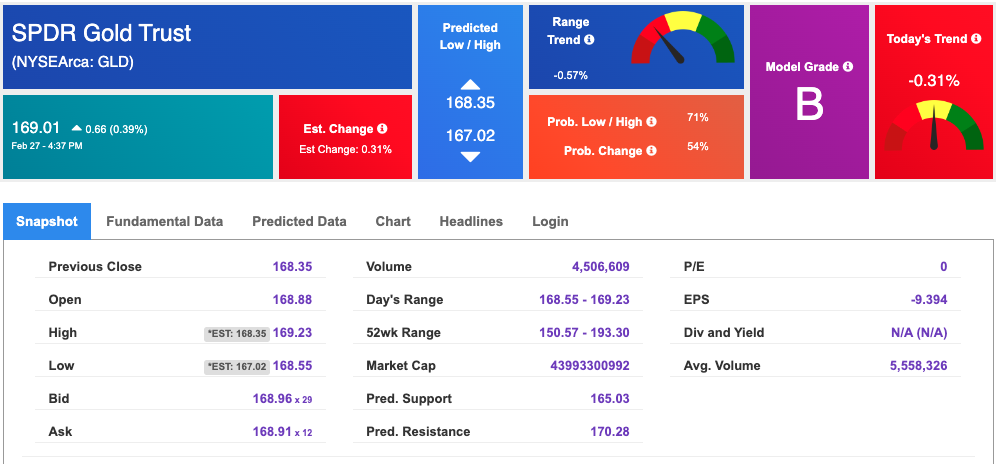
Using SPDR GOLD TRUST (GLD) as a tracker in our Stock Forecast Tool, the 10-day prediction window shows mixed signals. The gold proxy is trading at $169.01 at the time of publication. Vector signals show -0.31% for today. Prediction data is uploaded after the market close at 6 p.m., CST. Today’s data is based on market signals from the previous trading session.
The yield on the 10-year Treasury note is down at 3.918% at the time of publication.
The yield on the 30-year Treasury note is down at 3.930% at the time of publication.
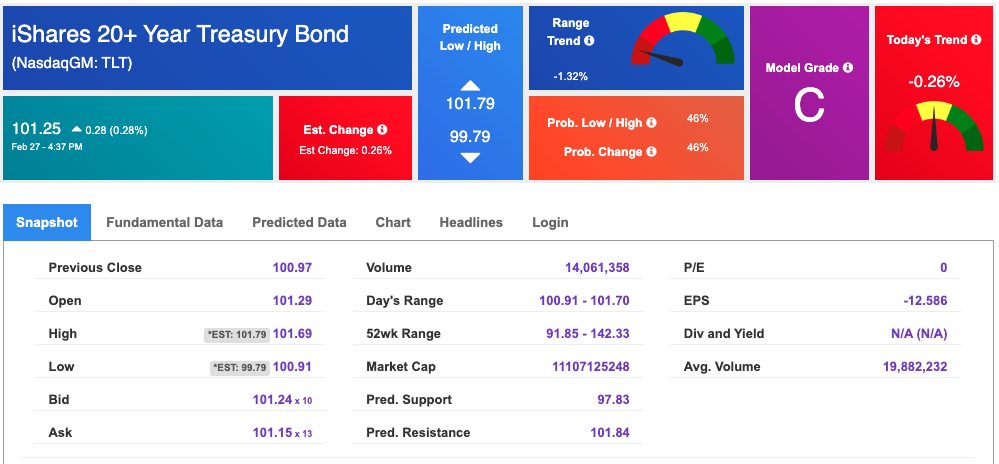
Using the iShares 20+ Year Treasury Bond ETF (TLT) as a proxy for bond prices in our Stock Forecast Tool, we see mixed signals in our 10-day prediction window. Prediction data is uploaded after the market close at 6 p.m., CST. Today’s data is based on market signals from the previous trading session.
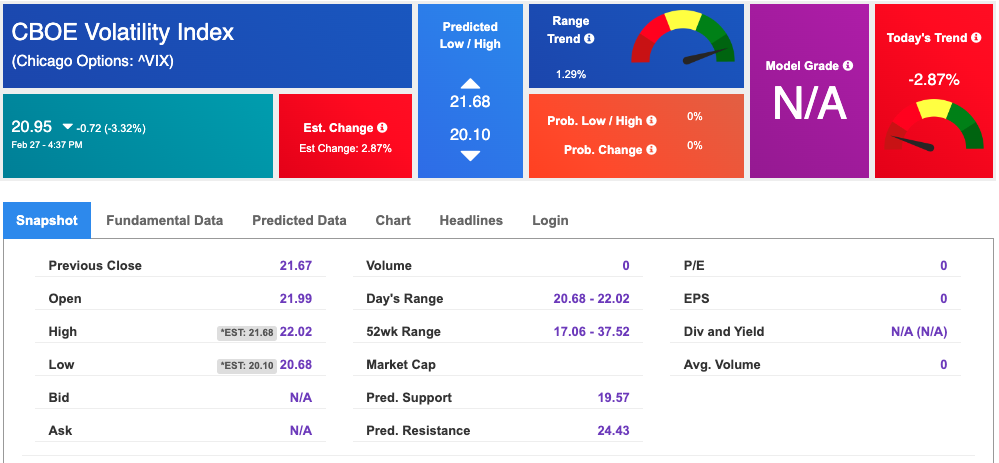
The CBOE Volatility Index (^VIX) is $20.95 at the time of publication, and our 10-day prediction window shows mixed signals. Prediction data is uploaded after the market close at 6 p.m., CST. Today’s data is based on market signals from the previous trading session.
Please share this Tradespoon Market Commentary with your friends.
![]()

![]()
Comments Off on


Tradespoon Tools make finding winning trades in minute as easy as 1-2-3.
Our simple 3 step approach has resulted in an average return of almost 20% per trade!

