 Save Big on Commissions ($0.65 per Contract)
CLICK HERE TO LEARN MORE
Save Big on Commissions ($0.65 per Contract)
CLICK HERE TO LEARN MORE
As the global financial landscape gears up for the excitement of earnings season, optimism prevails among investors. Yet, lurking in the background are heightened geopolitical tensions in the Middle East, casting a cloud of uncertainty over an otherwise optimistic stock market. This week, all eyes are on technology titans Tesla and Netflix as they prepare to unveil their earnings, shining a spotlight on the tech sector, which has been the driving force behind the S&P 500’s performance this year.
Marking the inception of the third-quarter earnings season, Tesla and Netflix are scheduled to make their earnings announcements this Wednesday. Following closely are industry giants like Alphabet, Microsoft, Meta Platforms, Amazon.com, and Apple in the ensuing weeks. Notably, Nvidia’s fiscal third quarter extends until October 31, with their earnings report anticipated to land in late November.
Apart from the earnings buzz, the geopolitical stage in the Middle East is being closely monitored. The Israel-Hamas conflict, potentially leading to a ground invasion of the Gaza Strip, threatens to disrupt the prevailing optimism about earnings. Nonetheless, in a surprising turn of events, the market’s fear index, the CBOE Volatility Index (Vix), experienced its most significant decline since June 1, dropping by 9.7% to 17.45 on Monday.
In a historical context, Middle East conflicts have frequently shaken up the oil market, and on Monday, WTI crude oil prices dipped by approximately 1%. Nevertheless, U.S. stock markets appeared poised for a positive start, with Dow Jones Industrial Average futures up by 0.2%, S&P 500 futures also up by 0.2%, and Nasdaq 100 futures gaining 0.1%.
Amid the geopolitical backdrop, recent inflation data from the Consumer Price Index (CPI) and Producer Price Index (PPI) have gripped the attention of investors. These metrics offer valuable insights into the realm of inflation and pricing trends, playing a pivotal role in shaping investment strategies, policy decisions, and business planning.
The CPI for September revealed a 3.7% annual surge in consumer prices, marginally surpassing consensus expectations. This upward trend was substantially driven by energy costs and robust shelter expenses. Every month, the headline index displayed a 0.4% increase, slightly exceeding the predicted 0.3%. These numbers underscore the Federal Reserve’s ongoing battle against inflation.
However, within this mixed picture, the core CPI—excluding volatile food and energy components—presents a more optimistic outlook. It demonstrated a 0.3% uptick in September, in line with the previous month’s pace. Annually, this suggests a 4.1% rate of core price increases, signaling that the Fed’s endeavors to cool the economy through interest rate hikes might be gaining traction.
Turning to the producer side, the PPI exhibited a 0.5% increase in September, though it represented a mild deceleration from the 0.7% rise seen in August. Nevertheless, these numbers exceeded expectations, which were set at 0.3%. When scrutinizing core producer prices, which exclude food and energy, a 0.3% increase for the month was evident, slightly exceeding forecasts.
Both the CPI and PPI data emphasize that inflation remains a persistent concern, exerting upward pressure on producer costs. Despite the slowdown in the monthly growth rate, these figures carry significant weight, influencing pricing dynamics throughout the supply chain and potentially impacting future consumer prices.
The simultaneous upward trajectory of both CPI and PPI data spotlights the Federal Reserve’s delicate balancing act. As policymakers strive to contain inflation while preserving overall economic health, investors will maintain a watchful eye on these indicators for cues about potential interest rate adjustments amid the ever-evolving economic landscape.
Given these multifaceted dynamics, the financial markets are grappling with ongoing concerns across various sectors. European markets kicked off the week with cautious gains, while small-cap stocks, technology firms, cyclicals, and regional banks are showing signs of weakness. The technology sector and the S&P 500, in particular, face the challenge of staying afloat above their 50-day moving averages, while the U.S. dollar’s months-long rally remains in the spotlight.
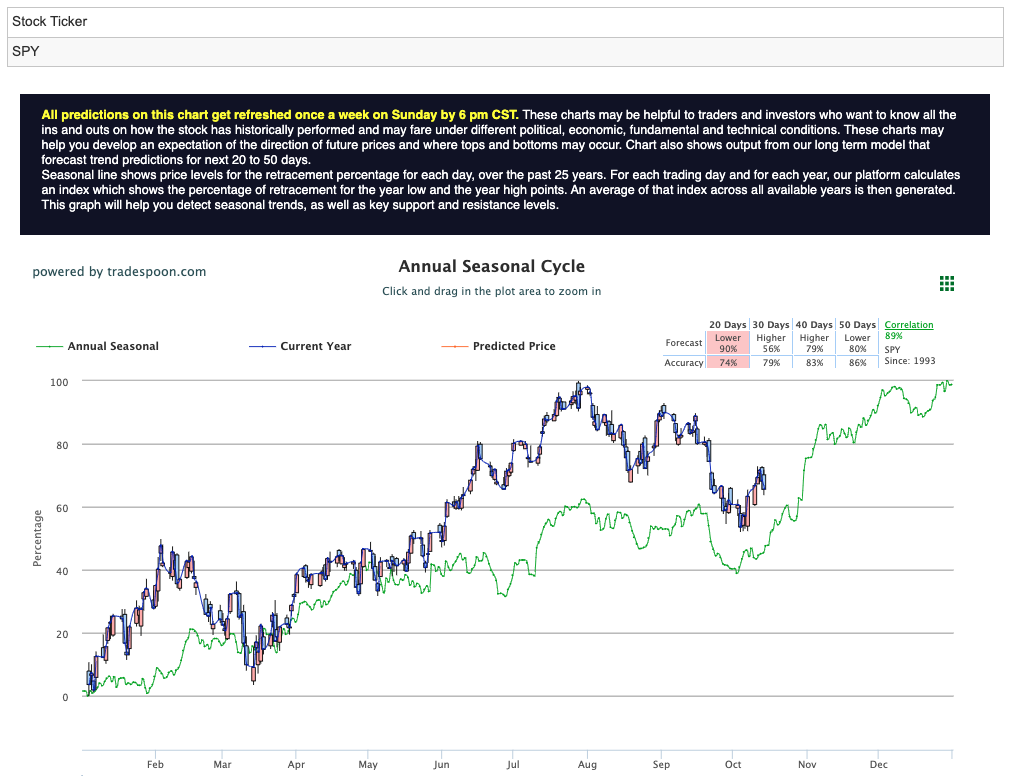
In response to these complexities, some market participants are opting for a market-neutral stance. Although economic data currently indicates a low probability of a recession, challenges persist. The SPY’s upward momentum may encounter resistance within the $450-470 range, with short-term support at $400-430. Additional downside movement looms on the horizon. Nonetheless, October’s anticipated volatility may eventually give way to the stabilizing influences of better-than-expected earnings and year-end seasonality, fostering a sense of market stability. For reference, the SPY Seasonal Chart is shown below:
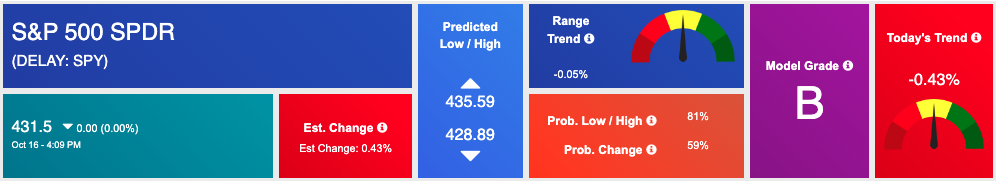
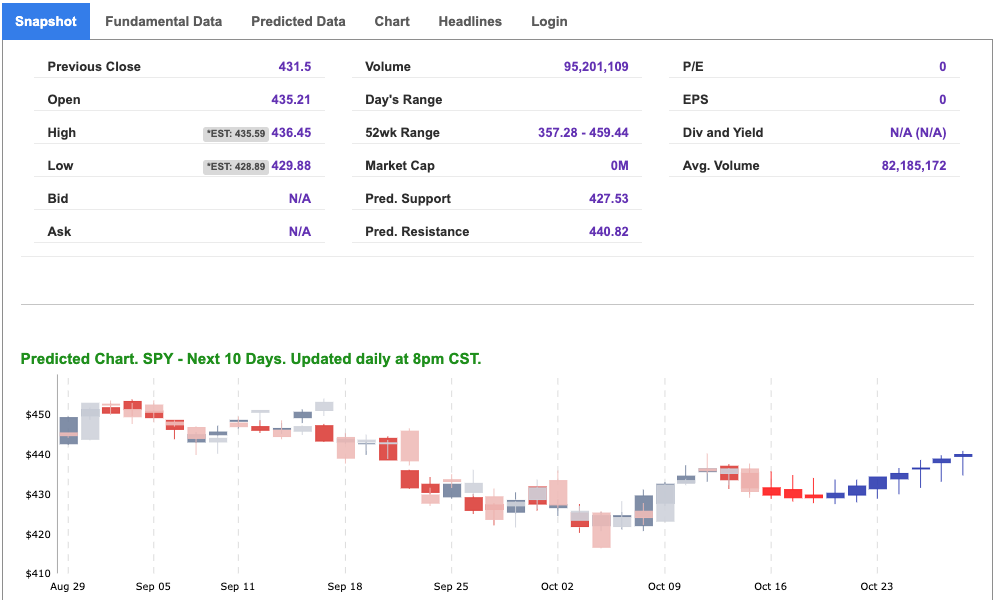
Using the “SPY” symbol to analyze the S&P 500 our 10-day prediction window shows a near-term positive outlook. Prediction data is uploaded after the market closes at 6 p.m. CST. Today’s data is based on market signals from the previous trading session.
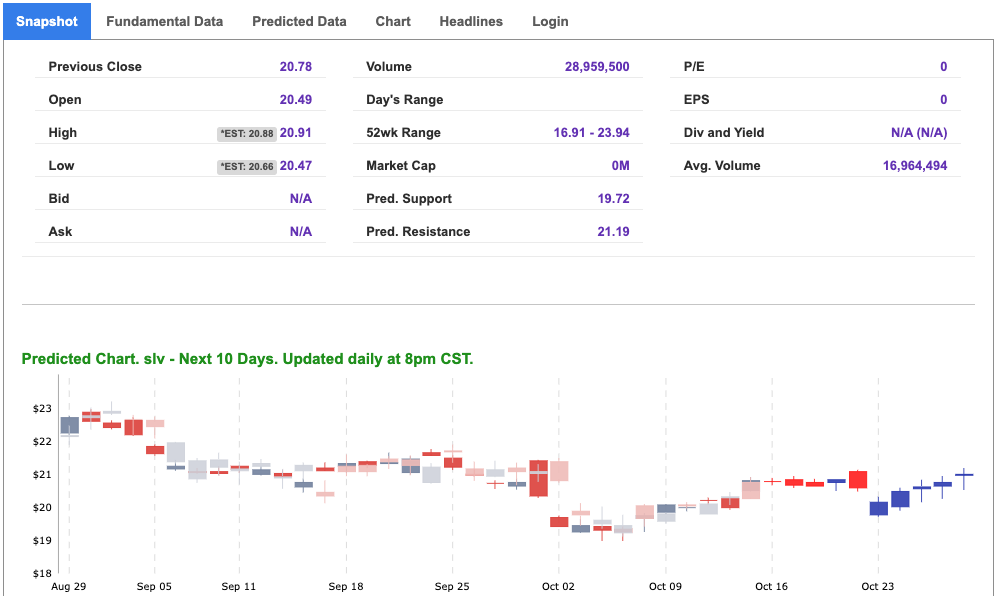
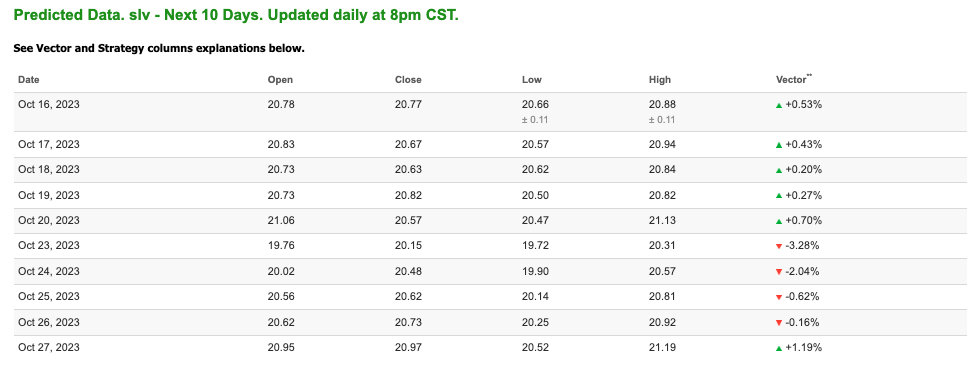
Note: The Vector column calculates the change of the Forecasted Average Price for the next trading session relative to the average of actual prices for the last trading session. The column shows the expected average price movement “Up or Down”, in percent. Trend traders should trade along the predicted direction of the Vector. The higher the value of the Vector the higher its momentum.
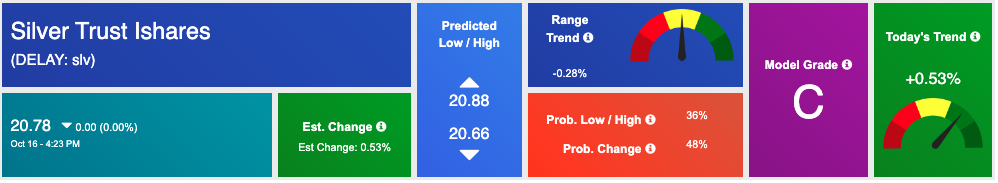
*Please note: At the time of publication Vlad Karpel does NOT have a position in the featured symbol, SLV. Our featured symbol is part of your free subscription service. It is not included in any paid Tradespoon subscription service. Vlad Karpel only trades his money in paid subscription services. If you are a paid subscriber, please review your Premium Member Picks, ActiveTrader, or MonthlyTrader recommendations. If you are interested in receiving Vlad’s picks, please click here.
West Texas Intermediate for Crude Oil delivery (CL.1) is priced at $87.04 per barrel, down 0.74%, at the time of publication.
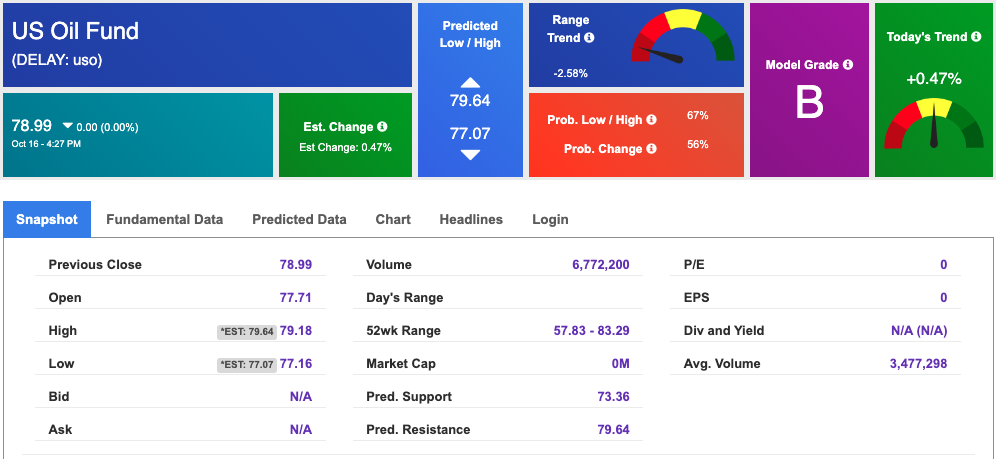
Looking at USO, a crude oil tracker, our 10-day prediction model shows mixed signals. The fund is trading at $78.99 at the time of publication. Prediction data is uploaded after the market close at 6 p.m., CST. Today’s data is based on market signals from the previous trading session.
The price for the Gold Continuous Contract (GC00) is down 0.44% at $1932.90 at the time of publication.
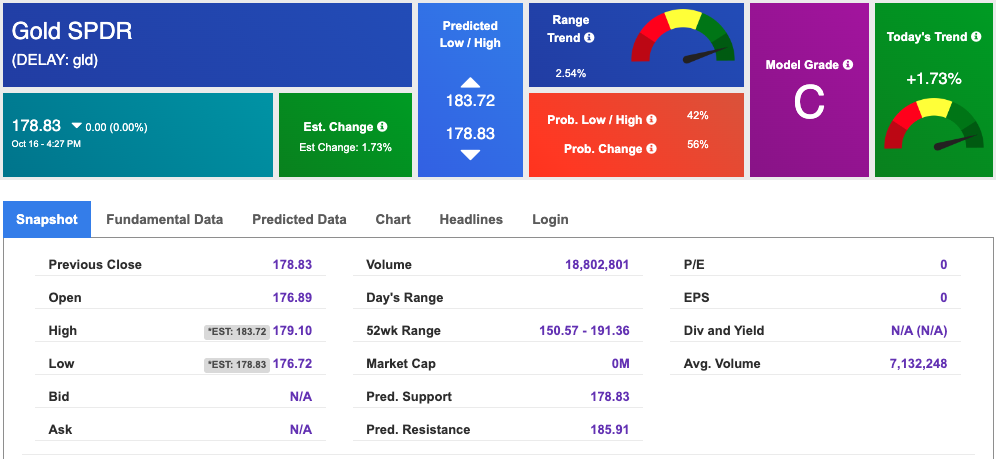
Using SPDR GOLD TRUST (GLD) as a tracker in our Stock Forecast Tool, the 10-day prediction window shows mixed signals. The gold proxy is trading at $178.83 at the time of publication. Vector signals show +1.73% for today. Prediction data is uploaded after the market close at 6 p.m., CST. Today’s data is based on market signals from the previous trading session.
The yield on the 10-year Treasury note is up at 4.712% at the time of publication.
The yield on the 30-year Treasury note is up at 4.847% at the time of publication.
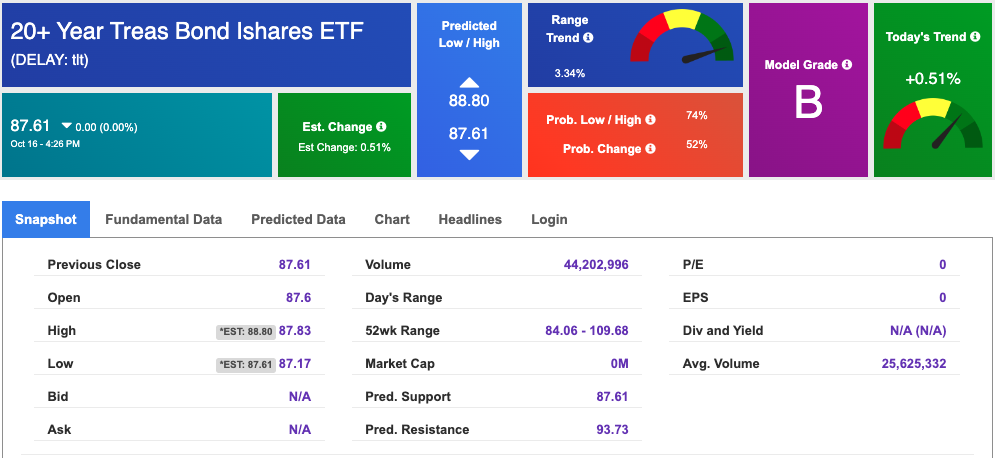
Using the iShares 20+ Year Treasury Bond ETF (TLT) as a proxy for bond prices in our Stock Forecast Tool, we see mixed signals in our 10-day prediction window. Prediction data is uploaded after the market close at 6 p.m., CST. Today’s data is based on market signals from the previous trading session.
The CBOE Volatility Index (^VIX) is priced at $17.21, down 10.92% at the time of publication, and our 10-day prediction window shows mixed signals. Prediction data is uploaded after the market close at 6 p.m., CST. Today’s data is based on market signals from the previous trading session.
Please share this Tradespoon Market Commentary with your friends.
![]()

![]()
Comments Off on


Tradespoon Tools make finding winning trades in minute as easy as 1-2-3.
Our simple 3 step approach has resulted in an average return of almost 20% per trade!

