 Special Offer: Try the 'Elite Trading Circle Membership' for ONLY $37!
CLICK HERE TO LEARN MORE
Special Offer: Try the 'Elite Trading Circle Membership' for ONLY $37!
CLICK HERE TO LEARN MORE
All three major U.S. stock indexes fell Wednesday, ending a four-day winning run as Russia said there had been no breakthrough in the Ukraine crisis and oil prices continued to climb. Despite Russia’s claim Tuesday that it would significantly reduce military operations in areas around the Ukrainian capital Kyiv and the northern city of Chernihiv, Russian forces continued to bomb those locations and locations nearby. Wednesday was an up-and-down day for the major American indices, with investors rethinking possible advances between Russia and Ukraine negotiators and hearing more hawkish language from the Fed. Tomorrow, look out for Walgreen’s quarterly earnings to release along with weekly employment data and February income and consumer spending reports. On Friday, several monthly manufacturing reports are due along with March unemployment and hourly earnings. Next week, the latest FOMC minutes are set to release.
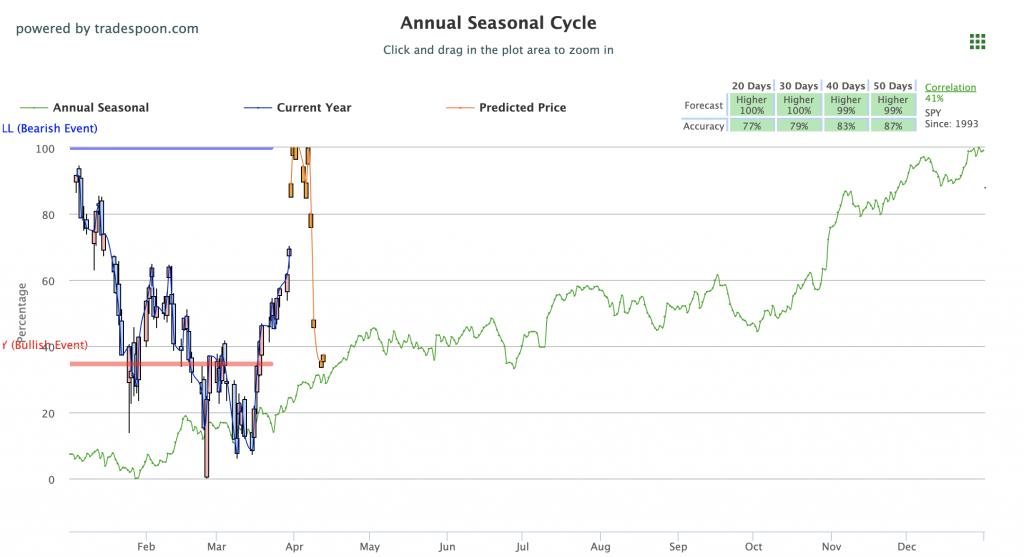
As the $VIX continues to lower, trading near the 18 level, geopolitical concerns in Ukraine may influence the market’s next move. We are watching the overhead resistance levels in the SPY, which are presently at $465 and then $474. The $SPY support is at $440. We expect the market to continue to trade higher in the next two to four weeks. The short-term market is overbought and due for a shallow pullback. Globally, both Asian and European markets closed to mixed results. We encourage all market commentary readers to maintain clearly defined stop levels for all positions. For reference, the SPY Seasonal Chart is shown below:
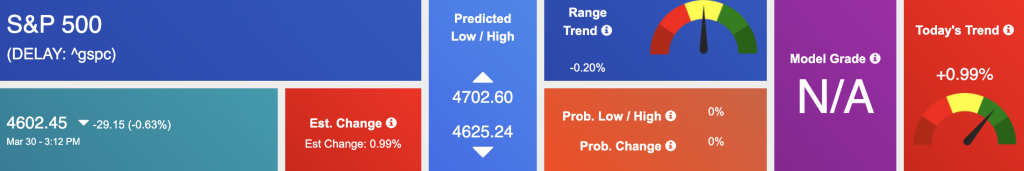
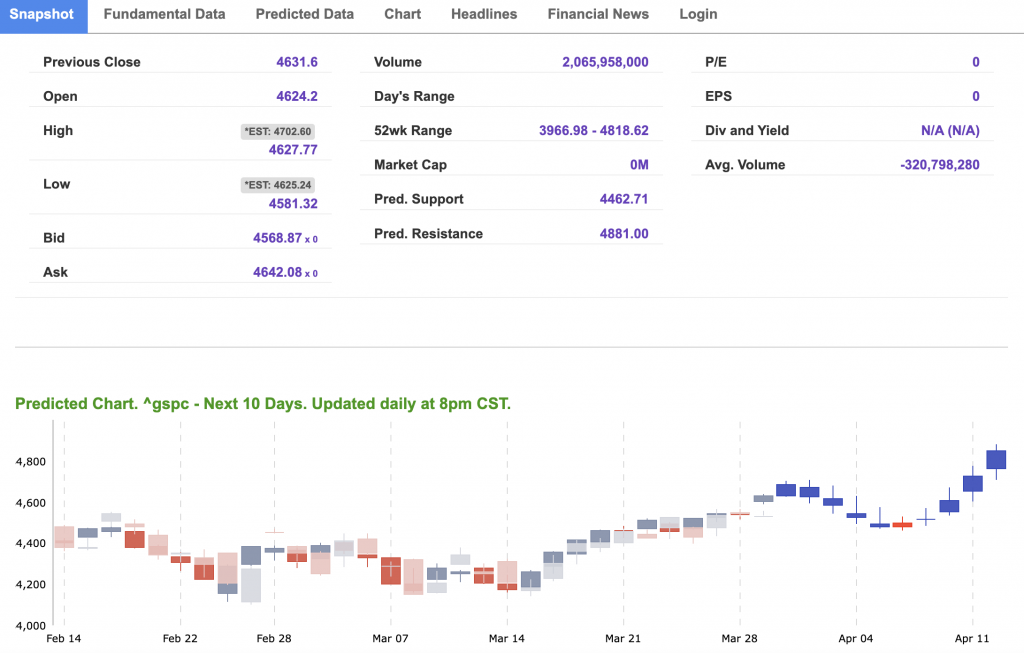
Using the “^GSPC” symbol to analyze the S&P 500 our 10-day prediction window shows a near-term mixed outlook. Prediction data is uploaded after the market closes at 6 p.m. CST. Today’s data is based on market signals from the previous trading session.
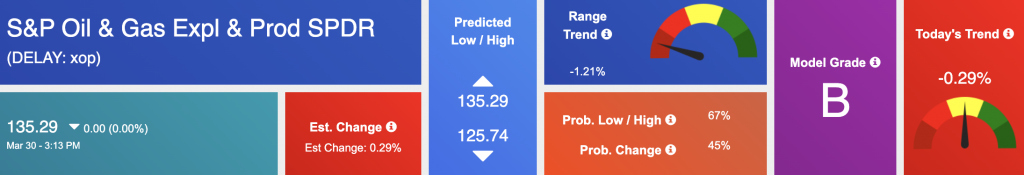
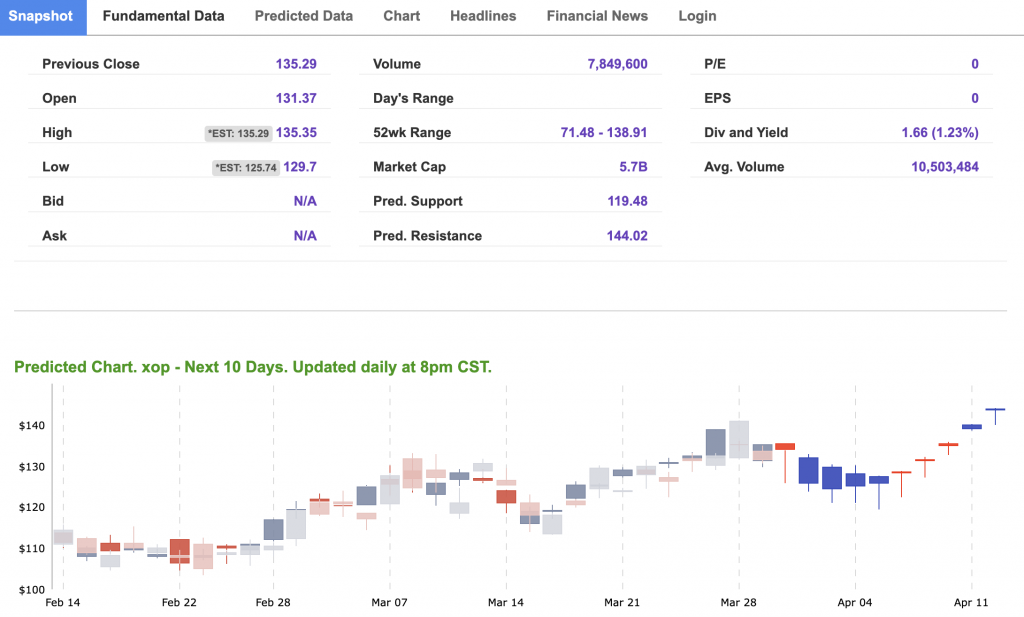
The symbol is trading at $135.29 with a vector of -0.29% at the time of publication.
10-Day Prediction data is uploaded after the market close at 6 p.m., CST. Today’s data is based on market signals from the previous trading session.
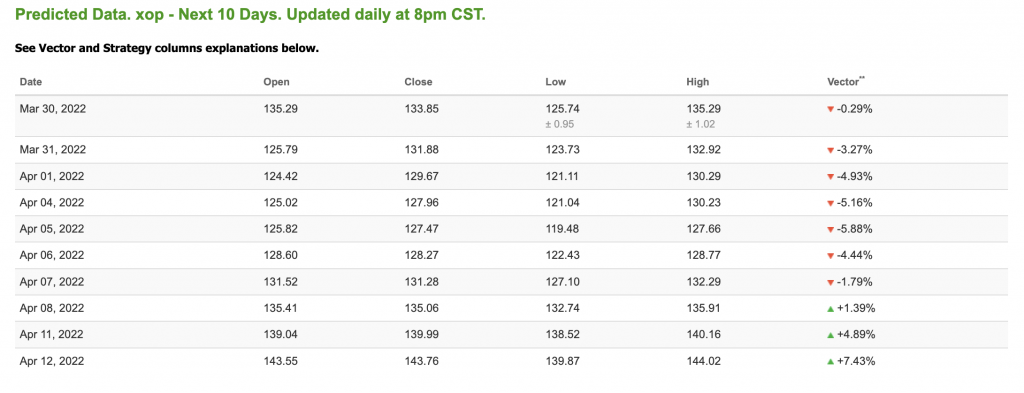
Note: The Vector column calculates the change of the Forecasted Average Price for the next trading session relative to the average of actual prices for the last trading session. The column shows the expected average price movement “Up or Down”, in percent. Trend traders should trade along the predicted direction of the Vector. The higher the value of the Vector the higher its momentum.
*Please note: At the time of publication Vlad Karpel does have a position in the featured symbol, XOP. Our featured symbol is part of your free subscription service. It is not included in any paid Tradespoon subscription service. Vlad Karpel only trades his money in paid subscription services. If you are a paid subscriber, please review your Premium Member Picks, ActiveTrader, or MonthlyTrader recommendations. If you are interested in receiving Vlad’s picks, please click here.
West Texas Intermediate for Crude Oil delivery (CL.1) is priced at $107.29 per barrel, up 2.95% at the time of publication.
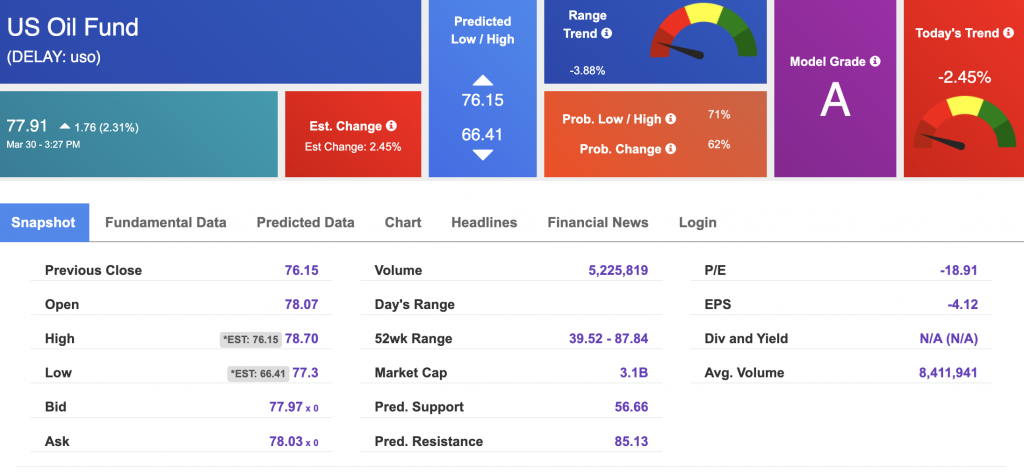
Looking at USO, a crude oil tracker, our 10-day prediction model shows mixed signals. The fund is trading at $77.91 at the time of publication. Prediction data is uploaded after the market close at 6 p.m., CST. Today’s data is based on market signals from the previous trading session.
The price for the Gold Continuous Contract (GC00) is up 1.06% at $1938.40 at the time of publication.
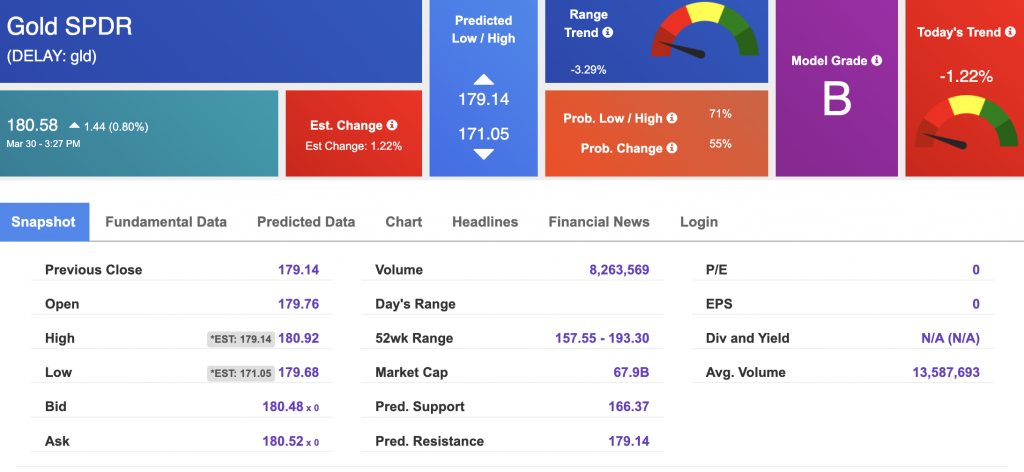
Using SPDR GOLD TRUST (GLD) as a tracker in our Stock Forecast Tool, the 10-day prediction window shows mixed signals. The gold proxy is trading at $180.58 at the time of publication. Vector signals show -1.22% for today. Prediction data is uploaded after the market close at 6 p.m., CST. Today’s data is based on market signals from the previous trading session.
The yield on the 10-year Treasury note is down, at 2.352% at the time of publication.
The yield on the 30-year Treasury note is down, at 2.476% at the time of publication.
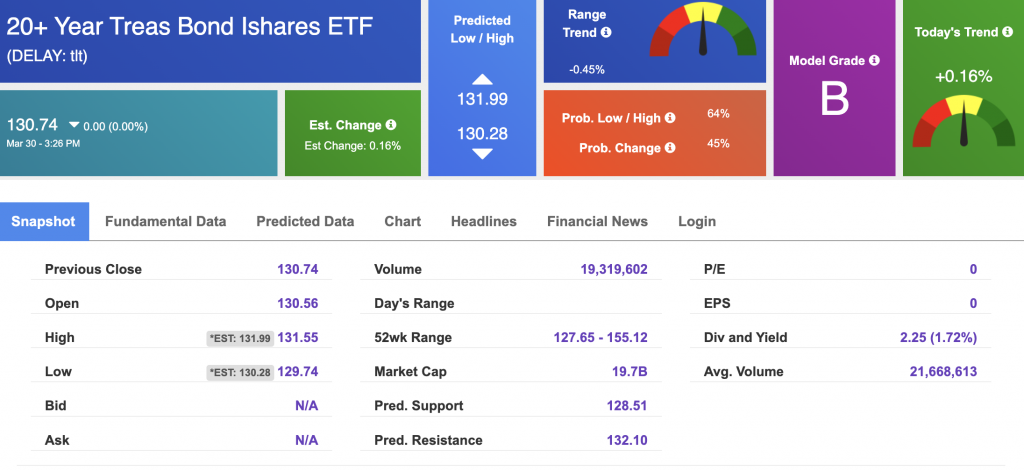
Using the iShares 20+ Year Treasury Bond ETF (TLT) as a proxy for bond prices in our Stock Forecast Tool, we see mixed signals in our 10-day prediction window. Prediction data is uploaded after the market close at 6 p.m., CST. Today’s data is based on market signals from the previous trading session.
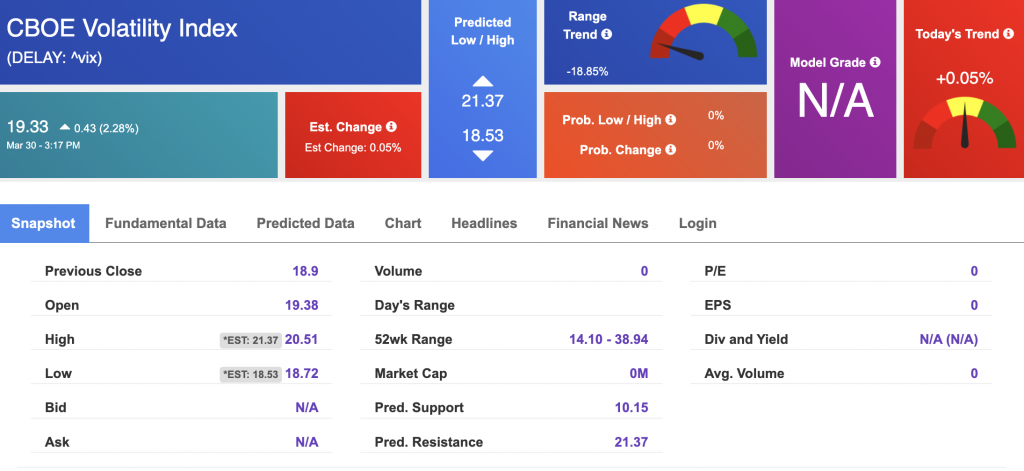
The CBOE Volatility Index (^VIX) is $19.33 at the time of publication, and our 10-day prediction window shows mixed signals. Prediction data is uploaded after the market close at 6 p.m., CST. Today’s data is based on market signals from the previous trading session.
Please share this Tradespoon Market Commentary with your friends.
![]()

![]()
Comments Off on


Tradespoon Tools make finding winning trades in minute as easy as 1-2-3.
Our simple 3 step approach has resulted in an average return of almost 20% per trade!

