 Special Offer: Try the 'Vlad's Portfolio Membership' for ONLY $37!
CLICK HERE TO LEARN MORE
Special Offer: Try the 'Vlad's Portfolio Membership' for ONLY $37!
CLICK HERE TO LEARN MORE
As we cross into mid-June, the stock market remains perched at a critical juncture—buoyed by cooling inflation data and strength in enterprise tech, yet weighed down by rising geopolitical risks and uncertainty around Federal Reserve policy. After last week’s dramatic swings, Monday opened with a bounce as investors reacted to signs of de-escalation in the Middle East. Still, the broader picture points to a market locked in sideways churn, with structural risks lurking just beneath the surface.
The S&P 500, which came within 1.7% of its all-time high last week, continues to flirt with breakout territory. Recession odds were ticking higher, and the risks of “higher-for-longer” policy are growing harder to ignore.
Last Week’s Market: Hope, Hype, and a Harsh Reminder
Last week started on the defensive. Former President Trump’s proposal for sweeping tariffs—dubbed “Liberation Day” duties—triggered a sharp selloff, wiping out over $6 trillion in S&P 500 market cap across two trading sessions. The CBOE Volatility Index (VIX) saw its third-largest weekly spike on record, a reminder that political headlines remain powerful volatility catalysts.
Relief arrived midweek. May’s Consumer Price Index (CPI) rose just 2.5% year-over-year, while Producer Price Index (PPI) data also came in soft. Bond yields slipped, and the probability of a September rate cut climbed above 50%. The S&P 500 responded with a 0.4% gain on Thursday, with tech leading the rebound.
Meanwhile, AI momentum continued to anchor the tech sector. Adobe posted a blowout earnings report, raising full-year guidance on soaring demand for its AI-driven creative tools. Microsoft, Oracle, and IBM all hit new highs. The strength in enterprise software reaffirms a narrative we’ve seen building all year—AI isn’t just a hype cycle, it’s reshaping where institutional capital flows.
But not all sectors participated. Lululemon exceeded earnings expectations but lowered guidance due to weakening consumer demand and tariff risks—a red flag for the discretionary space and a reminder that rising costs and soft sentiment remain headwinds outside of tech.
Then came Friday’s jolt: news broke of an Israeli military strike on Iranian targets, followed by retaliatory threats from Iran. Markets dropped hard. The Dow plunged over 800 points, while the S&P 500 and Nasdaq both fell more than 1%. Oil prices surged and defense, energy, and gold rallied, alongside a temporary spike in the dollar and U.S. Treasury demand.
Today’s Recovery: Oil Retreats, Diplomacy Emerges, and Traders Regain Composure
Fast forward to Monday, and the tone shifted dramatically. Stocks opened strong across the board, with the Dow up 423 points, the S&P 500 gaining 1%, and the Nasdaq climbing 1.3%. Behind the optimism: reports that Iran is urgently seeking to de-escalate tensions and resume nuclear negotiations, contingent on the U.S. staying out of direct conflict.
Oil markets reflected the change in tone. WTI crude dropped 1.3% to $72.04, down from a weekend high, and Brent crude saw an even steeper decline. Though prices remain elevated relative to early June, the pullback challenged expectations that war would automatically drive oil higher. In fact, traders who positioned long on oil into the weekend were caught offside by the sharp reversal.
Interestingly, bond markets defied traditional safe-haven logic. Instead of flocking to Treasuries, investors sold them—driving yields higher—amid renewed inflation concerns. Despite recent strong demand in last week’s 10-year and 30-year auctions, the fear now is that higher oil prices may reignite inflation and push the Fed toward a more hawkish stance.
The U.S. Dollar Index slipped, reversing part of last week’s flight-to-safety rally, while both European and Asian markets closed higher, signaling global relief—at least temporarily.
The Week Ahead: All Eyes on the Fed and Data-Driven Catalysts
The centerpiece of this week is Wednesday’s FOMC meeting, where the Fed is expected to hold rates steady. However, Chairman Jerome Powell’s tone and the Fed’s revised economic projections could be pivotal in shaping rate expectations for the rest of 2025. Following soft inflation data and a cooling jobs market, the path seemed set for a September cut—but renewed oil volatility has introduced a slim chance (0.2%) of a hike, and more importantly, reawakened fears of “sticky inflation.”
Other key data this week includes:
Markets will be closed on Thursday in observance of Juneteenth, compressing trading activity into a shortened week.
Sentiment Check: Consolidation, Not Capitulation
While geopolitical threats and sticky inflation risks dominate headlines, the market’s internals point to a healthy—but—cautious environment. AI continues to drive structural demand in tech, and falling bond yields last week suggest investor confidence in an eventual pivot by the Fed. That said, higher rates for longer, wobbly employment data, and geopolitical surprises continue to prevent full-fledged bullish conviction.
We maintain our market-neutral stance, expecting sideways trading in the short term, with SPY holding support near $540–$550 and upside capped near $600–$620. Long-term trends remain under pressure, and the next move—either a breakout or breakdown—will depend heavily on the interplay between Fed guidance, economic data, and global headlines. For reference, the SPY Seasonal Chart is shown below:
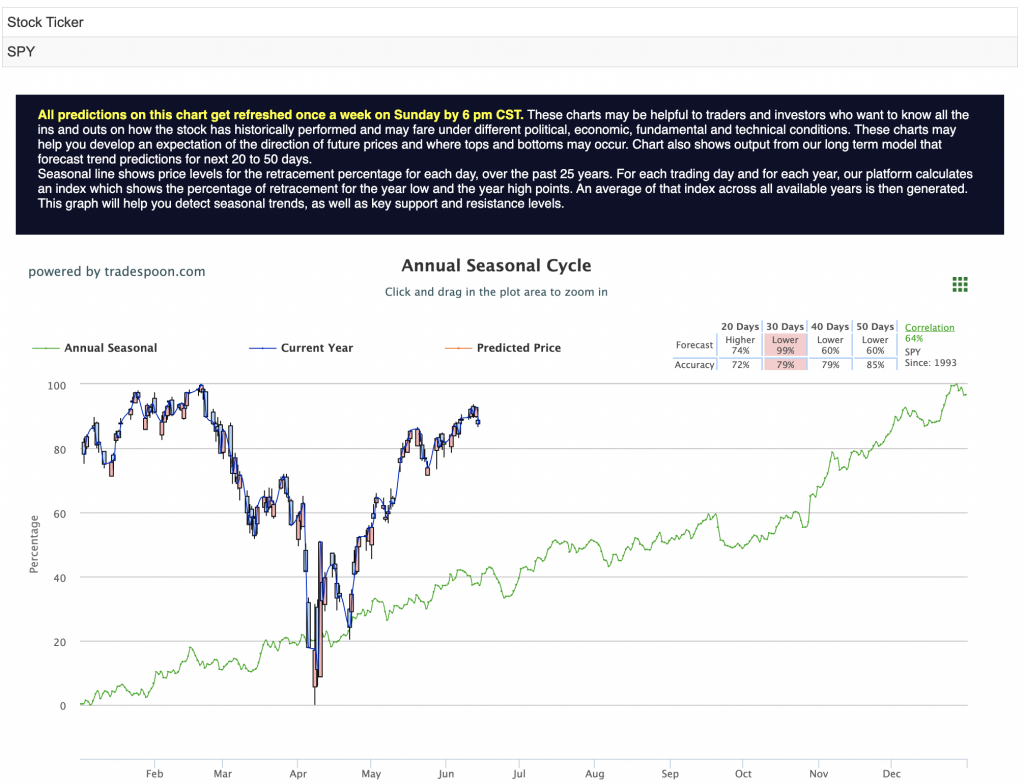
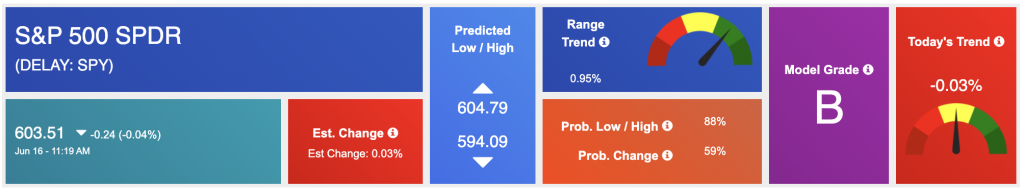
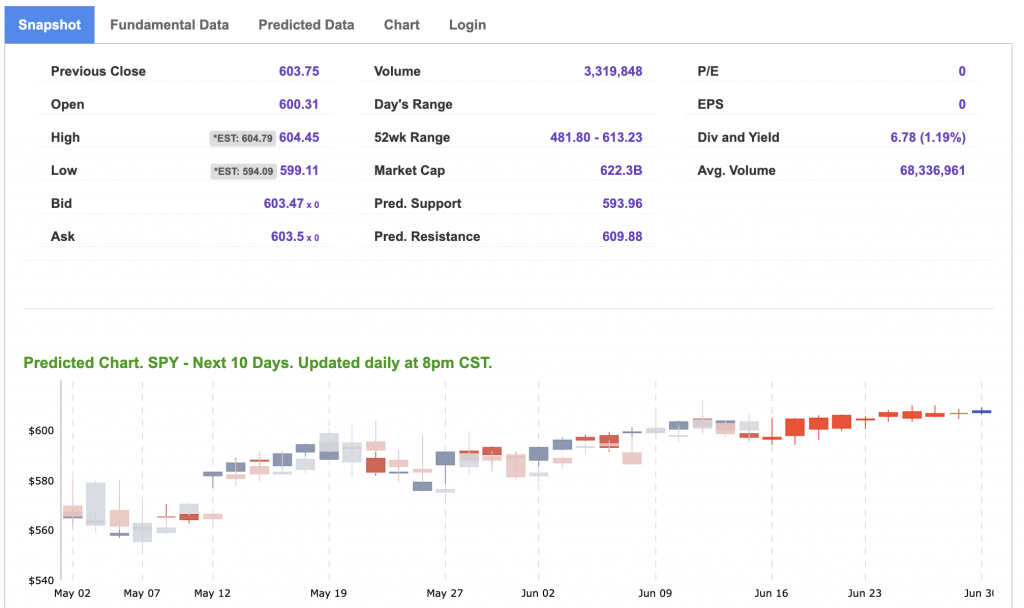
Using the “SPY” symbol to analyze the S&P 500, our 10-day prediction window shows a near-term positive outlook. Prediction data is uploaded after the market closes at 6 p.m. CST. Today’s data is based on market signals from the previous trading session.
Our featured symbol for Tuesday is MSFT. Microsoft Corp. – MSFT is showing a steady vector in our Stock Forecast Toolbox’s 10-day forecast.
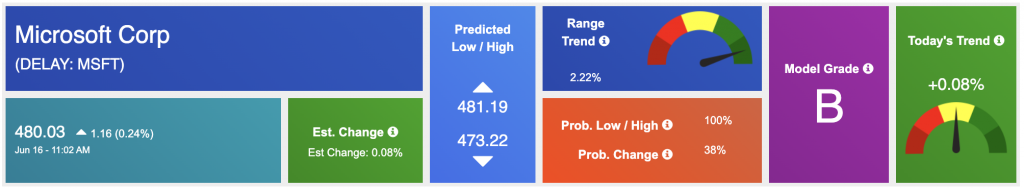
The symbol is trading at $142.79 with a vector of +0.95% at the time of publication.
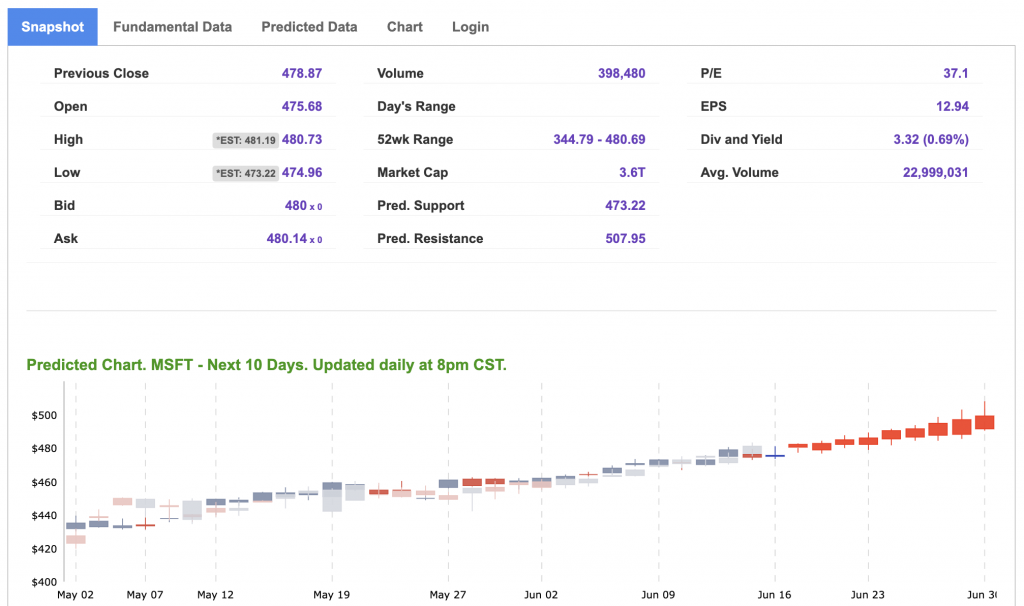
10-Day Prediction data is uploaded after the market close at 6 p.m., CST. Today’s data is based on market signals from the previous trading session.
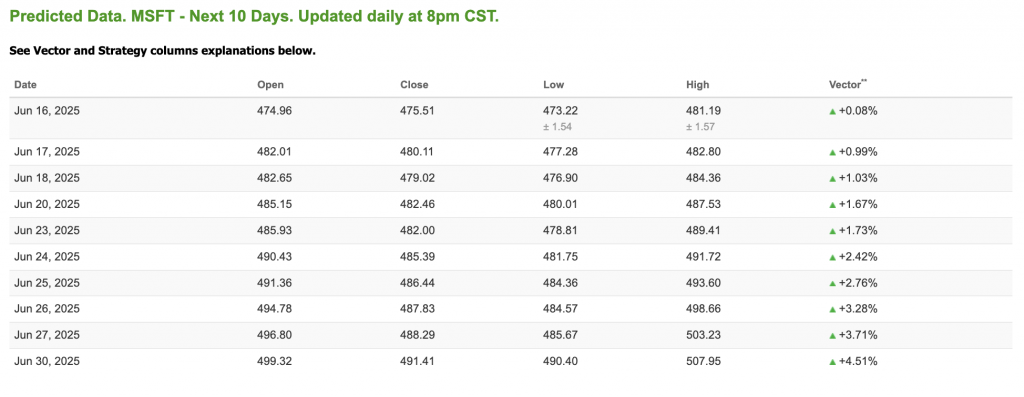
Note: The Vector column calculates the change of the Forecasted Average Price for the next trading session relative to the average of actual prices for the last trading session. The column shows the expected average price movement “Up or Down”, in percent. Trend traders should trade along the predicted direction of the Vector. The higher the value of the Vector the higher its momentum.
*Please note: At the time of publication, Vlad Karpel does have a position in the featured symbol, MSFT. Our featured symbol is part of your free subscription service. It is not included in any paid Tradespoon subscription service. Vlad Karpel only trades his money in paid subscription services. If you are a paid subscriber, please review your Premium Member Picks, ActiveTrader, or MonthlyTrader recommendations. If you are interested in receiving Vlad’s picks, please click here.
West Texas Intermediate for Crude Oil delivery (CL.1) is priced at $71.55 per barrel, down 1.97%, at the time of publication.
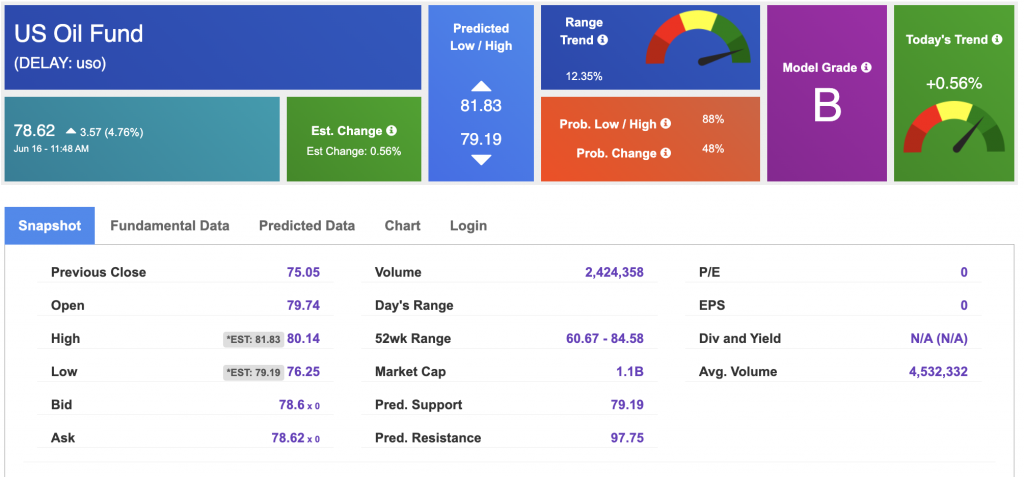
Looking at USO, a crude oil tracker, our 10-day prediction model shows mixed signals. The fund is trading at $78.62 at the time of publication. Prediction data is uploaded after the market close at 6 p.m., CST. Today’s data is based on market signals from the previous trading session.
The price for the Gold Continuous Contract (GC00) is down 1.00% at $3,418.40 at the time of publication.
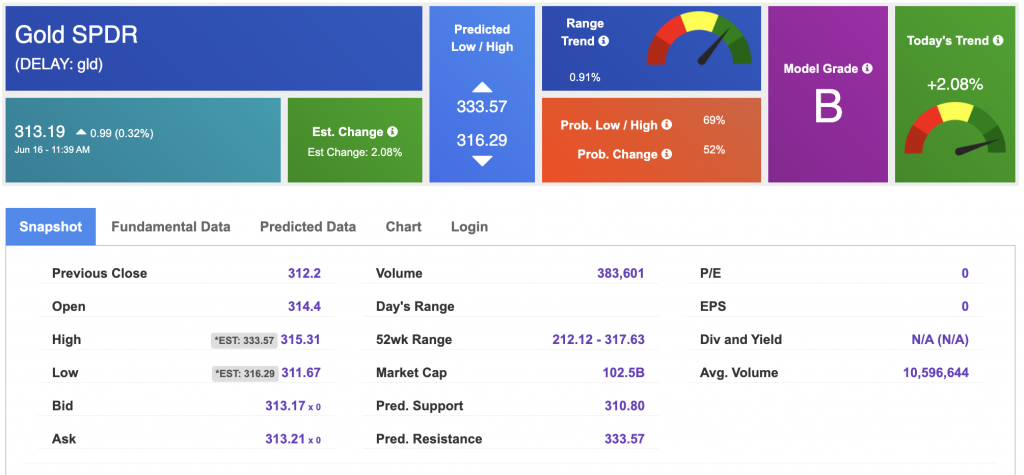
Using SPDR GOLD TRUST (GLD) as a tracker in our Stock Forecast Tool, the 10-day prediction window shows mixed signals. The gold proxy is trading at $313.19 at the time of publication. Vector signals show +2.08% for today. Prediction data is uploaded after the market close at 6 p.m., CST. Today’s data is based on market signals from the previous trading session.
The yield on the 10-year Treasury note is up at 4.423% at the time of publication.
The yield on the 30-year Treasury note is up at 4.919% at the time of publication.

Using the iShares 20+ Year Treasury Bond ETF (TLT) as a proxy for bond prices in our Stock Forecast Tool, we see mixed signals in our 10-day prediction window. Prediction data is uploaded after the market close at 6 p.m., CST. Today’s data is based on market signals from the previous trading session.
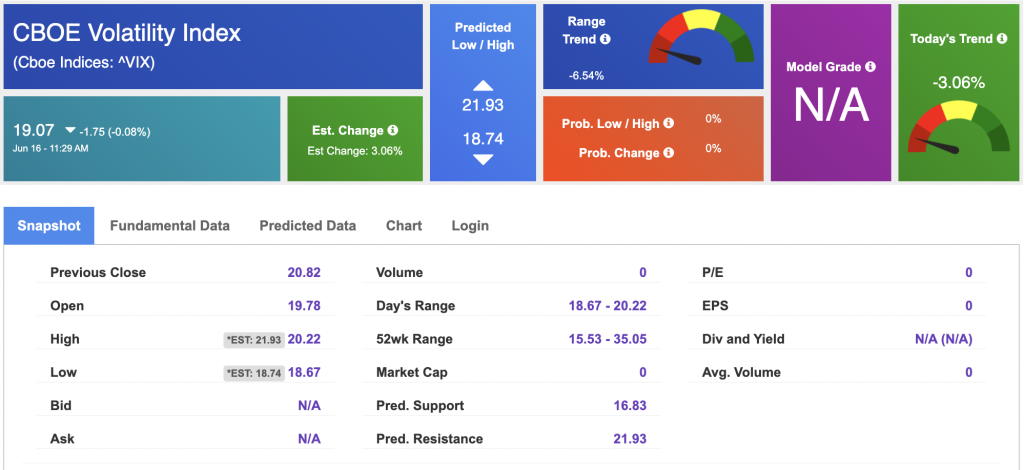
The CBOE Volatility Index (^VIX) is priced at $19.07 at the time of publication, and our 10-day prediction window shows mixed signals. Prediction data is uploaded after the market close at 6 p.m., CST. Today’s data is based on market signals from the previous trading session.
Please share this Tradespoon Market Commentary with your friends.
![]()

![]()
Comments Off on


Tradespoon Tools make finding winning trades in minute as easy as 1-2-3.
Our simple 3 step approach has resulted in an average return of almost 20% per trade!

