 Special Offer: Try the 'Elite Trading Circle Membership' for ONLY $37!
CLICK HERE TO LEARN MORE
Special Offer: Try the 'Elite Trading Circle Membership' for ONLY $37!
CLICK HERE TO LEARN MORE
After stopping a multi-day skid on Friday, U.S. stocks turned lower to start the week, with all three major U.S. indices closing in the red. Continued recession and inflation fears are contributing to the pressure after last week’s labor and CPI data. On Monday, U.S. equities tumbled back towards the beginning of the day after Bloomberg reported that Apple is considering slowing hiring and spending growth in some areas next year as a result of a potential economic recession. Also occurring on Friday was the breaking news decision regarding the Twitter purchase, which Elon Musk has now withdrawn from. Elsewhere, the market focus remains on the latest earning season, with major banks releasing data this week along with major tech and telecom. Following their earnings release, Goldman Sachs’ stock rose 2.1%, with second-quarter earnings beating expectations and a better-than-anticipated rise in its equities business. Shares of Bank of America rose 0.4 percent after the bank missed Wall Street’s profit forecast, but revenue met expectations, and net interest income outperformed. IBM earnings are due after the close today. Johnson & Johnson, Netflix, and Haliburton reports are due on Tuesday while Wednesday will feature Abbott laboratories, CSX, and Tesla.
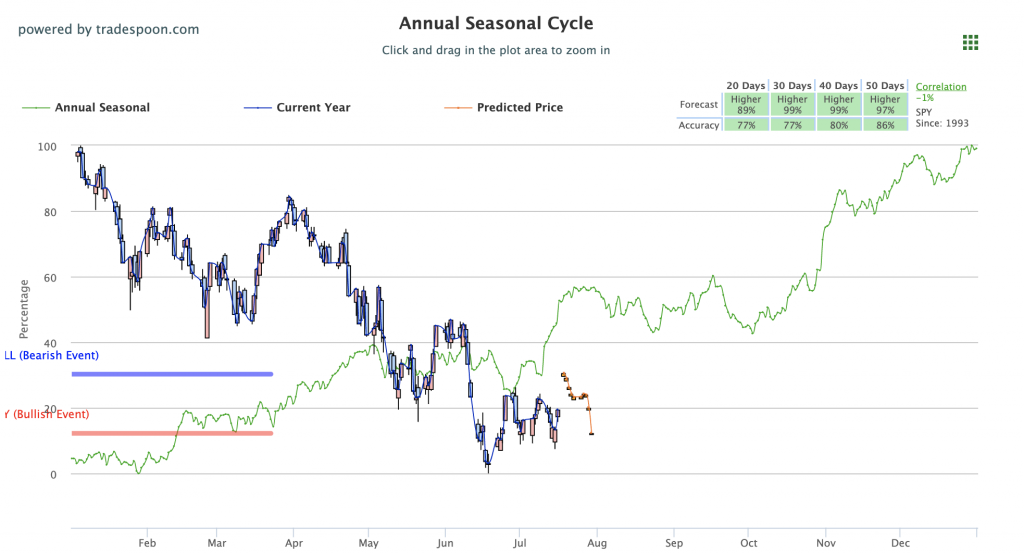
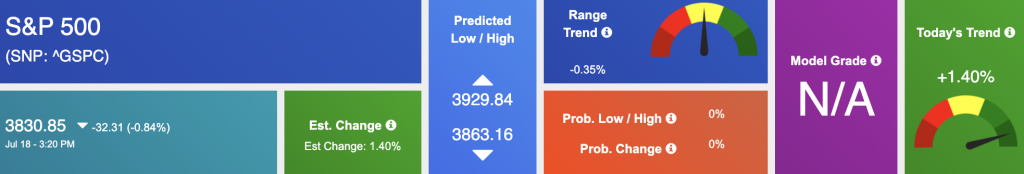
To open the week, the $VIX is trading near the 27 levels and should be monitored as earnings continue leading up to the next Federal Open Market Committee meeting. The $JNJ, $GS, and $NFLX earnings this week, as well as other big name reports, can influence the next move in the market. We’re keeping an eye on the overhead resistance levels in the SPY, which are presently at $396 and $409; whereas the $SPY support is at $380 and then $372. We expect the market to continue the short-term rally for the next couple of weeks. Globally, both European and Asian markets traded impressively higher. We encourage all market commentary readers to maintain clearly defined stop levels for all positions. For reference, the SPY Seasonal Chart is shown below:
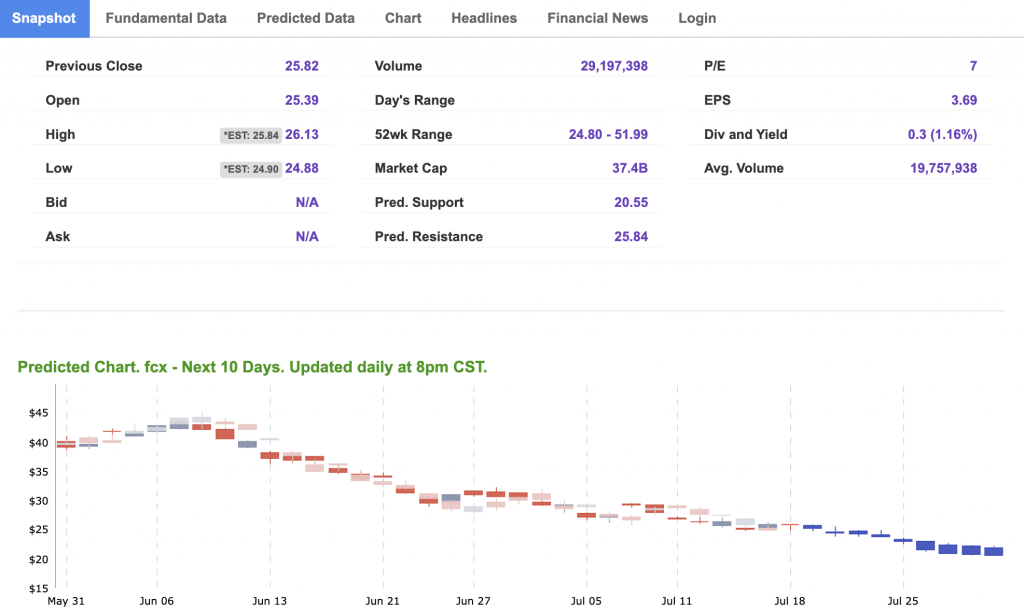
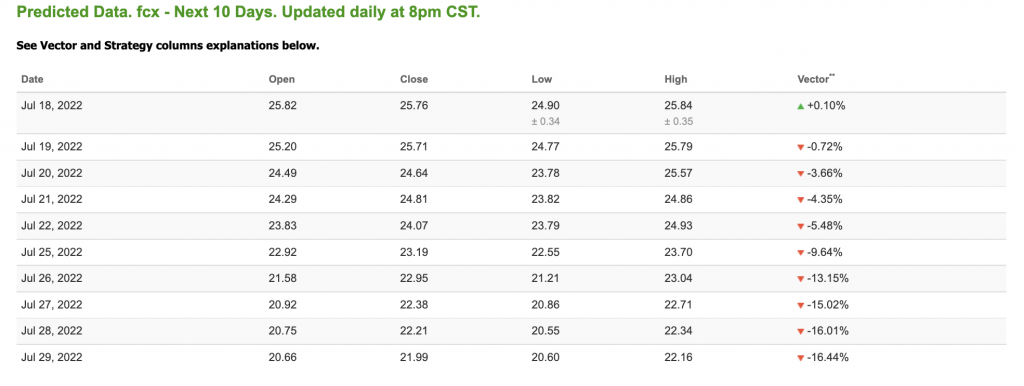
Note: The Vector column calculates the change of the Forecasted Average Price for the next trading session relative to the average of actual prices for the last trading session. The column shows the expected average price movement “Up or Down”, in percent. Trend traders should trade along the predicted direction of the Vector. The higher the value of the Vector the higher its momentum.
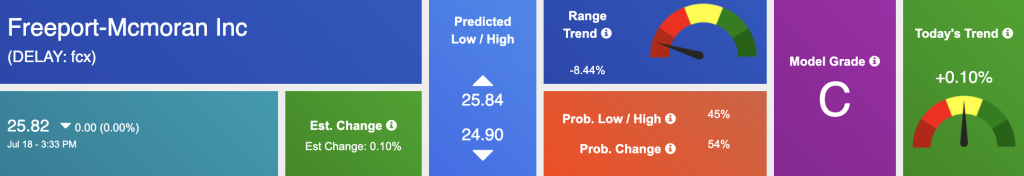
*Please note: At the time of publication Vlad Karpel does have a position in the featured symbol, FCX. Our featured symbol is part of your free subscription service. It is not included in any paid Tradespoon subscription service. Vlad Karpel only trades his money in paid subscription services. If you are a paid subscriber, please review your Premium Member Picks, ActiveTrader, or MonthlyTrader recommendations. If you are interested in receiving Vlad’s picks, please click here.
West Texas Intermediate for Crude Oil delivery (CL.1) is priced at $102.17 per barrel, up 4.69%, at the time of publication.
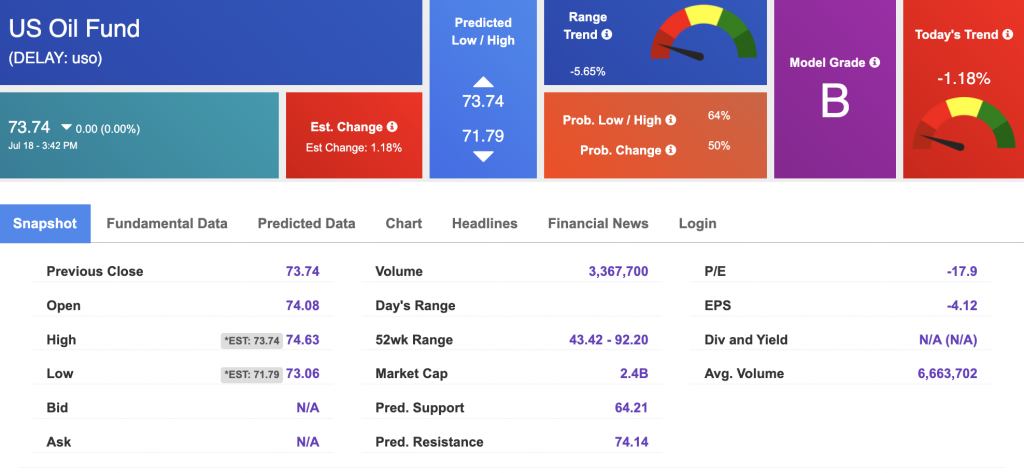
Looking at USO, a crude oil tracker, our 10-day prediction model shows mixed signals. The fund is trading at $73.74 at the time of publication. Prediction data is uploaded after the market close at 6 p.m., CST. Today’s data is based on market signals from the previous trading session.
The price for the Gold Continuous Contract (GC00) is up 0.19% at $1796.90 at the time of publication.
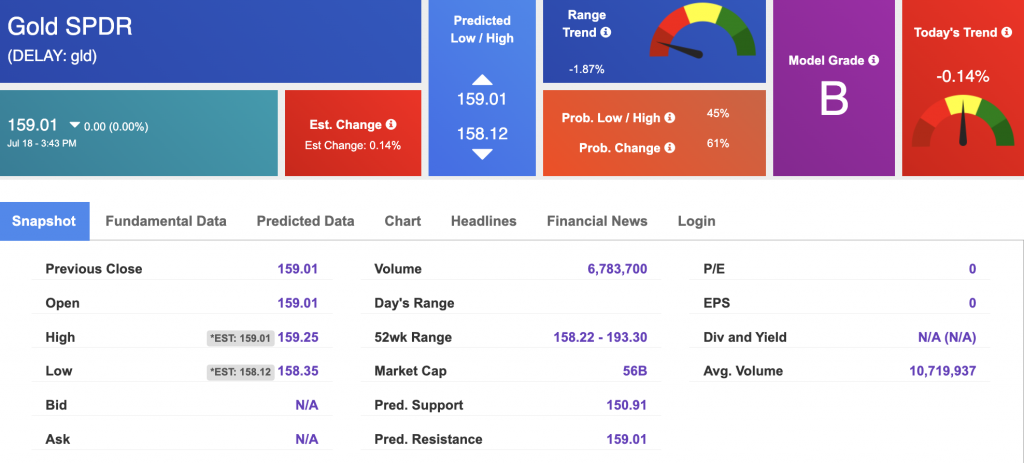
Using SPDR GOLD TRUST (GLD) as a tracker in our Stock Forecast Tool, the 10-day prediction window shows mixed signals. The gold proxy is trading at $159.01 at the time of publication. Vector signals show -0.14% for today. Prediction data is uploaded after the market close at 6 p.m., CST. Today’s data is based on market signals from the previous trading session.
The yield on the 10-year Treasury note is up, at 2.985% at the time of publication.
The yield on the 30-year Treasury note is up, at 3.164% at the time of publication.
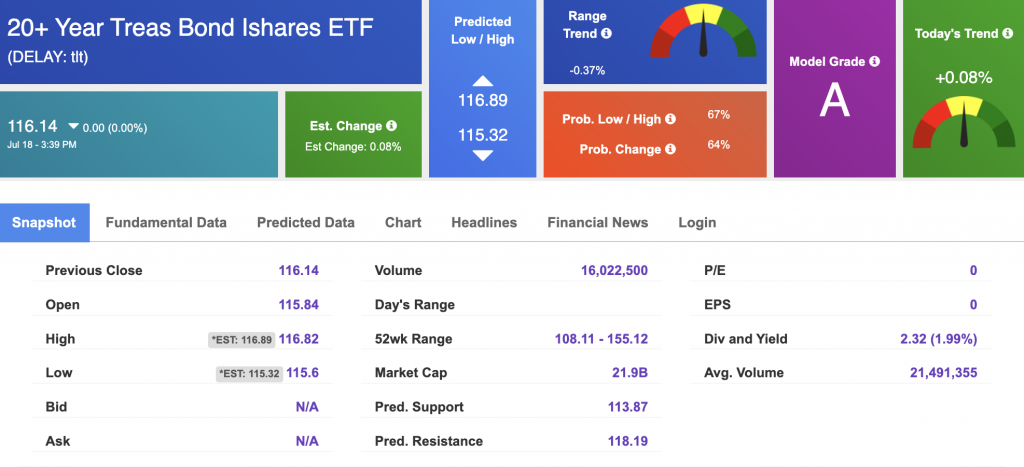
Using the iShares 20+ Year Treasury Bond ETF (TLT) as a proxy for bond prices in our Stock Forecast Tool, we see mixed signals in our 10-day prediction window. Prediction data is uploaded after the market close at 6 p.m., CST. Today’s data is based on market signals from the previous trading session.
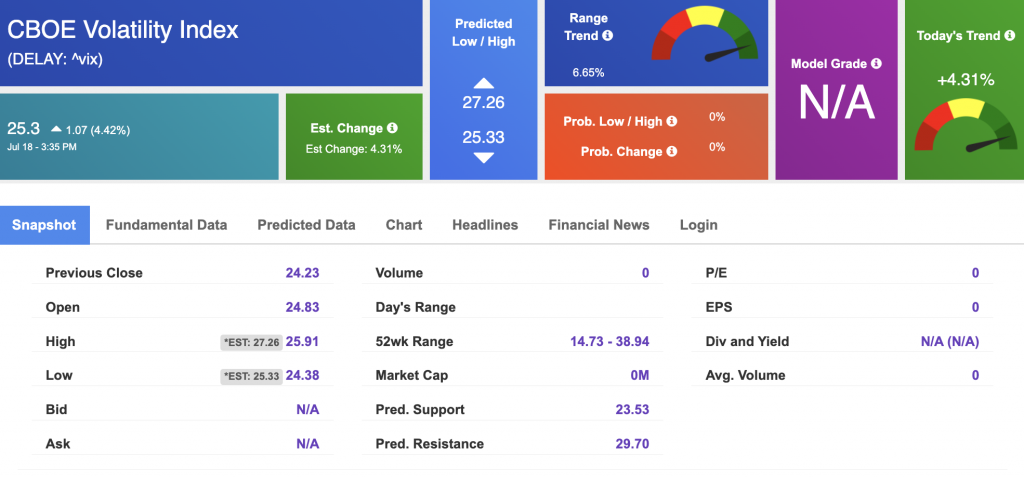
The CBOE Volatility Index (^VIX) is $25.3 at the time of publication, and our 10-day prediction window shows mixed signals. Prediction data is uploaded after the market close at 6 p.m., CST. Today’s data is based on market signals from the previous trading session.
Please share this Tradespoon Market Commentary with your friends.
![]()

![]()
Comments Off on


Tradespoon Tools make finding winning trades in minute as easy as 1-2-3.
Our simple 3 step approach has resulted in an average return of almost 20% per trade!

