 Save Big on Commissions ($0.65 per Contract)
CLICK HERE TO LEARN MORE
Save Big on Commissions ($0.65 per Contract)
CLICK HERE TO LEARN MORE
On Monday, all three major U.S. indices closed in positive territory as the nation prepared for the Independence Day holiday, which will result in the closure of markets on Tuesday. As the second half of the year begins, investors are closely monitoring the latest employment data and indicators of the overall health of the U.S. economy, given the lingering threat of further interest-rate hikes by the Federal Reserve.
This week, market participants will eagerly await the release of the Job Openings and Labor Turnover Survey on Thursday, followed by the June jobs report on Friday. These crucial employment figures are expected to shape market sentiment and play a significant role in the Federal Reserve’s upcoming monetary-policy decision.
The manufacturing sector’s performance was in focus as the Institute for Supply Management’s purchasing managers’ index for manufacturing revealed a contraction in June. The index dipped to 46, falling short of economists expectations for a reading of 47. Any value below 50 indicates a contraction in the sector. Following the report, the Dow Jones Industrial Average was down slightly, while the S&P 500 index remained flat. The Nasdaq Composite, on the other hand, experienced a modest gain.
As trading took a back seat with early market closures and the holiday, attention turned to the European and Asian markets. European stocks mostly edged higher despite eurozone data indicating a decline in manufacturing activity in June. However, London-listed pharmaceutical giant AstraZeneca faced a decline in its stock price due to disappointing results from a study on a lung cancer treatment. In Asia, equities enjoyed gains, particularly Chinese electric-vehicle manufacturers, which stood out as strong performers after reporting record monthly deliveries. Despite data showing a slowdown in Chinese manufacturing growth, Hong Kong’s market led the region with its upward trajectory.
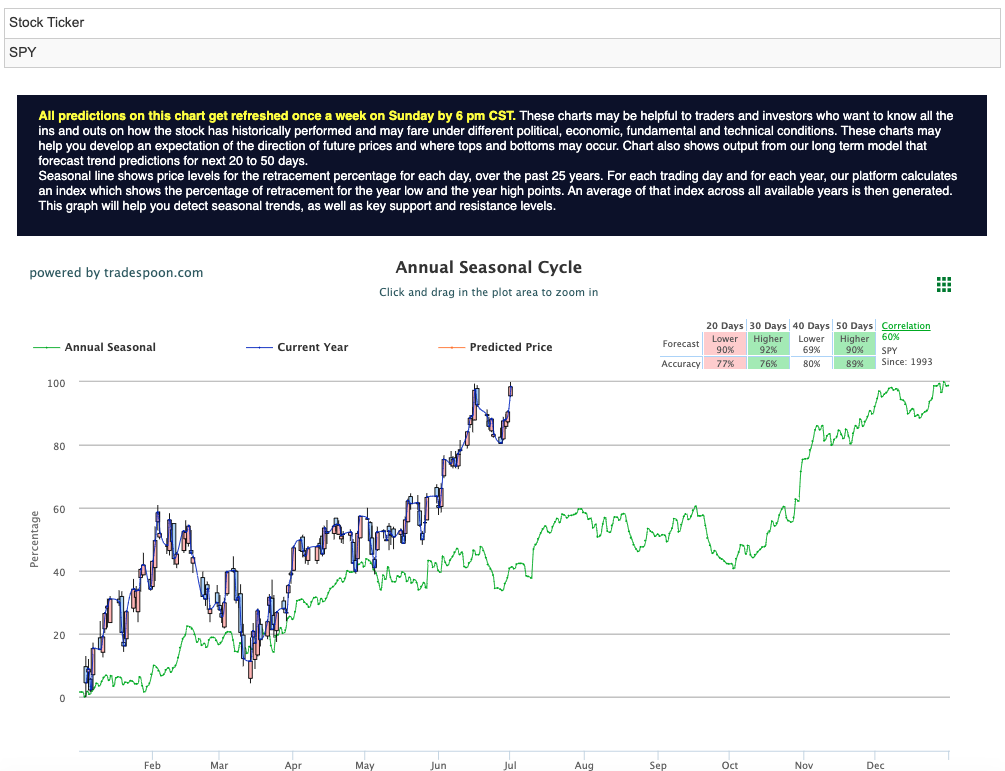
Looking ahead, investors remain cautious as the market is deemed overbought, and there are concerns about a potential retest of recent levels, with the SPY trading between 445 and 447. Staying above the August high could maintain the bullish trend, but a dip below 432 might trigger a quick retest of previous levels. Many market analysts retain a bearish outlook for the second half of the year, and the Q2 earnings season will prove critical in shaping the market direction, with results compared to the previous quarter being a significant determinant. For reference, the SPY Seasonal Chart is shown below:
As markets return to full activity after the Independence Day holiday, investors and analysts will keep a close eye on economic data and corporate earnings, anticipating any clues on the future trajectory of the U.S. economy and the Federal Reserve’s monetary policy.
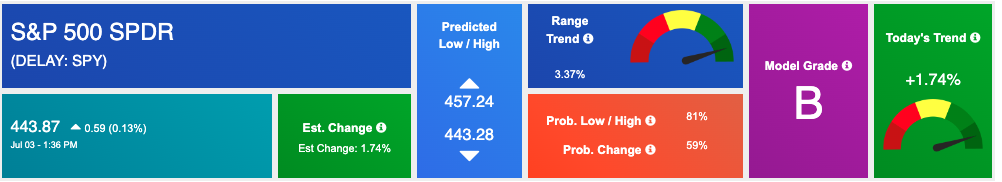
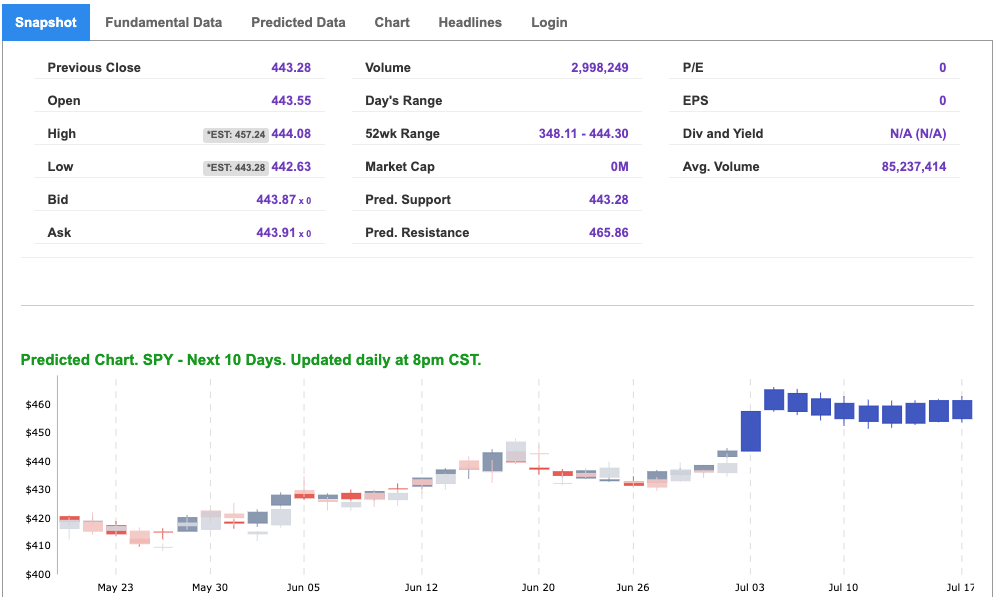
Using the “SPY” symbol to analyze the S&P 500 our 10-day prediction window shows a near-term mixed outlook. Prediction data is uploaded after the market closes at 6 p.m. CST. Today’s data is based on market signals from the previous trading session.
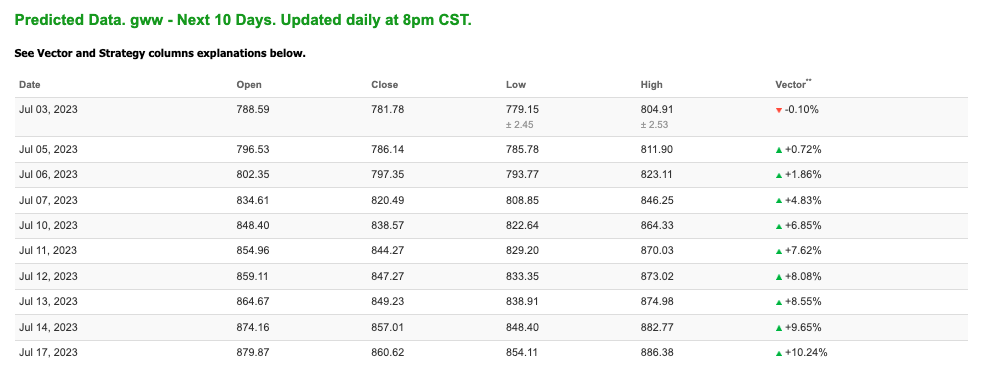
Note: The Vector column calculates the change of the Forecasted Average Price for the next trading session relative to the average of actual prices for the last trading session. The column shows the expected average price movement “Up or Down”, in percent. Trend traders should trade along the predicted direction of the Vector. The higher the value of the Vector the higher its momentum.
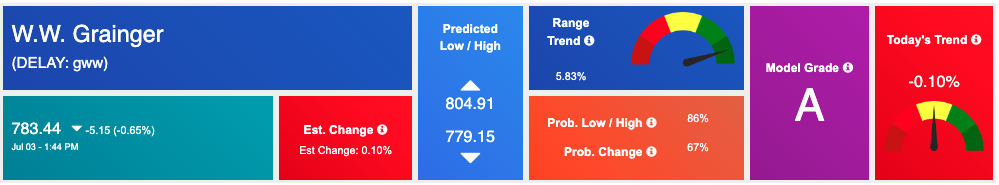
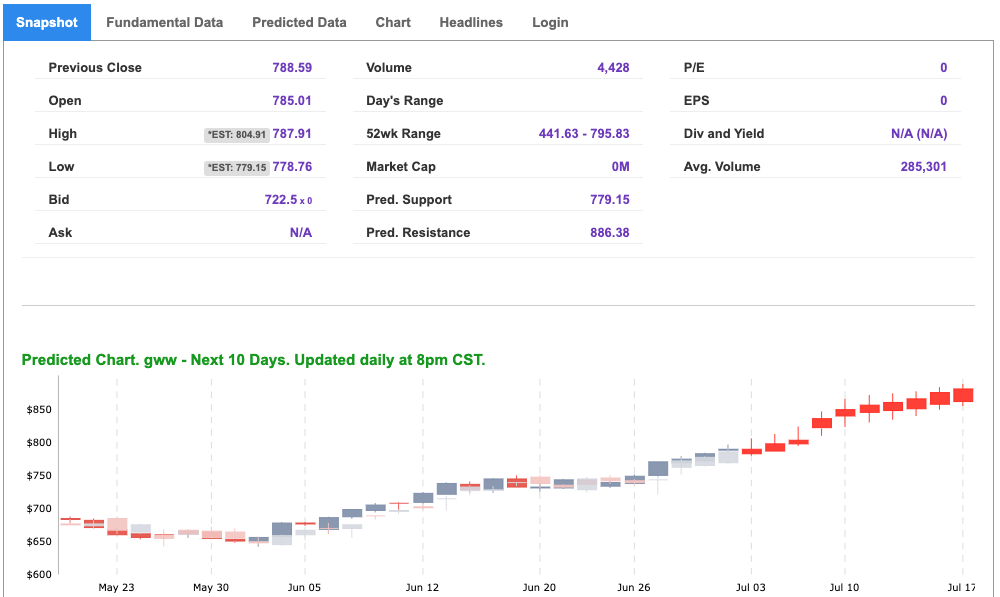
*Please note: At the time of publication Vlad Karpel does have a position in the featured symbol, gww. Our featured symbol is part of your free subscription service. It is not included in any paid Tradespoon subscription service. Vlad Karpel only trades his money in paid subscription services. If you are a paid subscriber, please review your Premium Member Picks, ActiveTrader, or MonthlyTrader recommendations. If you are interested in receiving Vlad’s picks, please click here.
West Texas Intermediate for Crude Oil delivery (CL.1) is priced at $69.99 per barrel, down 0.92%, at the time of publication.
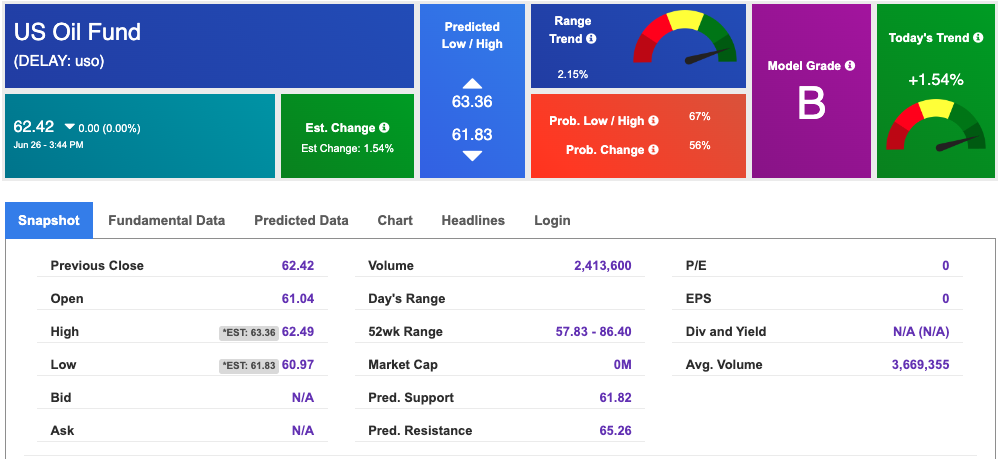
Looking at USO, a crude oil tracker, our 10-day prediction model shows mixed signals. The fund is trading at $62.42 at the time of publication. Prediction data is uploaded after the market close at 6 p.m., CST. Today’s data is based on market signals from the previous trading session.
The price for the Gold Continuous Contract (GC00) is down 0.03% at $1928.90 at the time of publication.
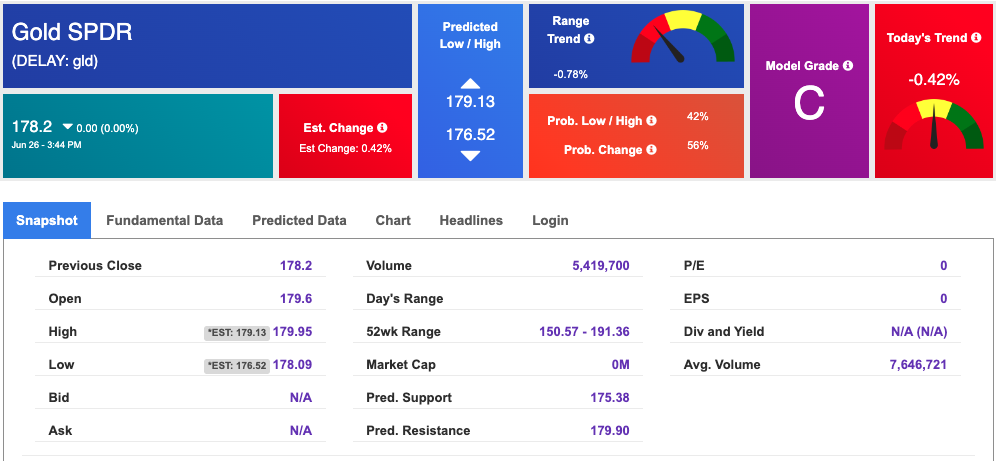
Using SPDR GOLD TRUST (GLD) as a tracker in our Stock Forecast Tool, the 10-day prediction window shows mixed signals. The gold proxy is trading at $178.2 at the time of publication. Vector signals show -0.42% for today. Prediction data is uploaded after the market close at 6 p.m., CST. Today’s data is based on market signals from the previous trading session.
The yield on the 10-year Treasury note is up at 3.858% at the time of publication.
The yield on the 30-year Treasury note is up at 3.869% at the time of publication.
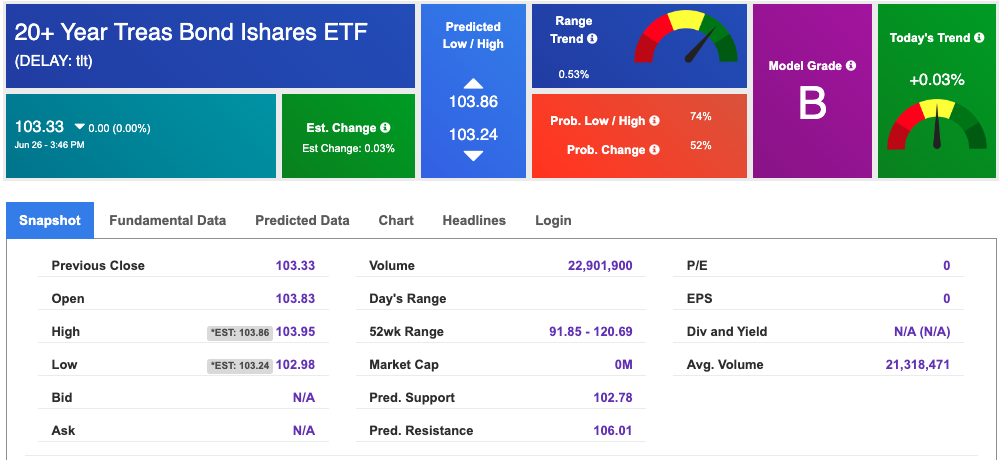
Using the iShares 20+ Year Treasury Bond ETF (TLT) as a proxy for bond prices in our Stock Forecast Tool, we see mixed signals in our 10-day prediction window. Prediction data is uploaded after the market close at 6 p.m., CST. Today’s data is based on market signals from the previous trading session.
The CBOE Volatility Index (^VIX) is priced at $13.57, down 0.15% at the time of publication, and our 10-day prediction window shows mixed signals. Prediction data is uploaded after the market close at 6 p.m., CST. Today’s data is based on market signals from the previous trading session.
Please share this Tradespoon Market Commentary with your friends.
![]()

![]()
Comments Off on


Tradespoon Tools make finding winning trades in minute as easy as 1-2-3.
Our simple 3 step approach has resulted in an average return of almost 20% per trade!

