 Special Offer: Try the 'WeeklyTrader Membership' for ONLY $37!
CLICK HERE TO LEARN MORE
Special Offer: Try the 'WeeklyTrader Membership' for ONLY $37!
CLICK HERE TO LEARN MORE
This week, U.S. equity markets are set to face a series of headwinds and catalysts that have shaped investor sentiment. Trade negotiations, Federal Reserve decisions, and a mix of corporate earnings results all contributed to the market’s volatility. Let’s break down the week’s developments and what they mean for the market.
Recap of Last Week: Trade Concerns and Economic Uncertainty
Last week, market sentiment was weighed down by escalating trade concerns and economic uncertainty. The U.S. was engaged in fresh tariff talks, with President Trump pushing for new levies—including tariffs on foreign-produced films and a partial agreement with the U.K. that would cap 100,000 vehicles per year at a reduced 10% tariff, down from the previous 25%. While this seemed like a step toward easing tensions, the limited nature of the deal fell short of investor expectations. Most U.K. imports would still face a 10% tariff, reigniting fears of a broader trade war.
In the wake of these developments, hopes for a broader resolution rested on high-level talks between U.S. Treasury Secretary Scott Bessent and Chinese officials in Geneva. As the week unfolded, optimism initially built in the markets. Equity futures rose and European stocks rallied as traders hoped for progress. However, those gains were short-lived when President Trump posted on Truth Social, hinting at a limited rollback of tariffs, which disappointed market expectations. By the end of the week, uncertainty lingered, with traders still unsure about the future of U.S.-China trade negotiations.
As expected, the Federal Reserve held interest rates steady at 4.25%–4.50% last week. Despite the slower momentum in the economy, Chair Jerome Powell emphasized that inflation remains elevated, making near-term cuts unlikely. The market had priced in some optimism for rate reductions later in the year, with traders speculating that cuts could come as early as July. However, Powell refrained from giving a clear timeline, keeping markets on edge about the Fed’s direction.
Mixed economic data added to this uncertainty. While April’s jobs report showed strong job growth of 177,000 new jobs and weekly jobless claims declined to 228,000, signs of weakness appeared elsewhere. Nonfarm productivity fell by 0.8% in Q1 2025, marking the steepest decline in nearly three years, and manufacturing data showed signs of stagnation. Consumer confidence was also on the decline, suggesting that the economy may be on the cusp of contraction. In contrast, the services sector continued to show strength, which painted a picture of an economy in transition, one that is not accelerating but also not yet in full contraction.
Earnings season provided further complexity to the market’s outlook. Positive earnings from Microsoft, Meta, and Alphabet, driven by strong cloud growth and digital advertising performance, helped buoy sentiment. However, some companies, including Affirm Holdings and Coinbase, underperformed, reflecting the challenges many companies face in the current environment.
A notable corporate headline last week was the announcement from Warren Buffett that he would step down as CEO of Berkshire Hathaway by the end of the year. While Buffett’s successor, Greg Abel, had long been expected, the news still rattled markets, with shares of Berkshire Hathaway falling over 4%. This, combined with Berkshire’s declining Q1 operating profit and a growing frustration over its massive cash position, added to the market’s unease.
This Week: Optimism Returns with Trade Deal, Fed Expectations and Market Movements
Fast forward to today, and the mood has shifted dramatically. Stocks are soaring after a breakthrough in U.S.-China trade talks, which led to a sharp reduction in tariffs. After weekend negotiations in Geneva, both sides agreed to temporarily slash tariffs on each other’s goods, marking a significant step toward easing tensions. The tariff on Chinese goods dropped from 145% to 30%, while U.S. tariffs on Chinese imports were reduced to 10%. The deal, which pauses most tariffs for 90 days, has led to a “risk-on” rally in the market, as investors are more confident in the potential for improved trade relations.
The agreement has caused a rush into riskier assets, with stocks climbing and safe-haven assets, like Treasuries, falling. The 10-year Treasury yield spiked to 4.448%, reflecting reduced demand for bonds. Meanwhile, the CBOE Volatility Index (VIX), a key measure of market fear, dropped to 19.55, signaling relative calm after the recent trade turbulence.
This positive sentiment was further bolstered by strong moves in key stocks. Amazon, Meta, Apple, and Nvidia, all part of the “Magnificent Seven” tech stocks, saw significant gains. The tariff reduction deal is expected to reduce supply chain concerns, and analysts believe it could lead to new highs for the market and tech stocks in 2025. Tesla, which has significant exposure to China, saw a 6.8% rise as well, benefiting from the improved trade outlook.
In addition to trade optimism, corporate earnings continued to make waves. Eli Lilly, Pfizer, Merck, and Bristol Myers Squibb all saw solid gains, as their stocks climbed between 2% and 4%. In contrast, NRG Energy stood out with a remarkable 24% increase, following the announcement of a $12 billion acquisition of natural gas generation facilities.
Looking ahead, investors are closely watching key economic reports, including the upcoming CPI and PPI inflation data. These reports will play a crucial role in shaping expectations for monetary policy. On Monday, the chances of a rate cut in June fell sharply to 8.1%, from a previous 17.2%, with the likelihood of a rate cut through July also declining to 40.4%. The market is now anticipating a cut through September, with the probability standing at 81.3%, down from 89.9% earlier in the week. These changes highlight how economic expectations have been influenced by the latest trade deal, shifting the focus from aggressive rate cuts to more measured action from the Fed.
Market Outlook: Cautious Optimism with Risk Still on the Horizon
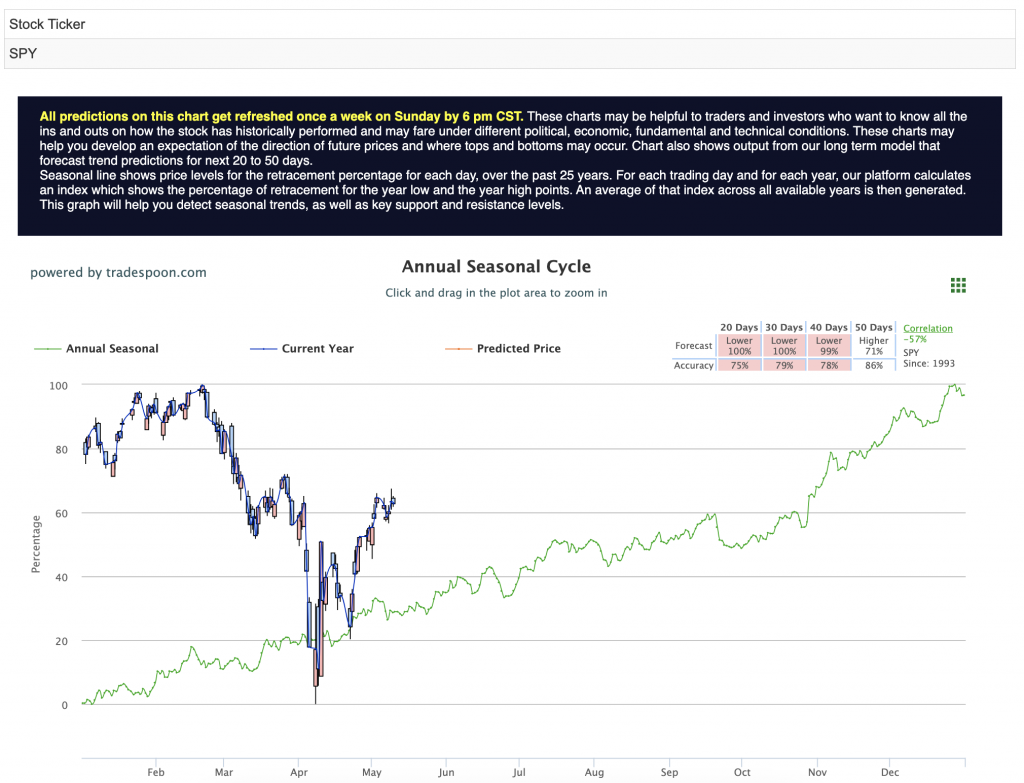
While Monday’s rally was a clear positive, the overall market outlook remains cautious. With trade tensions easing, there is optimism that global trade could improve, but the economic challenges of inflation and productivity decline are not yet resolved. The S&P 500 remains range-bound, with support between 500 and 530 and resistance around 565 to 580. The risk of market volatility remains, especially with earnings season winding down and macroeconomic pressures lingering. For reference, the SPY Seasonal Chart is shown below:
In short, while the U.S.-China trade deal has provided a short-term boost, investors should remain vigilant. The tariff reductions are a positive development, but the broader economic picture, marked by concerns over inflation, productivity, and corporate earnings, still warrants caution. Traders should stay selective, and long-term investors should remain disciplined as the market navigates these complex conditions.
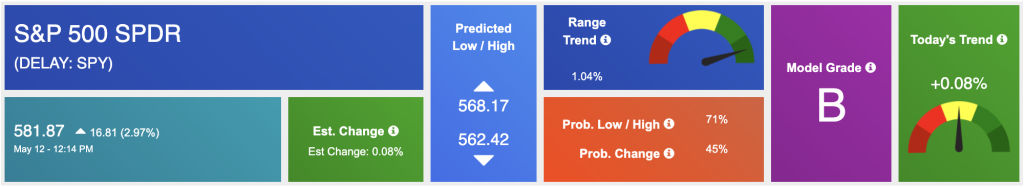
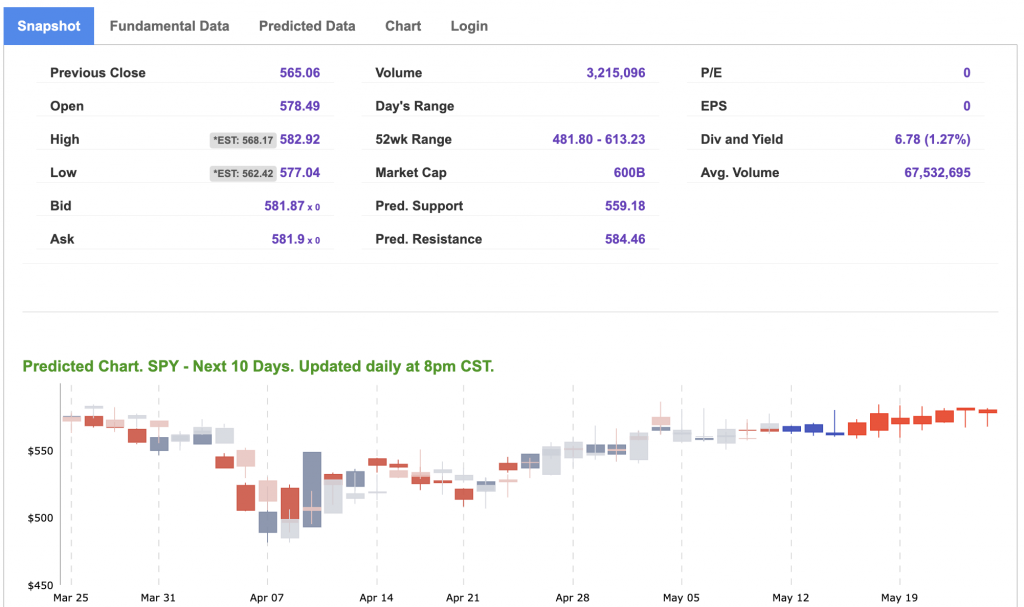
Using the “SPY” symbol to analyze the S&P 500, our 10-day prediction window shows a near-term positive outlook. Prediction data is uploaded after the market closes at 6 p.m. CST. Today’s data is based on market signals from the previous trading session.
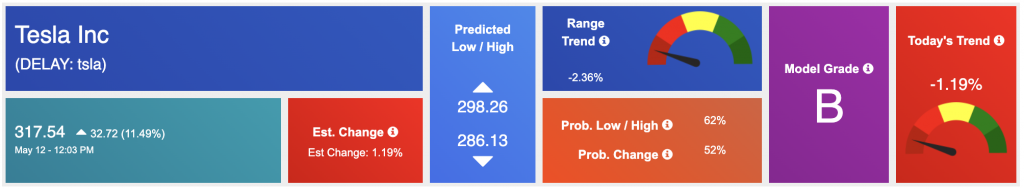
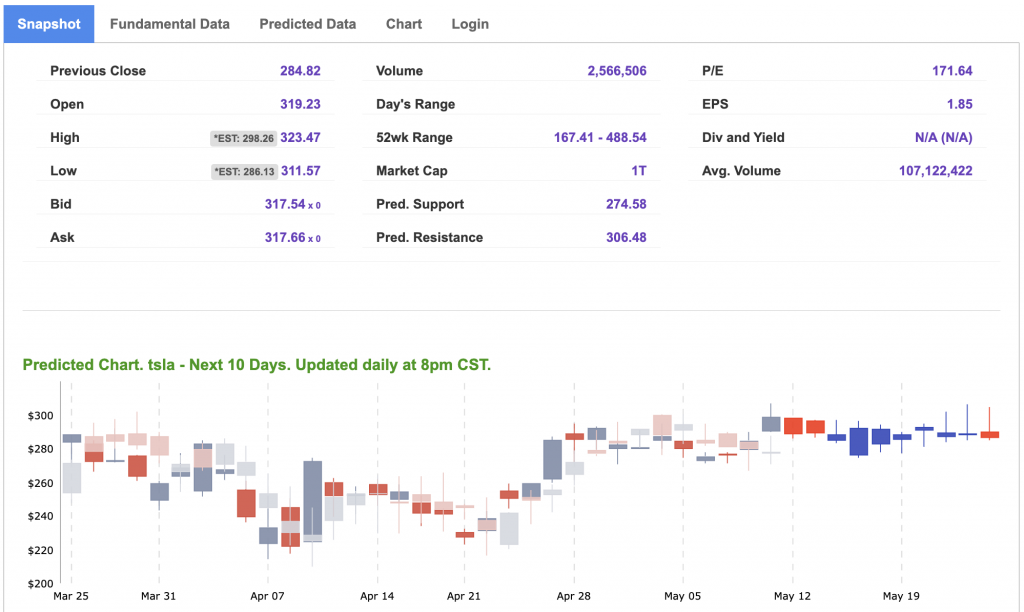
Our featured symbol for Tuesday is TSLA. Tesla Inc. – TSLA is showing a steady vector in our Stock Forecast Toolbox’s 10-day forecast.
The symbol is trading at $317.54 with a vector of -1.19% at the time of publication.
10-Day Prediction data is uploaded after the market close at 6 p.m., CST. Today’s data is based on market signals from the previous trading session.
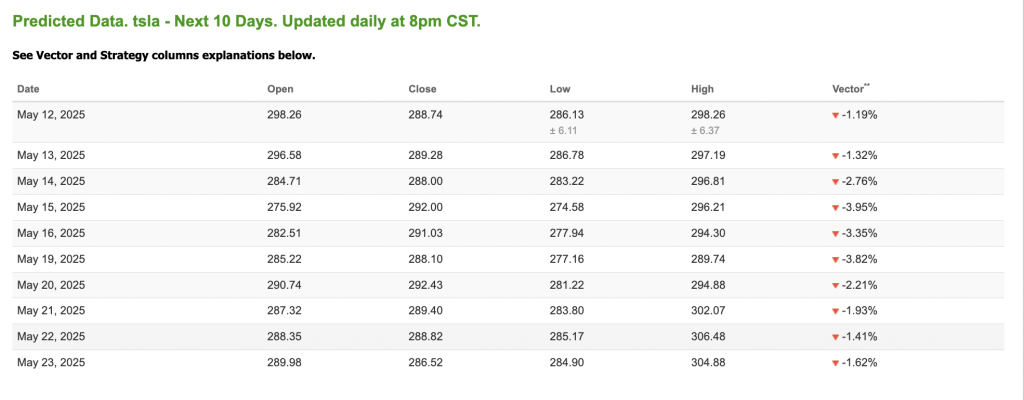
Note: The Vector column calculates the change of the Forecasted Average Price for the next trading session relative to the average of actual prices for the last trading session. The column shows the expected average price movement “Up or Down”, in percent. Trend traders should trade along the predicted direction of the Vector. The higher the value of the Vector the higher its momentum.
*Please note: At the time of publication, Vlad Karpel does have a position in the featured symbol, TSLA. Our featured symbol is part of your free subscription service. It is not included in any paid Tradespoon subscription service. Vlad Karpel only trades his money in paid subscription services. If you are a paid subscriber, please review your Premium Member Picks, ActiveTrader, or MonthlyTrader recommendations. If you are interested in receiving Vlad’s picks, please click here.
West Texas Intermediate for Crude Oil delivery (CL.1) is priced at $62.21 per barrel, up 1.98%, at the time of publication.
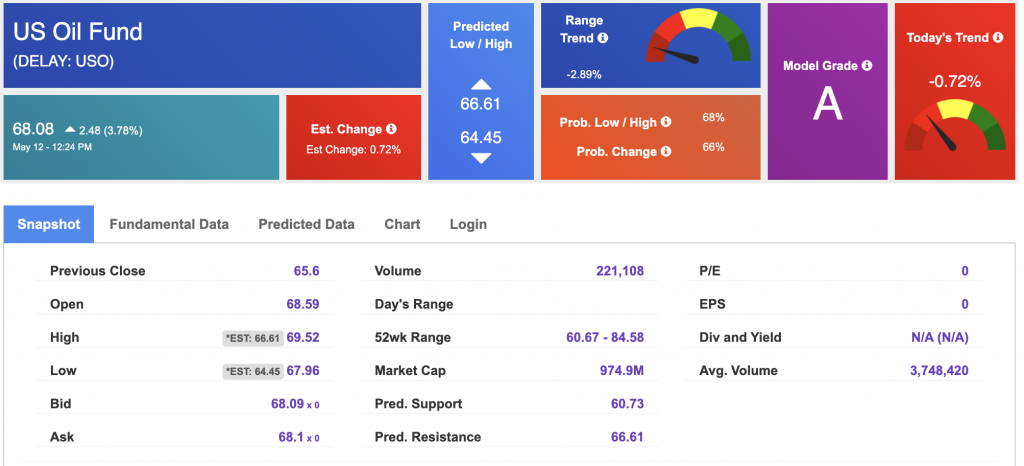
Looking at USO, a crude oil tracker, our 10-day prediction model shows mixed signals. The fund is trading at $68.08 at the time of publication. Prediction data is uploaded after the market close at 6 p.m., CST. Today’s data is based on market signals from the previous trading session.
The price for the Gold Continuous Contract (GC00) is down 3.43% at $3,229.50 at the time of publication.
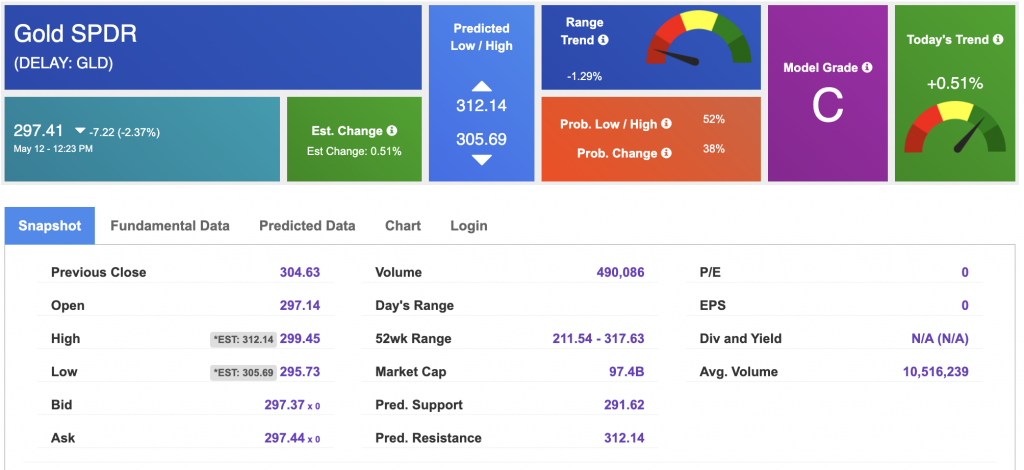
Using SPDR GOLD TRUST (GLD) as a tracker in our Stock Forecast Tool, the 10-day prediction window shows mixed signals. The gold proxy is trading at $297.41 at the time of publication. Vector signals show +0.51% for today. Prediction data is uploaded after the market close at 6 p.m., CST. Today’s data is based on market signals from the previous trading session.
The yield on the 10-year Treasury note is up at 4.456% at the time of publication.
The yield on the 30-year Treasury note is up at 4.88% at the time of publication.
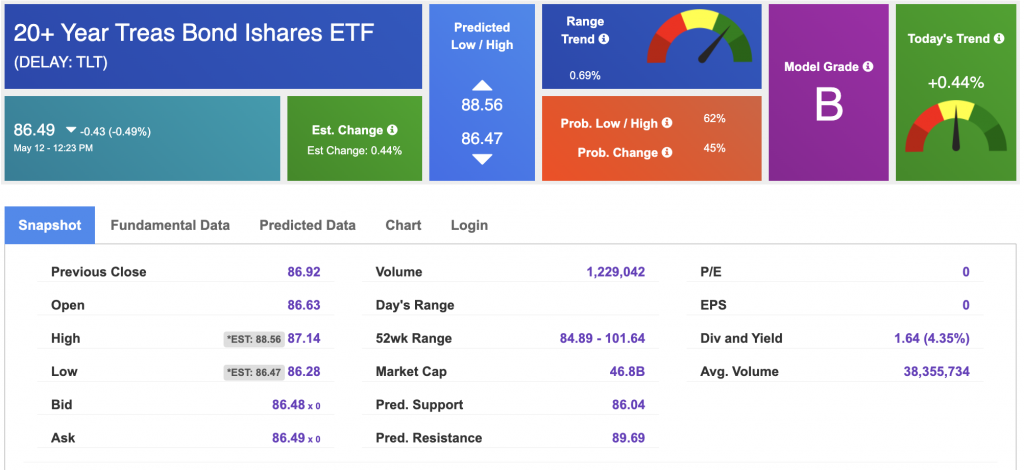
Using the iShares 20+ Year Treasury Bond ETF (TLT) as a proxy for bond prices in our Stock Forecast Tool, we see mixed signals in our 10-day prediction window. Prediction data is uploaded after the market close at 6 p.m., CST. Today’s data is based on market signals from the previous trading session.
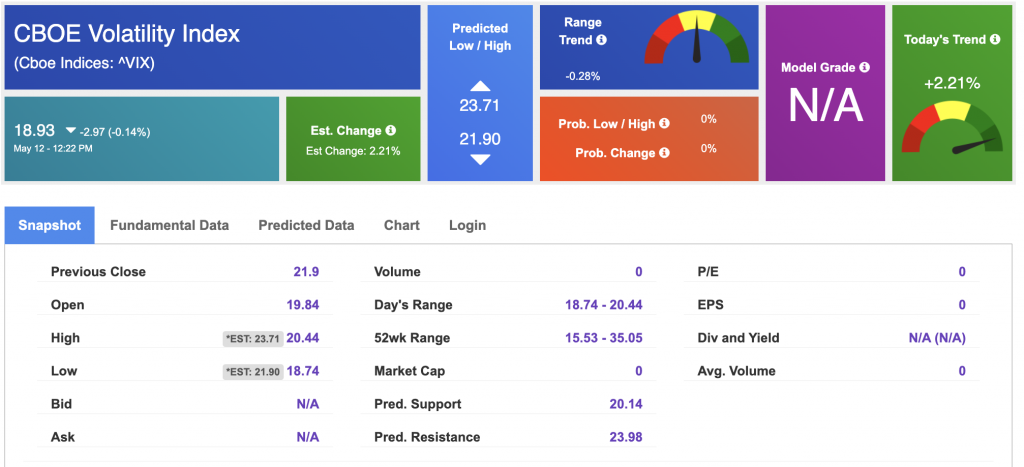
The CBOE Volatility Index (^VIX) is priced at $18.93 at the time of publication, and our 10-day prediction window shows mixed signals. Prediction data is uploaded after the market close at 6 p.m., CST. Today’s data is based on market signals from the previous trading session.
Please share this Tradespoon Market Commentary with your friends.
![]()

![]()
Comments Off on


Tradespoon Tools make finding winning trades in minute as easy as 1-2-3.
Our simple 3 step approach has resulted in an average return of almost 20% per trade!

